Acknowledgements
We would like to thank Richard Humphries, Jessica Morris, Helen Buckingham, Joshua Kraindler, Anita Charlesworth, Nihar Shembavnekar, Charles Tallack, Ruth Thorlby, and Jennifer Dixon for their comments on earlier drafts of the paper. We are also grateful for the contribution of other Health Foundation staff. Errors or omissions remain the responsibility of the authors alone.
Copyright acknowledgements
Contains public sector information licensed under the Open Government Licence v3.0.
Incorporates data reproduced from www.skillsforcare.org.uk.
When referencing this publication please use the following URL: https://doi.org/10.37829/HF-2020-P02
Key points
- The adult social care system in England is broken and needs fixing. Debates about reform often focus on older people and the risk of them having to sell their homes to pay for social care.
- What often gets missed are the issues facing younger adults needing social care – people aged 18–64 with learning disabilities, mental health problems and other social needs – and the care they need to support their independence and wellbeing. This publication presents analysis of publicly available data to understand the needs of younger adults in the social care system, how they differ from those of older people, and how these needs are changing.
- Adults aged 18–64 are a core part of the social care system in England. They make up around a third of care users and over half of local authority spending on social care. The care they receive is very different to older people – including more support in the community.
- The number of younger adults with care needs is growing quickly, and is projected to grow significantly over the coming years. The proportion of younger adults reporting a disability increased from 14% in 2007/08 to 18% in 2017/18. When combined with population growth, the number rose by 35%. The number of people with severe learning disabilities is projected to increase by 34% between 2017 and 2027.
- Many younger adults are likely to be going without the care they need. Estimated care needs have been growing over the last decade, but the number of people accessing public support has fallen. Spending on social care services has not grown fast enough to keep up with demand.
- When younger adults do access social care, quality and outcomes vary. The majority (89%) of younger adults using adult social care services report being satisfied with them. But there is evidence of poor quality care, and national targets on supporting people with a learning disability or autism to live in the community have been repeatedly missed. Very low proportions of younger adults receiving care for learning disabilities (6%) and mental health problems (8%) are in paid employment.
- Unpaid carers of younger adults experience worse outcomes in some areas than carers of older people. They are less likely to be satisfied with services, and more likely to report financial difficulties and not be in paid employment because of their caring role. The impacts of unpaid care aren’t experienced equally; unpaid carers of younger adults are more likely to be younger and female than carers of older people.
- Workforce problems are chronic across the social care system. More nurses will be needed in future to care for the growing number of younger adults with learning disabilities. Yet learning disability nursing courses are struggling to attract students, have particularly high drop-out rates, and are becoming financially unsustainable.
- Policies to improve and reform adult social care in England will not be successful unless they understand the needs of younger adults and how they differ to older people. This group of the population must not get forgotten in the policy debate about social care.
- The government’s pledge of ensuring that nobody will need to sell their home to pay for care will do little to improve the lives of many younger adults with social care needs. Policy action is also needed to boost access to publicly funded care and improve quality of these services – both of which will require additional government investment.
Summary of findings: Key differences identified between younger adult (18–64) and older adult (65+) care and support
|
Compared to older people receiving care |
|
|
What type of support is provided by local authorities? |
Younger adults are more likely to receive local authority support for learning disabilities and mental health issues than physical disabilities (Table 2) |
|
Where is the support provided? |
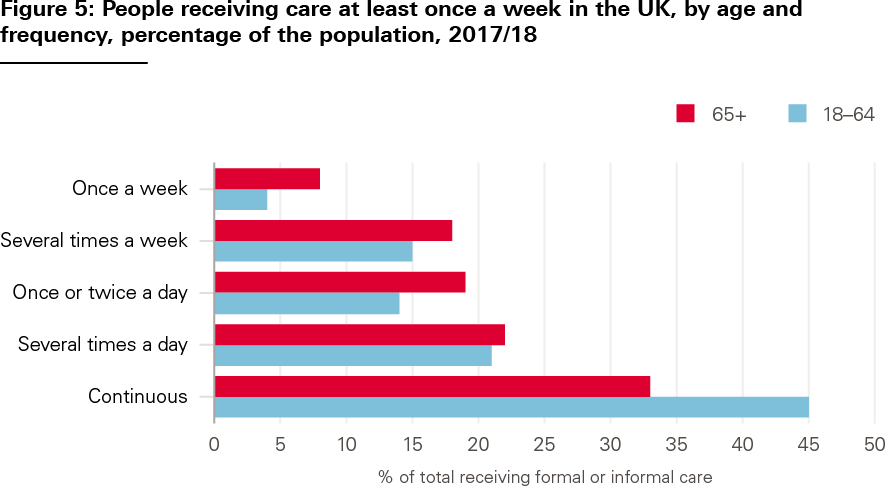
Younger adults are more likely to receive local authority support in the community compared to residential or nursing homes (Table 3). More younger adults require continuous support (Figure 6) |
|
Who pays? |
Younger adults are less likely to contribute to their care costs and it is likely there are fewer self-funders (page 6/7) |
|
How are services paid for? |
Younger adults are more likely to receive direct payments to organise their care compared to the local authority organising and paying for their care directly (Table 4) |
|
Who provides care? |
Younger adults are more likely to receive care from specialist nurses. Unpaid carers are more likely to be younger, female and not in paid employment because of their caring role (Table 6/7) |
|
What are the trends in self-reported disability and care needs? |
The proportion and numbers of younger adults reporting a disability are rising more quickly. Younger adults are more likely to have a mental health or learning disability need (chapter 2) |
|
What happens when people contact the local authority about accessing services? |
A higher proportion of younger adults are signposted to non-council services, provided with universal services like information and advice, or provided with no service (Figure 8) |
|
How satisfied are service users? |
Younger adults with learning disabilities, who receive services, tend to be more satisfied (Table 9) |
|
What outcomes do unpaid carers report? |
Carers of younger people are less likely to be satisfied with social care services and more likely to find it difficult to find information about services or feel involved in discussions about services than carers of older people. Carers of younger people are more likely to report financial difficulties as a result of their caring responsibilities (Tables 10 and 12) |
|
What has happened to spending on social care services by local authorities compared to need? |
Spending on younger adults has grown faster in recent years. For both older and younger adults it seems that spending and the numbers receiving formal care packages have not kept up with need (chapter 2, Figures 9 and 12) |
|
What has happened to the costs of care? |
The costs of younger adult packages of care have grown more slowly in recent years (Figure 13) |
|
What do people report about their quality of life? |
Younger people with learning disabilities, who are accessing services, report a higher quality of life (Table 11) |
Introduction
Adult social care in England is widely thought to be inadequate, unfair and unsustainable. The current system is a threadbare safety net: publicly funded care is only available to people with the highest needs and lowest means. Reductions in spending since 2010 mean that many people go without the care they need,, and care providers are at risk of collapse., Social care services also face staffing gaps estimated at around 122,000 – an issue likely to be exacerbated by changing migration trends as a result of the UK leaving the European Union. An estimated 8.8 million adults provide unpaid care in the UK, and this number is growing.
The current government, like many before it, has pledged to fix the growing problems in social care. Ministers in the Department of Health and Social Care have been working on a green paper on social care reform since 2017. And, following Boris Johnson’s promise to ‘fix the crisis in social care’ in his first speech as prime minister, the Conservative party’s 2019 general election manifesto pledged to ‘bring forward an answer that solves the problem’.
But what problems will be fixed, and for whom? Policy debates about social care typically focus on older people. Boris Johnson’s promise to fix the crisis, for example, was based on ‘giving every older person the dignity and security they deserve’. Meanwhile, the Labour party’s headline social care policy at the 2019 election was to offer ‘free personal care’ for older people (aged 65+). A big concern for many politicians – from Blair to Johnson – has been the risk of older people selling their homes to pay for care. The Conservative party’s ‘one condition’ for care reform is that ‘nobody needing care should be forced to sell their home to pay for it’.
What often gets missed in these debates are issues facing younger people needing adult social care services. People aged between 18–64 with learning disabilities, mental health problems, and other social needs are a core part of the social care system. They make up around a third of care users accessing long-term support in England and over half of local authority spending on social care. Around 40% of local authorities responding to the ADASS budget survey in 2019 report that the needs of younger adults are the greatest concern in terms of pressures on budgets. At the same time, wider welfare policy changes over the last decade have affected the level and type of support available to younger adults from the state. These include real terms cuts to working-age benefits and the major overhaul of the benefits system. These policy changes may have contributed to increased psychological distress among unemployed people.
The risk of selling family homes and shouldering large social care costs are likely to be lower down the list of concerns for younger adults needing social care. Younger people are more likely to live in households with lower levels of wealth and are much less likely to own their own homes. Younger adults’ care needs can also differ significantly to older people’s, focused more on living independently in the community and less on physical support in care homes. The Care Act 2014 emphasises the role of local authorities in meeting these needs through promoting wellbeing – including by improving people’s participation in work, education or training, suitability of accommodation, and people’s contribution to society.
Policies to improve and reform adult social care in England are unlikely to be successful unless they understand and address the needs of younger adults. Yet these needs are poorly understood. In this analysis, we use publicly available data to provide an overview of the needs of adults aged 18–64 in the social care system and the services they receive, compare data on younger and older adults accessing social care, and identify five implications for policy.
Data and approach
To make sense of the available data, we have split our analysis into four sections reflecting different aspects of the social care system (drawing on frameworks used to understand the different components of health systems):,
- System context – covering data on what the system looks like, including types of services and organisations, characteristics of service users, funding and workforce.
- Care needs – including data on self-reported disability and levels of care needs.
- System performance – including access, quality and costs of care.
- Outcomes – including data on quality of life for service users and unpaid carers.
Where possible, we have analysed the data to understand trends over time, regional variation, differences in care needs and disability, and differences between services and outcomes for younger adults and older people. As most younger adults receiving social care support have needs related to a learning disability, we analyse data for this group separately where possible.
We use publicly available data from a range of sources, including the Adult Social Care Survey (ASCS), the Personal Social Services Survey of Adult Carers in England (SACE), the Family Resources Survey (FRS) and NHS Digital. Annex 1 provides a full list of data sources. Unless otherwise stated, data refer to adult social care services and users in England.
Figures in the analysis have been rounded to make them easier to interpret. All financial information is presented in real terms in 2020/21 prices, using the most up to date GDP deflator. This means that figures quoted here may differ from other published sources.
Overall, there is a lack of good quality data on adult social care services, which limits our understanding of how the system works for younger adults and unpaid carers. There are several areas where data do not exist, or where breaks in the data mean that it is not possible to show changes over time. We have highlighted these issues in Annex 1 and identified gaps where more or better data would improve our understanding and ability to assess policy.
Our analysis is also not exhaustive. We focus primarily on the services that younger adults receive, such as support in the community for people with learning disabilities. But social workers also carry out a variety of other roles in supporting and protecting children, younger adults, and older people – including safeguarding, advocacy, needs assessment, and counselling. While these roles are important to support people’s wellbeing, there are limited administrative data available related to these roles, so they were considered out of scope.
Throughout this publication, we use the term ‘younger adults’ to describe people aged 18–64 with social care needs. This group are often referred to elsewhere as ‘working-age adults’, but we think this language makes outdated assumptions about people’s age and employment.
System context
Younger adults and older people are supported in the same social care system, but the types of services provided to them – and how these are commissioned – can differ. This chapter presents data on what the social care system looks like for younger adults. We describe the kinds of support available and the number of people accessing them. We also look at where younger adults’ care is provided, how these services are paid for, and who is providing their care and support.
Number of adults and reason for support
Around 293,000 younger adults received long-term support from local authorities in England in 2018–19 (see Table 1). This represented around 35% of all adults receiving support.
Table 1: Number of people receiving long-term support from their local authority in England, 2018–19
|
Younger adults |
Older people |
Total |
|
|
Numbers receiving long-term support at any point in the year |
293,000 |
548,000 |
842,000 |
|
Percentage of total |
35% |
65% |
Source: Table 33; Adult Social Care Activity and Finance Report, England – 2018–19, NHS Digital, 2019; numbers rounded so will not match identically with original sources and may not tally when added.
Younger adults receive care and support for a diverse range of needs (see Table 2). The single largest reason for younger adults accessing social care services is for support with a learning disability (46%) and many access support for mental health problems (20%). By contrast, only 10% of older people receive support primarily for these two reasons. It is much more common for older people to receive physical support, with three-quarters of older social care users accessing services for this reason, compared to just under a third for younger adults.
Table 2: Number of younger adults and older people receiving support from their local authority in England, by primary support reason, at any point in 2018/19
|
Primary support reason |
Number of younger adults receiving long-term support |
% of younger adults |
Number of older people receiving long-term support |
% of older people |
Total receiving support |
Younger adults as a proportion of total younger adults and older people |
|
Physical support |
86,000 |
29% |
405,000 |
74% |
490,000 |
18% |
|
Sensory support |
8,000 |
3% |
79,000 |
14% |
88,000 |
9% |
|
Learning disability support |
134,000 |
46% |
17,000 |
3% |
151,000 |
89% |
|
Mental health support |
59,000 |
20% |
36,000 |
7% |
95,000 |
62% |
|
Social support (substance misuse, asylum seeker, social isolation) |
7,000 |
2% |
11,000 |
2% |
19,000 |
37% |
|
Total |
293,000 |
548,000 |
842,000 |
35% |
Source: Table 35, Adult Social Care Activity and Finance Report, England – 2018–19, NHS Digital, 2019; numbers rounded so will not match identically with original sources and may not tally when added, percentages calculated on rounded figures.
Types of services and providers
Depending on their eligibility, younger adults can access a range of different care services. This support varies widely depending on people’s needs – from home help, accommodation, home adaptions and transport services, to counselling, day centres, safeguarding and help with employment and volunteering opportunities. An autistic person, for example, might attend a day centre providing them with employment advice, adult education classes and other services, while also receiving support to participate in social activities elsewhere in the community. A young person with a physical disability affecting their mobility, meanwhile, might receive more support at home to help them wash, dress and get up in the morning.
Organisations providing support for younger adults make up a substantial proportion of the social care market. At the end of 2019, the Care Quality Commission (CQC) reported that there were around 49,500 places where it regulated care. Around 30% provided services to younger adults, 25% for people with learning disabilities or autism, and 20% for mental health problems (younger adults make up around 35% of all people receiving support).
Of those younger adults receiving long-term support, the majority (84%) received care in the community, compared with residential care (13%) and nursing care (2%) (see Table 3). Older people are much more likely to receive support in residential and nursing homes.
Table 3: Number of younger adults and older people receiving long-term support in England, by setting, 2018–19
|
Number of younger adults receiving long-term support (any point in year) |
% of younger adults |
Number of older people receiving long-term support (any point in year) |
% of older people |
|
|
Nursing |
7,000 |
2% |
74,000 |
13% |
|
Residential |
39,000 |
13% |
141,000 |
26% |
|
Community |
247,000 |
84% |
333,000 |
61% |
|
Prison |
200 |
0.1% |
200 |
0.03% |
|
Total |
293,000 |
|
548,000 |
|
Source: Table 34, Adult Social Care Activity and Finance Report, England – 2018–19, NHS Digital, 2019; numbers rounded so will not match identically with original sources and may not tally when added, percentages calculated on rounded figures.
Shifting more health and social care into the community has been a longstanding policy goal in England (see Chapter 4 on outcomes). Figure 1 illustrates the regional variation in the number of younger adults receiving support in residential or nursing homes to meet their long-term care needs. This variation has been broadly stable over the last 3 years.
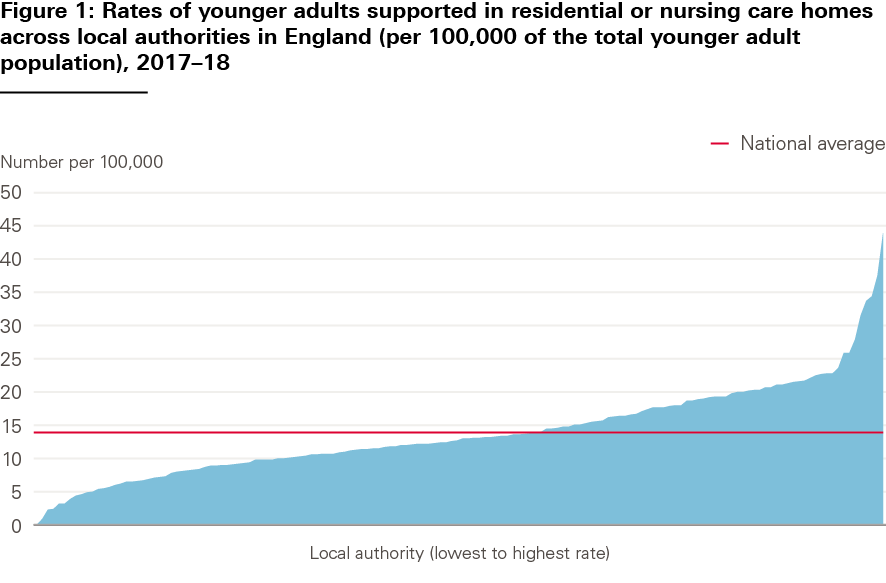
Source: Indicator 2(A) 1, Measures from the Adult Social Care Outcomes Framework, England – 2017–18, NHS Digital, 2018.
Funding and eligibility
Social care for younger adults is funded in the same way as care for older people. A person’s eligibility for care is based on both a means test and a needs test – with local authority funding only available to people with the lowest means and highest care needs. People with assets above £23,250 fund their own social care, rely on unpaid care from family and friends, or go without. Even if people are eligible for local authority funded social care, they may be required to make some contribution if their assets and incomes are above a certain level. These are known as user charges.
Information is not available on the number of younger adults paying for their own care – often called ‘self-funders’. But financial data from local authorities tells us that the total income they receive from social care user charges is far lower for younger adults than older adults. In 2018/19, social care user charges for younger adults were £630m: 9% of the value of expenditure by local authorities. User charges for older people, meanwhile, were around £2.2bn: 40% of the value of expenditure by local authorities. This suggests that there is less reliance on self-funded care among younger adults compared with older people – which would make sense, given that most younger people will have built up fewer assets over their lifetimes than older people, and are also unlikely to have income from a pension.
Paying for services
If people are eligible for local authority funded care, there are several ways that relevant services can be chosen and paid for. This includes care and support commissioned directly by the local authority (where the local authority arranges and pays for services on behalf of a service user), direct payments (where the local authority transfers funding to individuals to manage their care and payments themselves), personal budgets managed by the local authority (where a local authority spends an individual’s budget according to their care plan), or some combination of individual and local authority payments. Personal budgets and direct payments have been promoted by policymakers to try to increase user choice and control.
Table 4 shows local authority data on how long-term support in the community was commissioned in 2018–19, comparing younger adults with those aged 65+. Almost 40% of younger adults received a direct payment or part direct payment, compared with only around 16% of older people. Commissioning of support also varies depending on the reason a person receives support. For example, a higher proportion of younger adults receiving physical or sensory support take up direct payments than those with a learning disability (see Table 5). Several factors may explain variation in take-up of direct payments, such as younger adults with physical disabilities being more able to manage commissioning their own care.
Table 4: How local authority funded community services in England are paid for, by age group, 2018–19
|
Payment type |
Number of younger adults |
% of younger adults |
Number of older people |
% of older people |
|
Direct payment only |
71,000 |
29% |
39,000 |
12% |
|
Part direct payment |
26,000 |
11% |
14,000 |
4% |
|
LA managed Personal budget |
115,000 |
47% |
240,000 |
72% |
|
LA commissioned support only |
36,000 |
15% |
40,000 |
12% |
|
Total |
247,000 |
333,000 |
Source: Table 34, Adult Social Care Activity and Finance Report, England – 2018–19, NHS Digital, 2019; numbers rounded so will not match identically with original sources, percentages calculated on rounded figures.
Table 5: How local authority funded community services are paid for: younger adults, by primary support reason, England, 2018–19
|
Nursing |
Residential |
Community – part or direct payment |
Community CASSR managed personal budget |
Community CASSR commissioned support only |
Prison CASSR managed personal budget or commissioned support only |
|
|
Physical support |
4% |
6% |
45% |
39% |
5% |
0% |
|
Sensory support |
1% |
8% |
55% |
32% |
5% |
0% |
|
Support with memory and cognition |
12% |
22% |
25% |
33% |
7% |
0% |
|
Learning disability support |
1% |
18% |
32% |
43% |
6% |
0% |
|
Mental health support |
3% |
15% |
16% |
32% |
34% |
0% |
|
Social support (substance misuse, asylum seeker, social isolation) |
1% |
6% |
42% |
44% |
7% |
0% |
Source: Table 39, Adult Social Care Activity and Finance Report, England – 2018–19, NHS Digital, 2019
CASSR = Councils with Adult Social Services Responsibilities in England; percentages have been rounded so columns may not sum to 100%
Other government support
Younger adults accessing the social care system may also receive other kinds of state support, such as personal independence payment (PIP) for people below state pension age with long-term health conditions and disabilities. Personal Independence Payment (PIP) is a benefit that helps with the extra costs of a long-term health condition or disability for people aged 16+. There has been a big increase in spending on PIP over recent years – growth of more than 40% since 2014/15 – potentially reflecting rising levels of need among this age group (see Care needs and chapter 2) and the way that eligibility for PIP works. In-depth analysis of expenditure on different kinds of state support for care and disability will be published in an upcoming Health Foundation report.
Who provides care?
Most people providing adult social care are the unpaid families of people with care needs. Estimates vary, but Carers UK analysis suggests that the number of unpaid adult carers in the UK is around 8.8 million. There are a further, estimated 800,000 child carers in England. According to the Family Resources Survey, 92% of unpaid carers look after relatives.
There are no good data on the proportion of unpaid carers who care for younger adults (compared with older people or children). However, looking at the results of the Personal Social Services SACE by age of cared-for person gives some indication of the different characteristics of unpaid carers of younger adults and those of older people (see Table 6). The latest data suggest that people providing unpaid care to younger adults are more likely to be younger themselves, female, not in paid employment because of their caring role, and have caring responsibilities for more than one person.
Table 6: Demographics of unpaid adult carers of adult social care users in England, 2018–19
|
Carers of people aged 18–64 |
Carers of people with a learning disability or difficulty |
Carers of people aged 65+ |
|
|
Aged 18–64 |
70% |
63% |
35% |
|
Female |
72% |
77% |
66% |
|
Not in paid employment because of their caring role |
35% |
40% |
16% |
|
Have caring responsibilities for someone else |
62% |
64% |
43% |
Source: Personal Social Services Survey of Adult Carers in England 2018–19, NHS Digital, 2019.
The formal social care workforce is smaller than the informal workforce. An estimated 1.5 million people work in adult social care in England. Around 835,000 adult social care jobs involve providing care for people with dementia, 685,000 involve care for people with learning disabilities and autism, and 555,000 involve care for people with mental health needs (see Table 7). A relatively high proportion (21%) of roles in learning disabilities and autism care are specialist, which means they provide care for people with these needs only.
A larger proportion (6%) of roles in learning disabilities and autism support people who receive direct payments than in mental health care (2%) and dementia care (1%). This corresponds to the greater use of direct payments to organise care for learning disabilities (see Table 5) and for younger adults compared with older people (see Table 4).
While higher proportions of roles in learning disability and autism and in mental health care are in domiciliary care, there are far fewer residential care roles supporting these needs compared to dementia. Different care needs mean that older people are more likely to be cared for in residential and nursing homes (see Table 3).
Table 7: Estimated adult social care workforce in England, by care and support need, sector and service group, 2018/19
|
Learning disability and/or autism |
Mental health needs |
Dementia |
||||
|
All jobs |
% specialist services |
All jobs |
% specialist services |
All jobs |
% specialist services |
|
|
Total jobs |
685,000 |
21% |
555,000 |
5% |
835,000 |
2% |
|
Breakdown of total by sector |
||||||
|
Local authority |
59,500 |
11% |
53,700 |
3% |
64,600 |
7% |
|
Independent |
585,000 |
17% |
485,000 |
3% |
765,000 |
1% |
|
For direct payment recipients |
40,000 |
100% |
12,000 |
100% |
5,200 |
100% |
|
Breakdown of total by service group |
||||||
|
Residential |
176,000 |
32% |
158,000 |
7% |
400,000 |
2% |
|
Day care |
30,000 |
32% |
12,500 |
4% |
13,000 |
4% |
|
Domiciliary |
420,000 |
16% |
330,000 |
4% |
375,000 |
2% |
|
Community |
59,000 |
19% |
49,000 |
5% |
49,000 |
1% |
Source: The state of the adult social care sector and workforce in England: September 2019, Skills for Care, 2018/19.
Note: Adult residential includes care homes with and without nursing, adult domiciliary care includes supported living and extra care housing, and adult community care includes community support and outreach, social work and care management, carers support, occupational or employment-related services and other adult community care services.
Workforce challenges are widespread across the social care sector. Staffing gaps are currently estimated to be around 122,000, with a vacancy rate of almost 8% in 2018/19. Many staff are on low pay or zero hours contracts, and staff turnover is high and increasing.
Learning disability and mental health nursing face particular difficulties. Despite a trend of growing care needs (see chapter 2), numbers of learning disability and mental health nurses – who can work in both the NHS and social care – are falling. Between 2015 and 2019, the number of learning disabilities nurses and mental health nurses on the Nursing and Midwifery Council (NMC) register fell by 8% and 2% respectively. By contrast, overall adult nurse numbers remained stable and the number of children’s nurses increased by 7%.
NMC registration data do not tell us the roles or sectors in which registered nurses work – whether in social care, the NHS or elsewhere – but estimates suggest that approximately 41,000 work for local authority and independent adult social care providers in England.
Worryingly, these challenges look set to persist or worsen. Between 2014 and 2018, there was a 53% reduction in the number of applicants for learning disability nursing courses and a 32% reduction for mental health nursing courses. The number of acceptances onto learning disability nursing courses has fallen for 4 years in a row – the only specialism for which this is the case – and attrition rates during training are worse than for other courses. This creates a vicious circle, since difficulty recruiting and retaining students means that it becomes no longer financially viable for universities to offer courses in these areas.
* There were only around 5,000 episodes of short-term support for younger adults, so the focus here is long-term support see Adult Social Care Activity and Finance Report, England – 2018–19 (https://digital.nhs.uk/data-and-information/publications/statistical/adult-social-care-activity-and-finance-report/2018-19).
† Locations can report more than one type of service or service users for whom they provide services. These numbers are based on Health Foundation analysis of CQC data at December 2019 (see www.cqc.org.uk/about-us/transparency/using-cqc-data).
‡ This variation is based on the location of the local authorities funding an individual’s care, rather than the location of the nursing or residential home.
§ Upcoming Health Foundation report, Financial Flows.
¶ Individual jobs can involve support for more than one type of care need, so the groups identified here sum to more than the total number of jobs in the sector.
Care needs
Changes in the population’s care needs affect the amount and type of services needed to meet them. In this section, we look at levels and types of reported disability within the population and how they are changing. To do this, we use three main sources of data: self-reported data from the FRS, estimates from the Personal Social Services Research Unit (PSSRU) and prevalence of mental health and learning disabilities on GP registers. These measures, however, are imperfect – improved data are needed to estimate social care needs in the younger adult population (see Annex 1 for more detail).
Estimates of disability and prevalence of long-term conditions
There has been a steady growth in the proportion of younger adults reporting a disability, rising from 14% in 2007/08 to 18% in 2017/18. This compares to a slight reduction in older people reporting a disability – down from 46% in 2007/08 to 44% in 2017/18 (see Figure 2). When combined with population growth, the number of younger adults with a self-reported disability has risen by around 35%, compared with around 16% in the older age group (see Figure 3). For older people, the overall increase is driven by increasing numbers of people, as the self-reported prevalence rate has fallen.
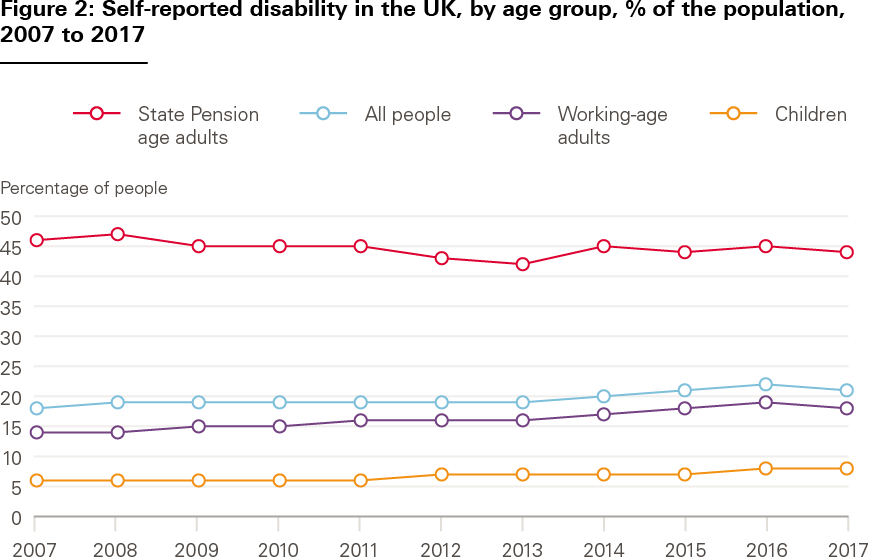
Source: Family Resources Survey, Department for Work and Pensions.
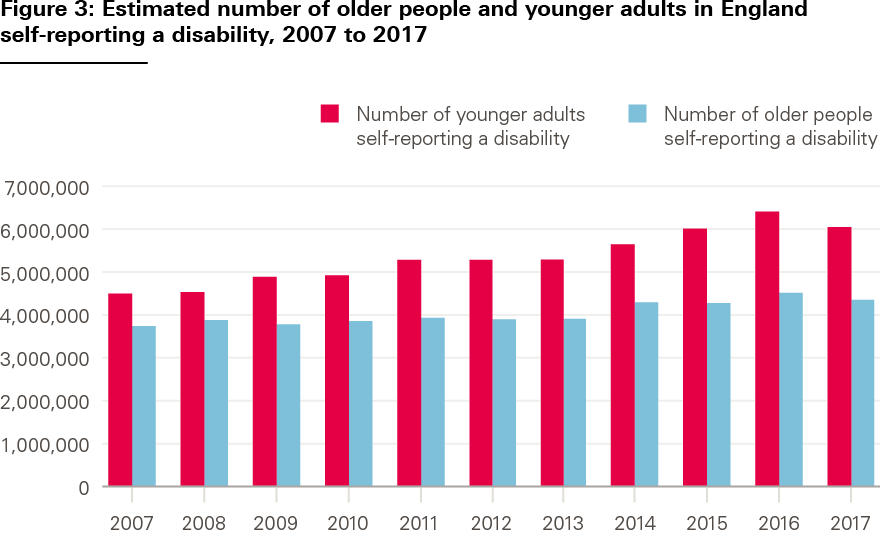
Source: Health Foundation analysis of ONS data and Family Resources Survey.
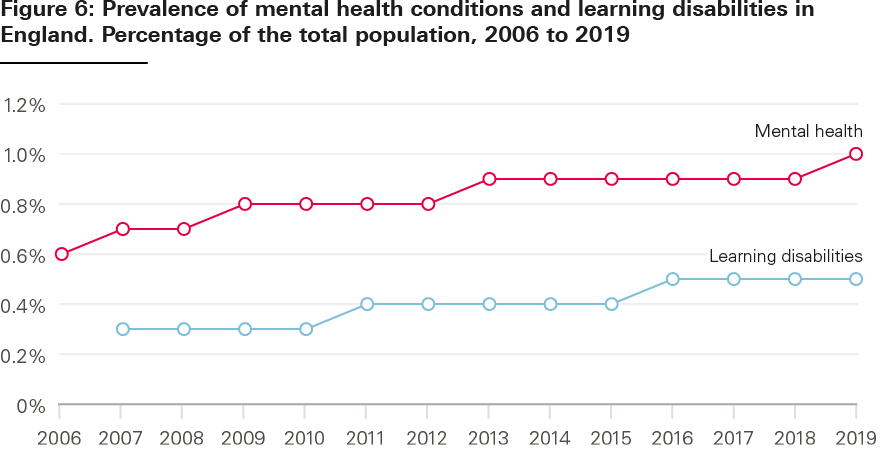
Types of disability differ between groups. Compared with older people, younger adults are much more likely to report mental health problems, and more likely to report social and behavioural issues, or learning disabilities (see Figure 4). In 2017/18, 48% of younger adults reporting a disability listed a mental health problem compared with 38% 5 years previously. Data from GP records indicates a rising prevalence of mental health and learning disabilities diagnoses across the whole population. In both cases, increased awareness may have led to increased reporting (see Figure 5). However, at least some of the change among younger people seems to be genuine, as an in-depth assessment of children’s mental health finds a slow but gradual increase over the last two decades in underlying mental health problems.
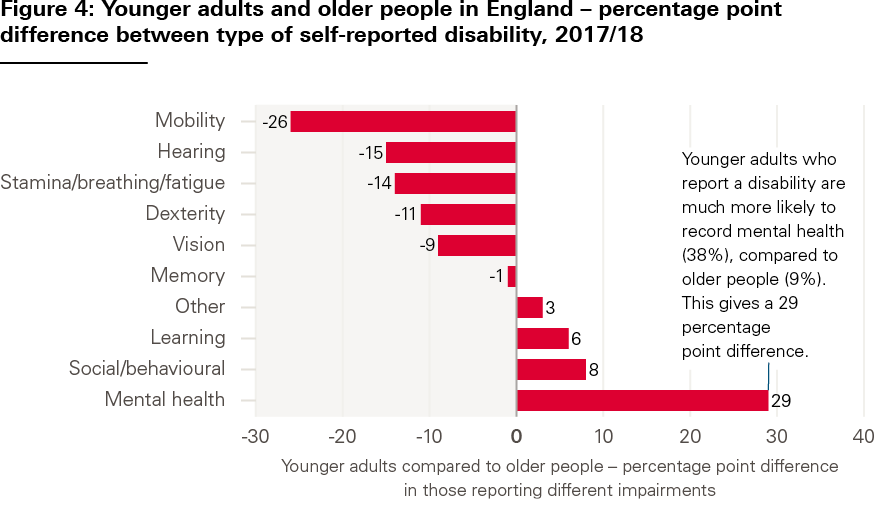
Source: Family Resources Survey, 2017/18.
Note: Individuals can report more than one type of impairment in their survey responses.
Source: Family Resources Survey, 2017/18.
These differences affect the type and level of support people need from social care services. Younger adults with care needs generally receive more intensive support; almost half of younger adults have continuous support, compared with a third of older people (see Figure 6).
Source: QOF database, NHS Digital.
Estimates of future care needs
Care needs look set to keep growing. PSSRU estimates that numbers of younger adults with learning disabilities, physical disabilities and mental health problems will increase over the next two decades. These projections are based on a range of factors, including prevalence rates within the population and trends in population size and age profile.
Social care needs can be estimated in various ways. For older people, the ability to perform activities of daily living (ADLs) – like washing and dressing – is often used to assess levels of need and how these might change over time. But ADLs are not considered to be as good an indicator of social care need for younger adults, because physical disabilities and frailty are less common. Daily activities are considered when assessing the needs of people with learning disabilities, but the assessment also considers whether individuals are able, for example, to engage in work or training, and develop and maintain personal relationships.
An alternative approach, used by PSSRU, is to estimate future needs by focusing on people with severe learning disabilities. Younger adults with learning disabilities are the largest group receiving local authority support. The number of younger adults with severe learning disabilities has risen by approximately 30% between 2007 and 2017, and is projected to rise by a further 34% between 2017 and 2027.
The number of people needing care is generally expected to continue to rise until 2040. PSSRU’s calculations include estimates of:
- a 70% increase in the number of people with learning disabilities using local authority home care services, and a 70% increase in users of residential care services
- a 30% increase in the number of people with physical disabilities using local authority home care services or direct payments, and a 25% increase in local authority funded residential care
- a 5% increase in home care services and direct payment for those with mental health problems, and a 7% increase in residential or nursing care.
These expected increases are in the number of people who may need social care – not the number of people who will receive it. Government decisions about future spending levels and eligibility for social care will determine how much of this need can be met by publicly funded services.
Trends in life expectancy will also affect future demand for care. People with learning disabilities have shorter life expectancy on average than the general population – a gap of 17 years for women and 14 years for men. Life expectancy is also shorter for people with autism spectrum disorder (ASD). In recent years, however, there is some evidence that the life expectancy gap with the general population has shrunk. This narrowing of the gap is a positive story, but brings several challenges for social care services – including increased demand as people live longer with care needs, and potentially greater complexity of care needs as people age and require additional services. There will also be implications for unpaid carers supporting younger adults as they age. These trends in life expectancy are generally not accounted for in the modelling of future adult social care demand described above.
More broadly, the number of people living with multiple health conditions that can require both health and social care support is growing. While having multiple conditions is often thought to relate to old age, around 30% of people with four or more conditions are younger than 65 – and people living in more deprived areas develop multiple conditions soonest.
** FRS data is based on financial years and ONS population data is based on calendar years. This analysis combines these two data sources and presents the results in calendar years. For example, 2007/08 FRS data is combined with 2007 population data to provide an estimate for the number of people reporting a disability in 2007.
†† Comparable FRS data on types of disability are only available back to 2012/13.
‡‡ In addition, ADL data is collected through survey data, and household surveys do not have big enough samples to collect robust, equivalent data for younger adults.
§§ It is not clear why the estimated increases for mental health services are so much lower than those for learning and physical disability.
System performance
Since younger and older adults have different care needs and access different services, the quality and costs of these services can differ. This section presents data on the performance of the social care system for younger adults. We describe trends in requests for social care support alongside the numbers of people with disabilities to understand more about access to care. We look at evidence on the quality of care, how much is spent and how much services cost.
Access to care
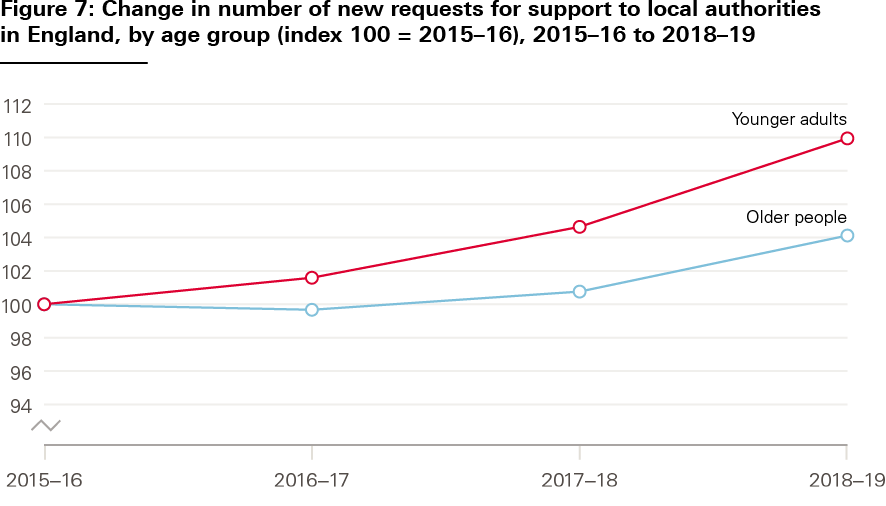
The available data suggest that unmet need is both high and growing. In the last 4 years, there has been a 10% increase in the number of younger adults making a request for social care support, compared with a 4% increase among older people (see Figure 7).
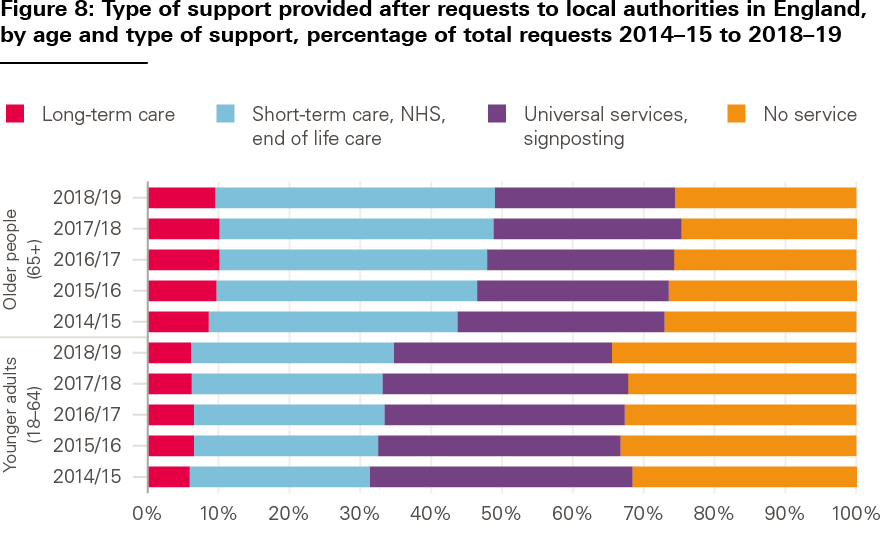
Data on the number of new requests for support from individuals to local authorities, and what happens when a request is made, are broken down by different types of service and age band (see Figure 8). For younger adults, most requests do not translate into access to local authority funded care. Around 35% of requests for support made by younger adults result in no service provided (compared with around 25% for older people). Around 30% of younger adults are directed to another local authority service, given information and advice, or signposted to non-local authority services.
Source: Adult Social Care Activity and Finance Report (2015/16 to 2018/19).
Source: Adult Social Care Activity and Finance Report (2015/16 to 2018/19).
Another way to understand whether people are accessing the care they need is to look at differences between estimated social care need and numbers of people accessing services. Figure 9 shows trends between 2007/08 and 2018/19 in the numbers of people with severe learning disabilities and the numbers of younger adults accessing social care services. Estimated need increased over the decade, while the number of younger adults receiving local authority funded care declined.
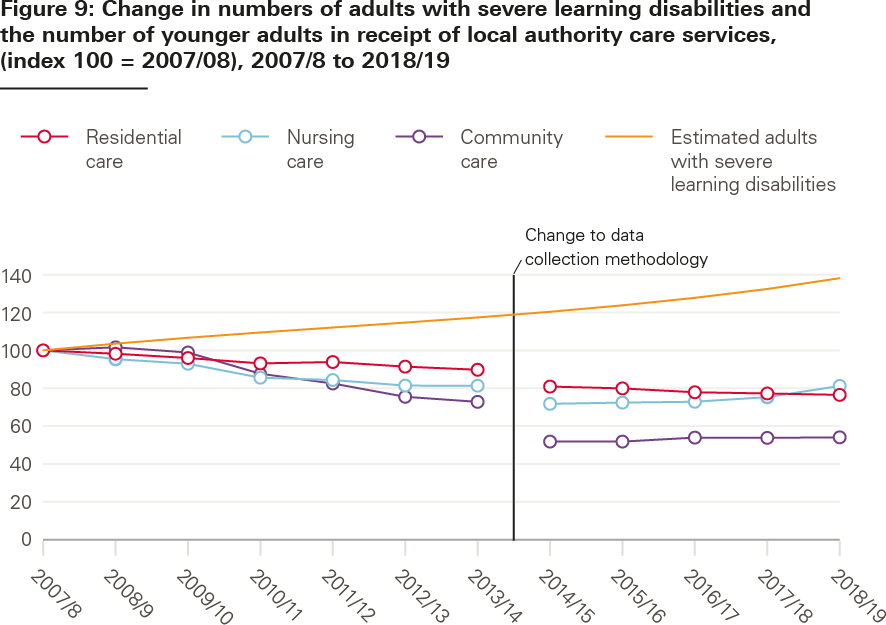
Sources: RAP, S1, SALT returns – see NHS Digital web page under section titled ‘Short and Long Term Support’ for data sources for each financial year. This chart is based on analysis by London School of Economics for the Health Foundation.
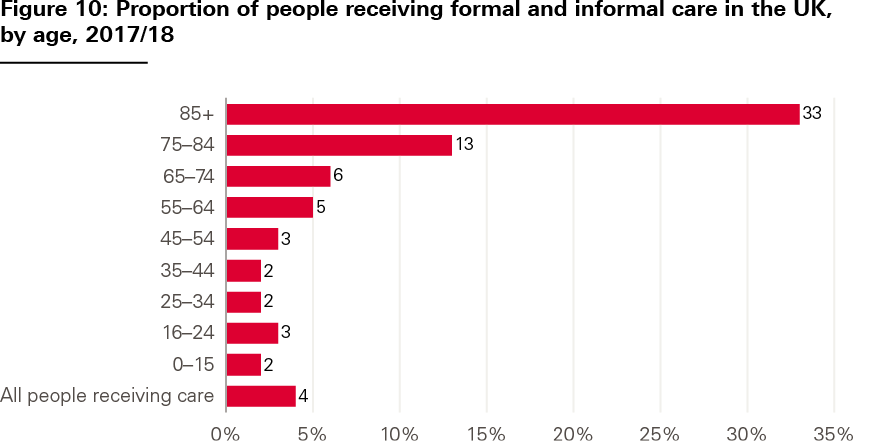
The FRS, which asks households about care and caring, also provides data about access to services. In 2017/18, approximately 3% of younger adults (16–64) responding to the survey reported receiving formal or informal care, compared with approximately 19% of people aged 65+ (and around a third in the 85+ subgroup) (see Figure 10). Compared with the 18% of younger adult respondents reporting a disability (see chapter 2 on care needs), this suggests either high levels of unmet need, significant numbers of people with low-level needs who do not require social care support, or some combination of the two.
Source: Family Resources Survey, Department for Work and Pensions, 2019.
Quality of care for service users
When younger adults do access services, quality of care varies. The CQC’s most recent State of care report highlighted the deterioration in the quality of health and social care services for people with mental health problems, learning disabilities and autism, describing how people receive care too late, in an unsuitable setting or from staff who lack appropriate training. The 2018 report of the Learning Disabilities Mortality Review Programme found that the poor quality of health and social care services had contributed to the cause of death – or significantly impacted wellbeing – in 8% of mortality reviews of adults with learning disabilities.
It is difficult to get an overview of care quality in the social care system from publicly available data. We looked at responses to the ASCS and Personal Social Services SACE to consider perspectives of adult social care users and their unpaid carers about services, particularly relating to aspects of quality prioritised by national policy.
The majority (89%) of younger adults using adult social care services report being satisfied with them (see Table 8). Younger adults have similar levels of satisfaction to older people using services, but are more likely to say that social care services help the way they spend their time and help them to have social contact. This may, in part, be down to the different kind of services that younger adults receive, including a larger proportion of people receiving services in community settings compared with older adults (see chapter 1 on system context).
However, the survey data highlight differences in the quality of care provided depending on the reasons people access services. People with a learning disability as the main reason for receiving support are most satisfied with their care. When this group is excluded, responses from younger adults about quality of care are more similar to those from older people.
Table 8: Perspectives of adult social care users on the quality of services in England, 2018–19
|
Users aged 18–64 |
Users aged 18–64, excluding learning disability support |
Users with learning disability support, all ages |
Users aged 65+ |
|
|
Satisfied with services |
89% |
85% |
93% |
90% |
|
Find it difficult to find information about services |
33% |
38% |
28% |
28% |
|
Services help the way they spend time |
75% |
61% |
89% |
58% |
|
Services help them have social contact |
71% |
62% |
80% |
61% |
|
Services help them feel safe |
88% |
80% |
96% |
86% |
Source: Personal Social Services Adult Social Care Survey, England – 2018–19, NHS Digital, 2019.
Quality for carers
Quality of services for unpaid carers also varies. Carers of younger adults are less likely to be satisfied with social care services, are more likely to find it difficult to find information about services, and are more likely to never feel involved in discussions about services than carers of older people (see Table 9). A total of 25% of carers of younger adults surveyed did not receive support or services from a local authority in the last 12 months (similar to carers of people 65+).
Table 9: Perspectives of unpaid carers of adult social care users on the quality of services in England, 2018–19
|
Carers of people aged 18–64 |
Carers of people of all ages whose primary support reason is learning disability support |
Carers of people aged 65+ |
|
|
Satisfied with services* |
64% |
66% |
73% |
|
Find it difficult to find information about services |
47% |
46% |
33% |
|
Never felt involved in discussions about services for cared-for person** |
10% |
7% |
6% |
* excluding those who have not received support or services in the last 12 months ** excluding those who answered, ‘There have been no discussions that I am aware of, in the last 12 months’
Source: Personal Social Services Survey of Adult Carers in England 2018–19, NHS Digital, 2019.
Spending and costs of care
Spending on services for younger adults is a significant part of local authority social care budgets. It currently represents over half of local authority spending that can be attributed to different age groups (around £6.8bn in 2018/19) (see Figure 11). Around 70% of that spending is on services for people with learning disabilities.
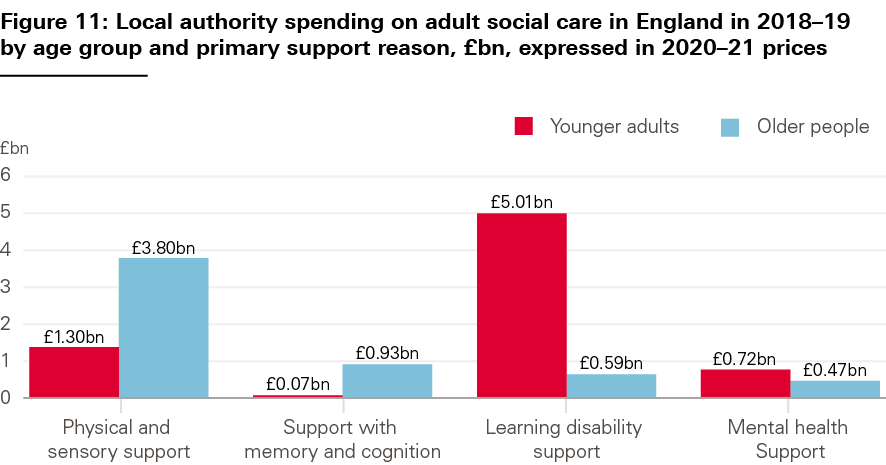
Source: Table 18, Adult Social Care Activity and Finance Report, England – 2018–19, NHS Digital, 2019.
After remaining flat between 2010/11 and 2014/15, local authority spending on younger adults’ care has been growing in recent years. Since 2014/15, there has been a 7% real terms increase (see Figure 12). This compares to a flat trend in spending on care for older people.
Despite this, the number of adults receiving care has not kept pace with growing care needs. Figure 12 compares trends in local authority spending on younger adults since 2014/15 with the estimated number of younger age adults with severe learning disabilities. Figure 9 compared the same measure of social care need with trends in numbers of younger adults receiving local authority funded social care. Taken together, these data point to a trend of growing unmet need as a result of spending by local authorities not rising quickly enough. It is likely that those with the highest needs are being prioritised, but there is limited systematic data available on trends in the needs of people receiving care packages.
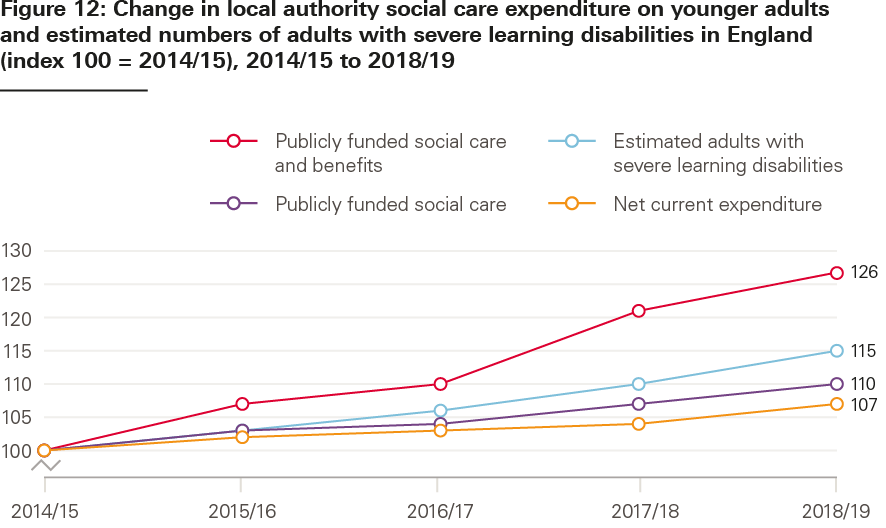
Source: Based on EX1, ASCFR reports (See under Short and Long Term Support, NHS Digital), DWP. This chart is based on analysis by the Personal Social Services Research Unit for the Health Foundation.
Social care spending is also under pressure from rising costs of care – not just growing care needs. Figure 13 shows trends in unit costs for different services by age group. A break in the time series means that comparing the data isn’t easy, but unit costs for most services (except nursing care for younger adults) appear to have risen faster than inflation. The average cost of a nursing care package is over 40% higher for younger adults, compared with a package for older people. The average cost of a residential care package is over double for younger adults. When considered alongside increases in spending and flat or reduced numbers of people receiving care, growing unit costs could show that people’s needs are becoming more complex to meet.
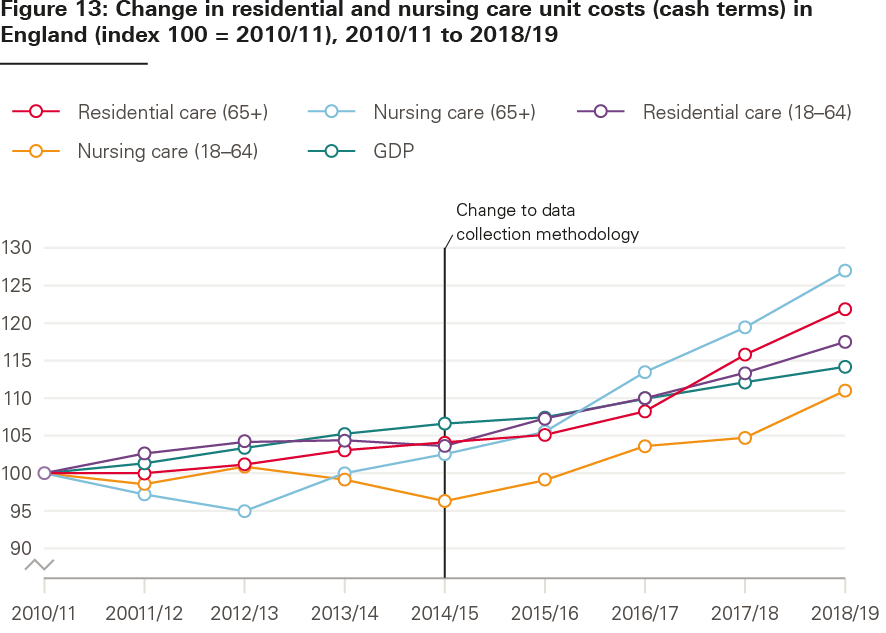
Source: EX1, ASCFR reports. This chart is based on analysis by London School of Economics for the Health Foundation.
¶¶ Throughout this analysis, we look at responses to the survey by age group [18–64; 65+] and by two strata identified in the survey [18–64, excluding learning disability support; Learning disability support (all ages)] – to consider differences by support reason. The percentage of respondents who filled in the survey themselves varies by support group and represents: 20% of all respondents aged 18–64; 22% of respondents aged 65+; 33% of respondents aged 18–64, excluding learning disability support, and 7% of respondents with learning disability support (all ages).
*** This excludes £2bn plus user charges where individuals are contributing to the cost of their care or over £2bn of spend transferred from the NHS. If unallocated funding is included (e.g. spending on commissioning activities and broader support services), funding for younger adults is just over 40% of the total.
††† For example, Tables 49 to 53 in the Adult Social Care Activity and Finance Report, England – 2018–19.
Outcomes
Since younger adults access social care for different reasons, their desired outcomes may vary significantly. The Care Act 2014 defines the purpose of adult social care services as promoting wellbeing, including by improving people’s physical and emotional health, relationships with others, control over their life, participation in work and suitability of accommodation. In this chapter, we describe data used in the Adult Social Care Outcomes Framework (ASCOF) on these different aspects of wellbeing, considering outcomes for people using social care and their unpaid carers, and employment and independent living rates. We also look at numbers of people with learning disabilities and autism in inpatient care.
Health and quality of life
Overall, a majority (67%) of younger adults using social care services describe their lives as good or better than good – a higher proportion than among people aged 65+ (59%) (see Table 10). However, there are differences in reported outcomes depending on why people access support. Excluding people accessing support primarily because of a learning disability, just over half of younger adults report good quality of life – lower than the proportion of older people. Eight in ten people accessing learning disability support report good quality of life.
These trends are similar for reported health and for the proportions of people reporting that they feel safe and that they have as much social contact as they want. Service users of all ages and support reasons report similar, high levels of control over their daily lives. Despite age being a major determinant of health, similar proportions of older and younger adults rate their general health as good or very good, when those accessing learning disability support are excluded.
Table 10: Outcomes for adult social care users in England, 2018–19
|
Users aged 18–64 |
Users aged 18–64, excluding learning disability support |
Users with learning disability support, all ages |
Users aged 65+ |
|
|
Good quality of life |
67% |
54% |
81% |
59% |
|
Good general health |
54% |
36% |
71% |
35% |
|
Feel as safe as wanted |
68% |
56% |
81% |
71% |
|
Have as much social contact as wanted |
50% |
37% |
61% |
44% |
|
Have as much control over daily life as wanted |
89% |
86% |
92% |
89% |
Source: Personal Social Services Adult Social Care Survey, England – 2018–19, NHS Digital, 2019.
Outcomes for carers
Reported outcomes for carers of younger adults are worse than those for carers of older people. Overall, just under half (47%) of carers of younger adults report that they have time to look after themselves, compared with over half (54%) of carers of older people (see Table 11). A higher proportion of carers of younger adults also report that their caring role has resulted in financial difficulties and health conditions. But carers’ outcomes also differ depending on the cared-for person’s social care needs – not just age. Carers of people of all ages with a learning disability have better reported outcomes than carers of younger adults.
Table 11: Outcomes for unpaid carers of adult social care users in England, 2018–19
|
Carers of people aged 18–64 |
Carers of people of all ages whose primary support reason is learning disability support |
Carers of people aged 65+ |
|
|
Caring has caused financial difficulties |
57% |
46% |
41% |
|
Developed health conditions because of their caring role |
26% |
24% |
22% |
|
Have time to look after themselves |
47% |
52% |
54% |
|
Have as much social contact as wanted |
32% |
35% |
33% |
Source: Personal Social Services Survey of Adult Carers in England 2018–19, NHS Digital, 2019.
In part, differences in outcomes for carers of younger and older adults may be explained by demographic differences between these two groups. As described in Chapter 1 in the section on who provides care, more carers of younger adults are female, younger, not in paid employment because of their caring role, and have other caring responsibilities.
Employment
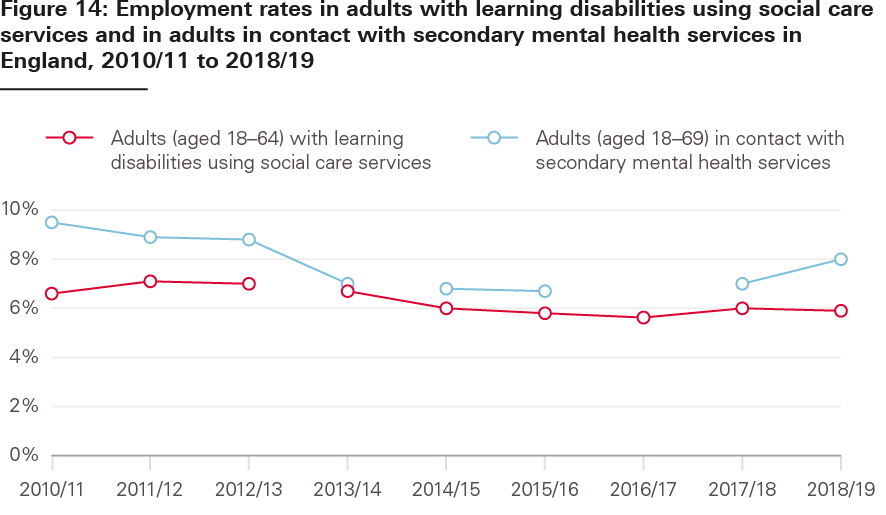
To help people live a fulfilling life, a core objective of national policy is to enable younger adults with care needs to enter the workforce where possible. Employment rates depend on many factors – such as the local economy, education, and training opportunities – but there are two indicators in ASCOF used to measure employment outcomes for people receiving care. These measures look at employment rates among younger adults (aged 18–64) with a learning disability as the primary reason for accessing social care, and among adults aged 18–69 in contact with secondary mental health services (for example, those provided in hospitals or by community mental health teams) and on the Care Programme Approach (CPA).
In the UK population aged 16–64, employment has risen from 70.5% in 2010/11 to 76.1% in 2018/19. Similar increases in employment have not been seen among adults receiving care in England (see Figure 14). Changes in the population measured and data collection methods limit comparability over this period, but the employment rate for younger adults with learning disabilities remained broadly constant between 2014/15 (6.0%) and 2018/19 (5.9%). The employment rate in adults (aged 18–69) in contact with secondary mental health services decreased from 9.5% in 2010/11 to 8.8% in 2012/13, decreased from 7.0% to 6.7% between 2013/14 and 2015/16, then increased from 7.0% to 8.0% between 2017/18 and 2018/19.
Source: Adult Social Care Outcomes Framework, NHS Digital.
Note: Data breaks indicate that data is not comparable.
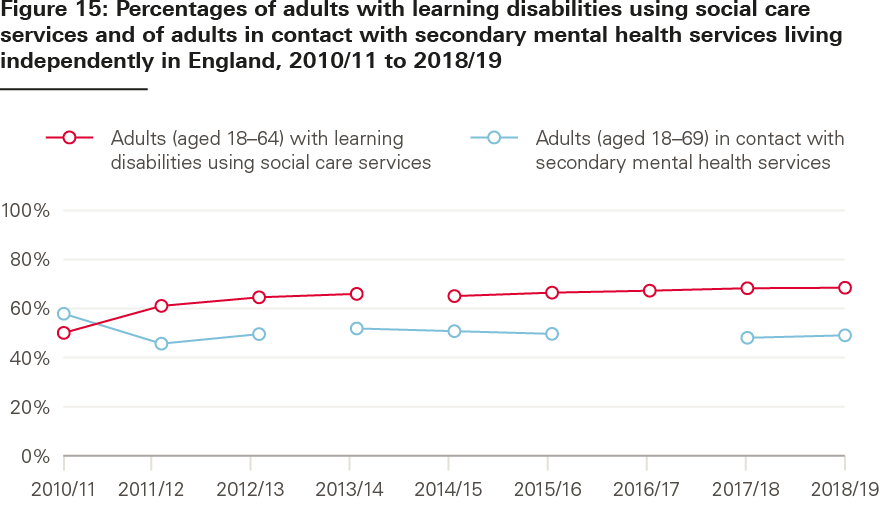
Living independently
National policy also aims to support people with care needs to live independently. ASCOF includes indicators measuring the proportion of people (aged 18–64) receiving support for a learning disability who live in their own home or with family, and the proportion of people (aged 18–69) in contact with hospital mental health services on the CPA who live independently, with or without support.
Data issues limit how far back comparisons can be made, but the proportion of younger adults with learning disabilities living independently has increased in recent years – from 74% in 2014/15 to 77% in 2018/19 (see Figure 15). The picture is less positive for younger adults with mental health problems (where there are also more breaks in the data). The proportion of adults in contact with mental health services living independently decreased from 67% to 59% between 2010/11 and 2012/13, decreased from 61% to 59% between 2013/14 and 2015/16, and increased slightly from 57% to 58% between 2017/18 and 2018/19.
Source: Adult Social Care Outcomes Framework, NHS Digital.
Note: Data breaks indicate that data is not comparable.
The Transforming Care programme – developed following a review of abuse and neglect of people with learning disabilities at Winterbourne View Hospital near Bristol – aims to support services to provide care for more people with learning disabilities and autism in the community. To help achieve this ambition, the Local Government Association (LGA), Association of Directors of Adult Social Services (ADASS) and NHS England set a target in the Building the Right Support national strategy in October 2015 to reduce inpatient provision of care by 35–50% by March 2019. This target (and an earlier target set in 2012) was missed. It was then reset again in the NHS Long term plan in January 2019, with an ambition to cut inpatient provision for learning disabilities and autism to 50% of 2015 levels by 2023/24.
NHS commissioners reported commissioning inpatient care for 2,220 adults and children with learning disabilities and autism in England in October 2019 (see Figure 16) – an 18% decrease over the 4 years since the target was set. Many people who could be supported at home remain in hospital.
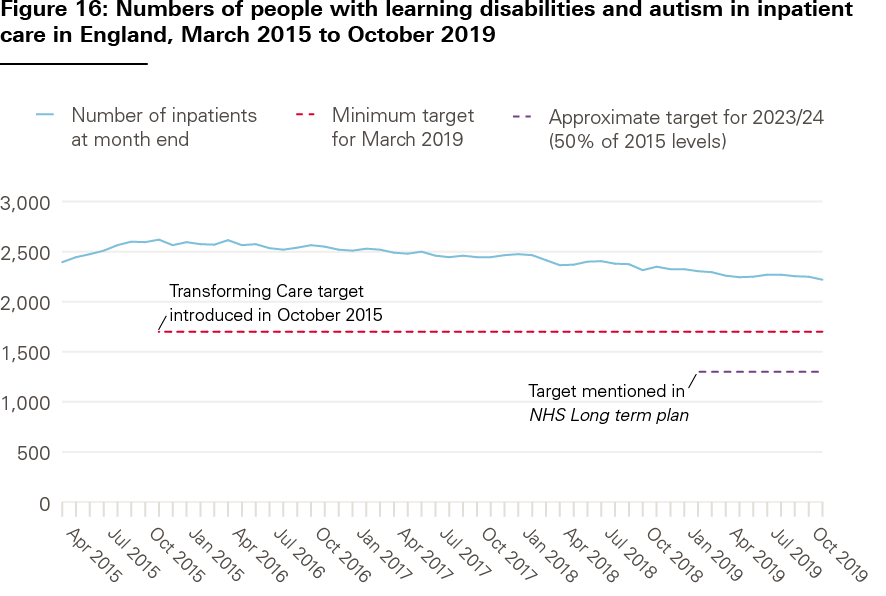
Source: Learning Disability Services Monthly Statistics: Assuring Transformation collection, NHS Digital. Provisional data as reported at month end.
Guidance on the target focuses on the need to improve and invest in learning disability and autism care in the community before closing inpatient beds. In October 2019, a higher proportion of people with a planned transfer were set to move into the community for care than when the target was set (see Table 12). However, the proportion of inpatients being transferred to an unknown ‘other setting’ has risen to nearly a quarter, representing potential issues with reporting and transparency.
Table 12: Percentage of inpatients with learning disabilities and autism in England, by planned transfer setting, October 2015 and October 2019
|
Setting the patient will transfer to |
October 2015 |
October 2019 |
|
Community |
22% |
30% |
|
Residential care |
15% |
11% |
|
‘Other setting’* |
6% |
22% |
|
No transfer planned |
37% |
22% |
|
Other categories** |
20% |
15% |
* It is unclear what this means, NHS Digital defines this as ‘sum of responses “transfer other” and “transfer other neuropsychiatric”’.** Aggregate of: Residential school; Secure forensic; Acute beds; Forensic rehabilitation; Complex care/rehabilitation; Patient died.
Source: NHS Digital, Learning Disability Services Monthly Statistics: Assuring Transformation collection. Provisional data as reported at month end.
‡‡‡ CPA is a framework providing people with mental health needs with a care coordinator and a regularly reviewed care plan.
§§§ Prior to 2014/15, this measure covered not just the subset of clients with a learning disability support primary support reason, but all clients aged 18–64 receiving a long-term learning disability support in the reporting year.
¶¶¶ Measuring progress against this target is complicated by a lag in commissioners reporting into the Assuring Transformation dataset: for consistency we have used figures as first published. There is a disparity between figures on the numbers of people in hospital in Assuring Transformation data and the Mental Health Services Data Set (MHSDS), which is currently undergoing evaluation.
Discussion
Policies to improve and reform adult social care should be based on an understanding of the needs of people using these services. The data in this analysis show that a considerable and growing number of younger adults use the adult social care system in England – often with very different needs and experiences to older people receiving care. Younger adults are also a heterogeneous group, using a range of services that are organised and delivered in a mix of different ways.
These differences have implications for the government’s approach to reforming social care. The headline pledge of ensuring that nobody will need to sell their home to pay for care will do little to improve the lives of many younger people with care needs. Policy action is also needed to boost access to publicly funded care and improve quality of services. Doing both of these will require additional government investment in social care. Any new proposals on social care reform will be partial unless they include a focus on younger adults.
With this in mind, we identify five implications for policy based on the data in our analysis.
- Growing gap between care needs and support available
Our analysis illustrates a growing gap between younger adults’ care needs and the number of people accessing publicly funded care. Unmet need for social care among younger adults is difficult to measure, but – like has been estimated for older adults – could be significant. The proportion of younger adults reporting a disability grew by 4 percentage points between 2007/08 and 2017/18. Yet, despite recent increases in spending, the number of adults receiving publicly funded care fell over the same period. This may help explain the large increase in requests from younger adults to local authorities for support – most of which end up with no services received or people being signposted elsewhere. Costs of providing care have also grown faster than inflation, putting greater pressure on social care budgets.
These pressures look set to increase, with growing numbers of people living with learning disabilities and other care needs, and living longer with them. These positive trends in life expectancy are not generally accounted for in projections of future demand for adult social care – meaning that funding pressures may be underestimated. In either case, additional funding will be needed if policymakers want to improve access for younger adults to publicly funded services. If this doesn’t happen, more people are likely to go without the care they need, additional pressure will be placed on unpaid carers or some combination of the two.
- Variation in quality and outcomes for service users and unpaid carers
Quality and outcomes for younger adults are variable. A high proportion of younger adults are happy with the social care they receive but, in some cases, quality of care is unacceptably poor. Independent reports have highlighted tragic failures of care for people with learning disabilities, including evidence that poor quality health and social care services contribute to their premature deaths. The CQC has called attention to the declining quality of care for people who need support from mental health, learning disability or autism services. The data analysed in this report also suggest that information about services is not always easy to find, and there are variations in satisfaction with services and reported outcomes between younger adults with different needs that require further exploration. While reform of adult social care funding is badly needed, equally important is a focus on how policy can safeguard people receiving social care and improve quality of services.
Unpaid carers of younger adults also experience worse outcomes in some areas than carers of older people. The latest survey data suggest that one in three carers of younger adults do not engage in paid employment because of their caring responsibilities – twice the rate reported among carers of older adults – and a majority say they experience financial difficulties as a result of caring. This may, in part, be down to the different characteristics of these carers, who – compared with carers of older people – are more likely to be younger themselves (most are aged 18–64) and have additional caring responsibilities. Carers of younger adults therefore have specific support needs, including help to enter and remain in education, training or paid work, and help to navigate their way through the benefits system.
These issues are recognised in the Department of Health and Social Care’s Carers Action Plan, published in 2018. But spending on support for carers has fallen over recent years (by around 30% in real terms between 2014/15 and 2018/19), as has the number of carers supported. To help address this, the government’s 2018 action plan promised that ‘carers would be at the heart of the social care green paper’, but – after more than 1,000 days since it was announced – the green paper has still not materialised. The new government has an opportunity to deliver on its commitment to carers when it finally publishes its plans for social care reform.
- Progress on shifting care into the community falls short
Progress on moving care out of residential or nursing homes is slow. While most younger adults receive long-term support in the community, the data show significant variation across the country. And progress on supporting people with a learning disability or autism to live in the community has fallen short of national targets, despite renewed policy focus since the Winterbourne View scandal in 2012. The Building the Right Support strategy, published in 2015, set out a national plan to provide better care and support for people with learning disabilities and autism, including increasing community support and reducing reliance on inpatient services. Despite some progress and examples of new care models being developed, evidence suggests that much more still needs to be done to make the plan’s aims a reality. In February 2020, the Equality and Human Rights Commission initiated legal action against the Secretary of State for Health and Social Care over this failure.
Successfully moving more care into the community depends on a range of factors, including investing in preventive services to try to avoid admission to institutional settings, coordination between the organisations involved in commissioning and delivering services, and developing community-based alternatives to institutional care. Changing professional roles and cultures, new funding and payment models, and innovations in care delivery have also been important factors behind the longer-run deinstitutionalisation of mental health care. After successive targets on caring for people with learning disabilities and autism in appropriate settings were missed in 2014 and in 2019, the NHS Long term plan reset the national target again. But without adequate investment in additional community support, vulnerable people will continue to be cared for in inappropriate settings.
- Workforce issues are widespread
Providing high quality care relies on having enough staff with the right skills. Difficulty recruiting and retaining sufficient numbers of people to work in adult social care is causing pressure across the sector. Social care is heavily reliant on international workers – 17% of people working in social care in England are non-British nationals – and the government’s proposals for a points-based immigration system risk compounding staff shortages. To help address these issues, investment will be needed to boost staff pay – £1.7bn would be needed by 2023/04, for example, to match pay increases in the NHS – along with regulation to ensure that extra spending is translated into increases for care staff. The UK’s immigration system should not only allow for but encourage international recruitment for social care.
Looking to the future, more nurses will be needed to care for the growing number of younger adults with learning disabilities. Yet the data show that learning disability nursing courses are struggling to attract students, have particularly high drop-out rates and are becoming financially unsustainable. The government has committed to introducing a grant for nursing students, including an additional £1,000 for students training in learning disability and mental health nursing. This is welcome, but the shortfall in nursing needs to be addressed on multiple fronts – including increases in the number of nurses in training, funding available for training new nurses and the number of nurses ethically recruited from overseas. While a national workforce strategy has been promised for the NHS, there is no equivalent strategy for the social care workforce and the policies that impact on them.
- A lack of data limits our understanding
Finally, a lack of high quality data limits our understanding of how the social care system works for younger adults and their carers. This includes data on quality and outcomes of care, pathways between services, unmet need, informal care, and more. We have outlined major issues with the data in Annex 1. Improving data quality is not a niche interest for researchers; better data is essential to help inform the direction of social care reform and assess its impact.
The Health Foundation’s new REAL (Research and Economic Analysis for the Long term) Centre will be carrying out a programme of research and analysis to improve understanding in areas of social care where evidence or data are limited – including on social care need, demand for services, the social care workforce, and the transition from children’s services to younger adults services.
Conclusion
Policy debates about adult social care in England often focus on the issues facing older people. But younger adults form a major part of the social care system. The data in this analysis illustrate some of the differences in care needs, services and outcomes between younger and older adults and the people caring for them. Policies to improve and reform adult social care will not be successful unless they understand and address the needs of younger adults. This population group must not be forgotten or neglected by policymakers.
References
- Alderwick H, Tallack C, Watt T. What should be done to fix the crisis in social care? Five priorities for government. The Health Foundation; 2019 (www.health.org.uk/news-and-comment/blogs/what-should-be-done-to-fix-the-crisis-in-social-care).
- Nuffield Trust, The Health Foundation, The King’s Fund. The autumn statement: joint statement on health and social care. Nuffield Trust, The Health Foundation, The King’s Fund; 2016 (www.kingsfund.org.uk/sites/default/files/field/field_publication_file/Autumn_Statement_Kings_Fund_Nov_2016_3.pdf).
- Age UK. New analysis shows number of older people with unmet care needs soars to record high. Age UK; 2018 (www.ageuk.org.uk/latest-press/articles/2018/july-2018/new-analysis-shows-number-of-older-people-with-unmet-care-needs-soars-to-record-high).
- Care Quality Commission. The state of health care and adult social care in England: 2018/19. State of Care report. CQC; 2019 (www.cqc.org.uk/sites/default/files/20191015b_stateofcare1819_fullreport.pdf).
- Competition and Markets Authority. Care homes market study. CMA; 2018 (www.gov.uk/cma-cases/care-homes-market-study).
- Skills for Care. The state of the adult social care sector and workforce in England: September 2019. Skills for Care; 2019 (www.skillsforcare.org.uk/adult-social-care-workforce-data/Workforce-intelligence/documents/State-of-the-adult-social-care-sector/State-of-Report-2019.pdf).
- Carers UK. Juggling work and unpaid care: a growing issue. Carers UK; 2019 (www.carersuk.org/images/News_and_campaigns/Juggling_work_and_unpaid_care_report_final_0119_WEB.pdf).
- The Conservative and Unionist Party. Get Brexit done: unleash Britain’s potential. The Conservative and Unionist Party Manifesto 2019. The Conservative and Unionist Party; 2019 (https://assets-global.website-files.com/5da42e2cae7ebd3f8bde353c/5dda924905da587992a064ba_Conservative%202019%20Manifesto.pdf).
- Johnson B. Boris Johnson's first speech as Prime Minister. 24 July 2019 (www.gov.uk/government/speeches/boris-johnsons-first-speech-as-prime-minister-24-july-2019).
- Labour Party. It‘s time for real change. The Labour Party manifesto 2019. Labour Party; 2019 (https://labour.org.uk/wp-content/uploads/2019/11/Real-Change-Labour-Manifesto-2019.pdf).
- Association of Directors of Adult Social Services. ADASS budget survey 2019. ADASS; 2019 (www.adass.org.uk/media/7295/adass-budget-survey-report-2019_final.pdf).
- Corlett A. The living standards outlook 2019. Resolution Foundation; 2019 (www.resolutionfoundation.org/app/uploads/2019/02/Living-Standards-Outlook-2019.pdf).
- Wickham S, Bentley L, Rose T, Whitehead M, Taylor-Robinson D, Barr B. Effects on mental health of a UK welfare reform, Universal Credit: a longitudinal controlled study. Lancet Public Health. 2020;5(3):e157-e164.
- Office for National Statistics. Total Wealth: Wealth in Great Britain (www.ons.gov.uk/peoplepopulationandcommunity/personalandhouseholdfinances/incomeandwealth/datasets/totalwealthwealthingreatbritain).
- Ministry of Housing, Communities and Local Government. English Housing Survey 2017 to 2018: home ownership. Table 1.4. Ministry of Housing, Communities and Local Government; 2019 (www.gov.uk/government/statistics/english-housing-survey-2017-to-2018-home-ownership).
- Kelley E, Hurst J. Health care quality indicators project conceptual framework paper. OECD; 2006 (www.oecd.org/els/health-systems/36262363.pdf).
- Papanicolas I, Smith PC. EuroREACH framework for health system performance assessment. 2010 (www.euroreach.net/sites/default/files/EuroREACHframeworkv4.pdf).
- Office for Statistical Regulation. Adult Social Care Statistics in England. Office for Statistical Regulation; 2020 (www.statisticsauthority.gov.uk/wp-content/uploads/2020/01/19_11_15_SocialCare_SRv3.pdf).
- Moriarty et al. Literature review of roles and issues within the social work profession in England. Social Care Workforce Research Unit – King’s College London. 2015. (www.professionalstandards.org.uk/docs/default-source/publications/research-paper/literature-review-roles-and-issues-within-the-social-work-profession-in-england-2015.pdf)
- Mind. Health and social care rights (www.mind.org.uk/information-support/legal-rights/health-and-social-care-rights/about-social-care/#.XhxeTUeeQ2w); Mencap. Assessments and eligibility (www.mencap.org.uk/advice-and-support/social-care/assessments-and-eligibility) and the Personal Social Services SACE
- Ministry of Housing, Communities and Local Government. Local authority revenue expenditure and financing England: 2018 to 2019 individual local authority data – outturn. Ministry of Housing, Communities and Local Government; 2019 (www.gov.uk/government/statistics/local-authority-revenue-expenditure-and-financing-england-2018-to-2019-individual-local-authority-data-outturn).
- The Comptroller and Auditor General. Personalised commissioning in adult social care. National Audit Office; 2016 (www.nao.org.uk/wp-content/uploads/2016/03/Personalised-commissioning-in-adult-social-care-update.pdf).
- Department for Work and Pensions. Benefit Expenditure and Caseload tables 2019. (www.gov.uk/government/publications/benefit-expenditure-and-caseload-tables-2019)
- University of Nottingham. New research suggests more than one in five children in England carry out some care for sick and disabled family members. University of Nottingham; 2018 (www.nottingham.ac.uk/news/pressreleases/2018/september/children-england-care-sick-family.aspx).
- Skills for Care. Workforce Estimates. March 2019 (www.skillsforcare.org.uk/adult-social-care-workforce-data/Workforce-intelligence/publications/Workforce-estimates.aspx).
- National Midwifery Council. The NMC Register: 31 March 2019. NMC; 2019 (www.nmc.org.uk/globalassets/sitedocuments/other-publications/nmc-register-data-march-19.pdf).
- Buchan J, Gershlick B, Charlesworth A, Seccombe I. Falling short: the NHS workforce challenge. The Health Foundation; 2019 (www.health.org.uk/sites/default/files/upload/publications/2019/S05_Falling%20short_The%20NHS%20workforce%20challenge.pdf).
- House of Commons Health Committee. The nursing workforce: second report of session 2017–19. House of Commons; 2018 (https://publications.parliament.uk/pa/cm201719/cmselect/cmhealth/353/353.pdf).
- NHS Digital. Mental Health of Children and Young People in England. 2017 https://digital.nhs.uk/data-and-information/publications/statistical/mental-health-of-children-and-young-people-in-england/2017/2017
- Wittenberg R, Hu B, Hancock R. Projections of Demand and Expenditure on Adult Social Care 2015 to 2040. PSSRU; 2018 (www.pssru.ac.uk/publications/pub-5421).
- Mencap ’Assessments and Eligibility – How to get an assessment and what to expect’ www.mencap.org.uk/advice-and-support/social-care/assessments-and-eligibility
- NHS Digital. Adult Social Care Activity and Finance Report, England 2018–19. Reference data tables: ‘Net Current Expenditure’ (Table 18) and ‘Reference Tables’ (Table 37). NHS Digital; 2019 (https://digital.nhs.uk/data-and-information/publications/statistical/adult-social-care-activity-and-finance-report/2018-19#resources).
- Primary Care Domain, NHS Digital. Health and Care of People with Learning Disabilities: 2017–18. NHS Digital; 2019 (https://files.digital.nhs.uk/BA/4F4C1D/health-care-learning-disabilities-1718-sum.pdf).
- NHS. People with autism are ‘dying younger,’ warns study. NHS; 2016 (www.nhs.uk/news/neurology/people-with-autism-are-dying-younger-warns-study).
- Emerson E, Glover G, Hatton C, Wolstenholme J.. Trends in age-standardised mortality rates and life expectancy of people with learning disabilities in Sheffield over a 33-year period. Tizard Learning Disability Review. 2014; 19(2): 90–95 (https://doi.org/10.1108/TLDR-01-2014-0003).
- NICE. Care and Support of people growing older with learning disabilities. NICE Guideline N96. NICE; 2018. (www.nice.org.uk/guidance/ng96).
- Emerson EB, Robertson, JM, Coles B, Hatton CR. Estimating the Need for Social Care Services for Adults with Disabilities in England 2012–2030. Lancaster University; 2012 (https://eprints.lancs.ac.uk/id/eprint/129308).
- Stafford M, Steventon A, Thorlby R, Fisher R, Turton C, Deeny S. Understanding the health care needs of people with multiple health conditions. The Health Foundation; 2018 (www.health.org.uk/publications/understanding-the-health-care-needs-of-people-with-multiple-health-conditions).
- Barnett K, Mercer SW, Norbury M, Watt G, Wyke S, Guthrie B. Epidemiology of multimorbidity and implications for health care, research, and medical education: a cross-sectional study. Lancet. 2012; 380(9836): 37–43
- NHS Digital. Adult Social Care Activity and Finance Report, England 2018–19. NHS Digital; 2019 (https://digital.nhs.uk/data-and-information/publications/statistical/adult-social-care-activity-and-finance-report/2018-19).
- Department for Work and Pensions. Family Resources Survey: financial year 2017/18. DWP; 2019 (www.gov.uk/government/collections/family-resources-survey--2).
- Care Quality Commission. The state of health care and adult social care in England 2018/19. State of Care report. CQC; 2019 (www.cqc.org.uk/publications/major-report/state-care).
- University of Bristol. The Learning Disability Mortality Review (LeDeR) Programme Annual Report 2018. Healthcare Quality Improvement Partnership; 2019 (www.bristol.ac.uk/media-library/sites/sps/leder/LeDeR_Annual_Report_2018%20published%20May%202019.pdf).
- NHS Digital. Adult Social Care Activity and Finance Report, England 2018–19. NHS Digital; 2019 (https://digital.nhs.uk/data-and-information/publications/statistical/adult-social-care-activity-and-finance-report/2018-19).
- NHS Digital. Adult Social Care Activity and Finance Report, England 2018–19. Reference data tables: ‘Net current expenditure’ (Table 50). NHS Digital; 2019 (https://digital.nhs.uk/data-and-information/publications/statistical/adult-social-care-activity-and-finance-report/2018-19).
- Care Act 2014 (www.legislation.gov.uk/ukpga/2014/23/contents/enacted).
- ONS. Employment in the UK: March 2019; November 2010–January 2011; November 2018–January 2019 (www.ons.gov.uk/employmentandlabourmarket/peopleinwork/employmentandemployeetypes/bulletins/employmentintheuk/march2019).
- Department of Health. Transforming care: a national response to Winterbourne View Hospital. Department of Health Review: Final Report. DoH; 2012 (https://assets.publishing.service.gov.uk/government/uploads/system/uploads/attachment_data/file/213215/final-report.pdf).
- NHS England. Homes not hospitals. www.england.nhs.uk/learning-disabilities/care
- Local Government Association, Association of Directors of Adult Social Services, NHS England. Building the Right Support. LGA, ADASS, NHS England; 2015 (www.england.nhs.uk/wp-content/uploads/2015/10/ld-nat-imp-plan-oct15.pdf).
- NHS England. The NHS Long term plan. NHS England; 2019 (www.longtermplan.nhs.uk).
- Gershlick B, Kraindler J, Idriss O, Charlesworth A. Health and social care funding: priorities for the new government. The Health Foundation; 2019 (www.health.org.uk/publications/long-reads/health-and-social-care-funding).
- Age UK. New analysis shows number of older people with unmet care needs soars to record high. Age UK; 2018 (www.ageuk.org.uk/latest-press/articles/2018/july-2018/new-analysis-shows-number-of-older-people-with-unmet-care-needs-soars-to-record-high).
- Department of Health and Social Care. Carers action plan 2018–2020: supporting carers today. Department of Health and Social Care; 2018 (https://assets.publishing.service.gov.uk/government/uploads/system/uploads/attachment_data/file/713781/carers-action-plan-2018-2020.pdf).
- Health and Social Care Information Centre. Personal Social Services: Expenditure and unit costs England 2014–15, Final release. NHS Digital; 2015 (https://files.digital.nhs.uk/publicationimport/pub19xxx/pub19165/pss-exp-eng-14-15-fin-rep.pdf).
- ICF, The Strategy Unit, University of Birmingham, British Institute of Learning Disabilities. Evaluation of building the right support: Summary of findings to date and recommendations arising. ICF, The Strategy Unit, University of Birmingham, BILD; 2018 (www.strategyunitwm.nhs.uk/sites/default/files/2019-01/1%20Short%20Summary%20of%20Recommendations_0.pdf).
- Equality and Human Rights Commission. Health Secretary faces legal challenge for failing patients with learning disabilities and autism. Equality and Human Rights Commission; 2020 (www.equalityhumanrights.com/en/our-work/news/health-secretary-faces-legal-challenge-failing-patients-learning-disabilities-and).
- Gilburt H, Peck E, Ashton B, Edwards E, Naylor C. Service transformation: lessons from mental health. The King’s Fund; 2014 (www.kingsfund.org.uk/publications/service-transformation).
- The Comptroller and Auditor General. Local support for people with a learning disability. Department of Health; 2017 (www.nao.org.uk/wp-content/uploads/2017/03/Local-support-for-people-with-a-learning-disability-Summary.pdf).
- Gershlick B, Charlesworth A. Health and social care workforce: priorities for the new government. 2019 (www.health.org.uk/news-and-comment/blogs/health-and-social-care-workforce).
- Department of Health and Social Care. Paramedic students will get £5,000 support payment each year. Department of Health and Social Care; 2020 (www.gov.uk/government/news/paramedic-students-will-get-5000-support-payment-each-year). (www.statisticsauthority.gov.uk/wp-content/uploads/2020/01/19_11_15_SocialCare_SRv3.pdf
- The Health Foundation. REAL Centre (Research and Economic Analysis for the Long term): About our new health and social care research centre. The Health Foundation; 2020. www.health.org.uk/article/real-centre-research-and-economic-analysis-for-the-long-term
- A number of the limitations outlined here can be found in the Office for Statistics Regulation report summarising its review of adult social care statistics, Adult Social Care Statistics in England: January 2020 (www.statisticsauthority.gov.uk/wp-content/uploads/2020/01/19_11_15_SocialCare_SRv3.pdf
Annex 1: Data sources
A brief overview of the main data sources used in this report and their limitations are shown in the table below. In addition, various academic papers and organisational reports that have been used are listed in the References.
|
Data source |
Chapter used in |
|
|
NHS Digital: Adult Social Care Activity and Finance Return https://digital.nhs.uk/data-and-information/publications/statistical/adult-social-care-activity-and-finance-report NHS Digital: Personal Social Services: Expenditure and Unit Costs https://digital.nhs.uk/data-and-information/publications/statistical/personal-social-services-expenditure-and-unit-costs NHS Digital: Community Care Statistics (see links under ‘Short and long term support (SALT)’ from the page contents list) https://digital.nhs.uk/data-and-information/data-collections-and-data-sets/data-collections/social-care-collections |
1: System context |
The collection and publication of adult social care finances and activity have changed substantially over time. These are the three publications used in this report that are based on data submitted by local authorities and published by NHS Digital. Limitations
|
|
Ministry of Housing and Local Government: Local authority revenue expenditure and financing England www.gov.uk/government/collections/local-authority-revenue-expenditure-and-financing |
1: System context |
Annual publication on overall local government finances, including budgeting and expenditure data. Includes some social care data. Limitations
|
|
Care Quality Commission: Locations regulated by CQC (see subheading under ‘Data sheets’)www.cqc.org.uk/about-us/transparency/using-cqc-data |
1: System context |
Detail on the active locations that CQC regulates, including the different types of services provided and target services users. |
|
NHS Digital: Adult Social Care Outcomes Framework, England https://digital.nhs.uk/data-and-information/publications/statistical/adult-social-care-outcomes-framework-ascof |
1: System context, 4: Outcomes |
ASCOF is a collection of social care outcomes performance indicators that provide information on a range of social services by local authority and on people receiving funding from a local authority to use these services. The Department of Health and Social Care, the Association of Directors of Adult Social Services and the Local Government Association develop these measures, and agree them to be of value to indicate outcomes of the adult social care system, both at national and local levels. This report includes data from five measures. Measure 2A(1): Long-term support needs of younger adults (aged 18–64) met by admission to residential and nursing care homes, per 100,000 population. Measure 1E: Proportion of adults (aged 18–64) with a learning disability in paid employment. Measure 1F: Proportion of adults (aged 18–69) in contact with secondary mental health services in paid employment. Measure 1G: Proportion of adults (aged 18–64) with a learning disability who live in their own home or with their family. Measure IH: Proportion of adults (aged 18–69) in contact with secondary mental health services who live independently, with or without support. Limitations For measures 1E and 1G, changes to the eligible population affect comparison over time:
For measures 1F and 1H, several changes to the collection methodology affect comparison over time:
|
|
NHS Digital: Personal Social Services Survey of Adult Carers in England 2018-19 https://digital.nhs.uk/data-and-information/publications/statistical/personal-social-services-survey-of-adult-carers/england-2018-19 |
1: System context, 3: System performance, 4: Outcomes |
Biennial survey of informal, unpaid adult carers caring for a person aged 18 or over, carried out by Councils with Adult Social Services Responsibilities in England (CASSRs) using random sampling. Carers in active dispute with a CASSR are not included. Limitations From 2016–17, the eligible population includes carers who have not had a formal review in the previous 12 months. Due to this change, there is a break in series between 2014–15 and 2016–17 affecting comparisons over time. |
|
1: System context |
Overview and detailed information on the adult social care workforce, including data back to 2012. Limitations
See page 16 and 17: www.skillsforcare.org.uk/adult-social-care-workforce-data/Workforce-intelligence/documents/State-of-the-adult-social-care-sector/State-of-Report-2019.pdf |
|
|
Department for Work and Pensions: Family Resources Survey www.gov.uk/government/collections/family-resources-survey--2 |
2: Care needs |
The FRS is a continuous household survey which collects information on a representative sample of private households in the United Kingdom. In the most recent year, it included a sample of around 24,000 younger adults, 10,000 pensioners and 10,000 children. Annual publications provide statistics and commentary on:
Limitations
|
|
NHS Digital: Quality and Outcomes Framework database www.gpcontract.co.uk/browse/UK/19 |
2: Care needs |
Data extracted from GP registers, including GP performance against QOF performance measures. Limitations
|
|
NHS Digital: Personal Social Services Adult Social Care Survey, England – 2018–19 https://digital.nhs.uk/data-and-information/publications/statistical/personal-social-services-adult-social-care-survey/england-2018-19 |
3: System performance, 4: Outcomes |
Provides information on social care user experiences, quality of life and impact of services on this. Annual survey carried out by CASSRs in England using stratified random sampling. Survey population covers adults (aged 18 and over) receiving long-term support services funded or managed by the council (provided or commissioned by the council or an NHS health partner). Limitations
|
|
NHS Digital: Learning Disability Services Statistics, Assuring Transformation data collection https://digital.nhs.uk/data-and-information/publications/statistical/learning-disability-services-statistics |
4: Outcomes |
Data relating to patients with learning disabilities and autism receiving inpatient care commissioned by the NHS in England, published on a monthly and quarterly basis. Used to measure progress against Transforming Care targets to reduce inpatient provision of care for people with learning disabilities and autism. Data covers inpatients of all ages in CQC-registered mental or behavioural health care facilities in England, operated by NHS or independent sector providers. Data provided by English commissioners, includes some data on care commissioned in England but provided elsewhere in the UK. Limitations
|