About the REAL Centre
The Health Foundation’s REAL Centre (research and economic analysis for the long term) provides independent analysis and research to support better long-term decision making in health and social care.
Its aim is to help health and social care leaders and policymakers look beyond the short term to understand the implications of funding and resourcing decisions over the next 10–15 years. The Centre works in partnership with leading experts and academics to research and model the future demand for care, and the funding, workforce and other resources needed to respond to this.
The Centre supports the Health Foundation’s strategic priority to provide evidence and analysis to improve health and care policy.
Foreword
To plan well, the NHS and public services more widely must have as clear a sight as possible of the pressures and opportunities ahead.
One obvious pressure is demographic change and the resulting demand on public services due to ill health. Between 2018 and 2028, the number of people aged 75–84 years in England is projected to increase by a third, and those aged 85 years and older by more than a fifth. The number of people aged 75 years and older living alone over this decade is projected to increase by 461,000 – around the size of the city of Bristol.
Given its importance, it is surprising there hasn’t been more analysis of future levels of illness in the population and their impact. This report by the Heath Foundation’s REAL Centre does just that. Now, for the first time, we have an idea of the scale of demand on health services.
The analysis uses novel data linkage and modelling, in partnership with the University of Liverpool, to show how levels and types of ill health in the population are expected to change between now and 2040 as well as the likely impact on the use of NHS services.
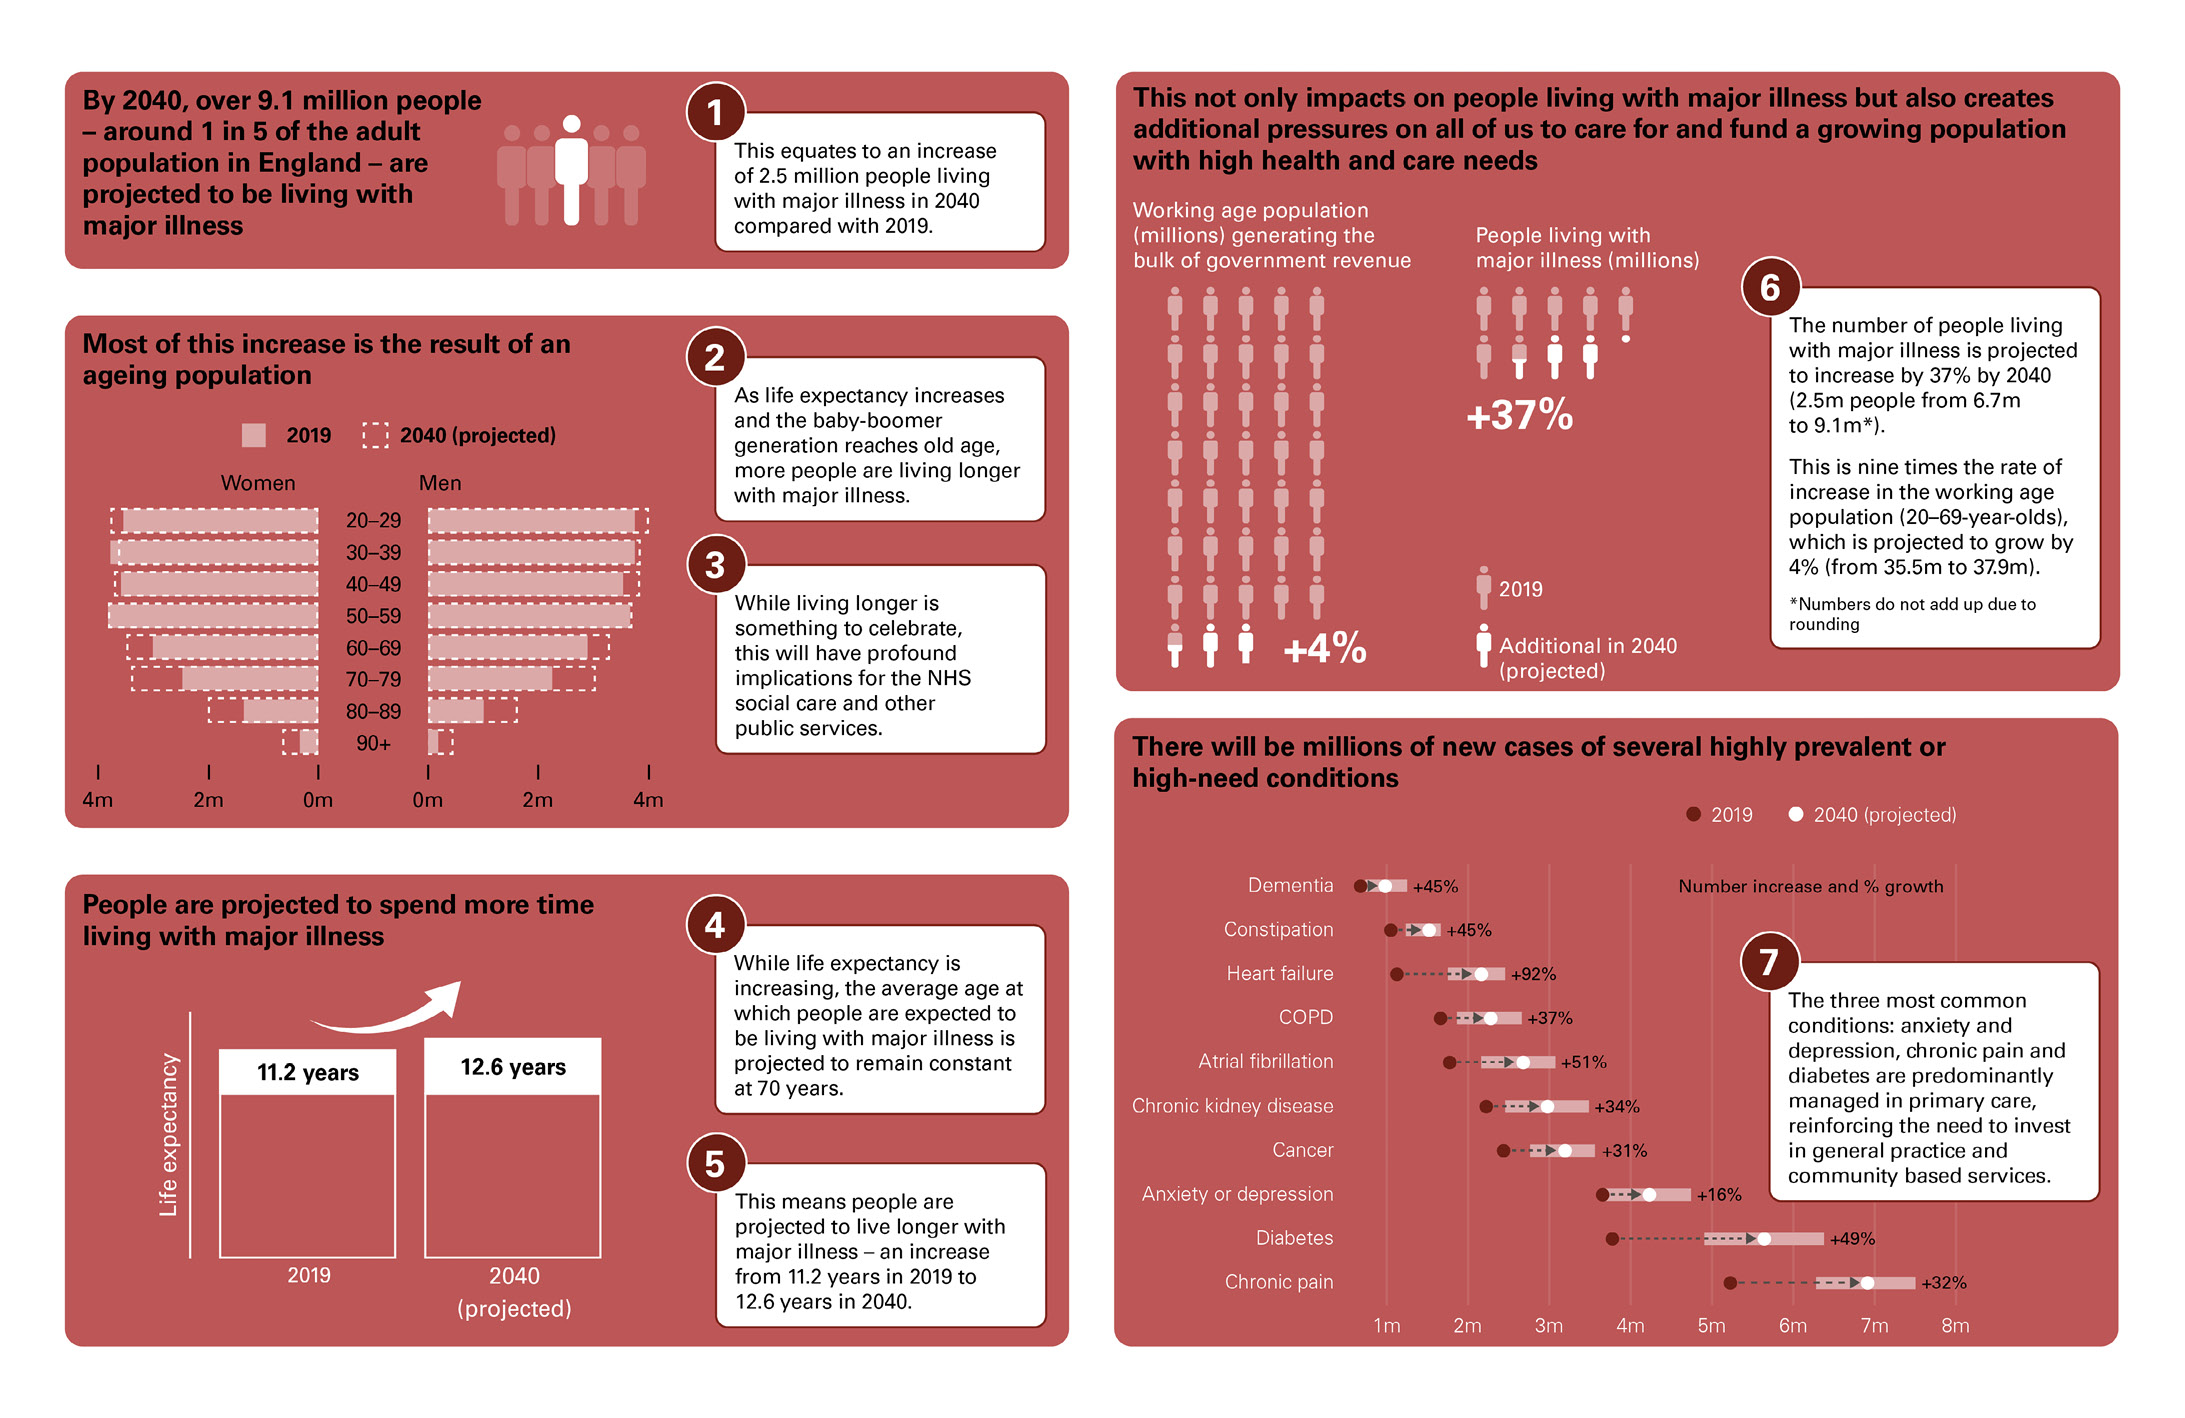
The report finds that four-fifths of the total rise in population morbidity to 2040 will be due to the increase in the number of older people, rather than an expansion of morbidity. Almost 1 in 5 of the population are projected to be living with major illness by then, an increase of more than a third. By comparison, the working age population is projected to increase by only 4% – this population group will be responsible for generating the bulk of government revenues used to fund public services including the NHS.
The analysis is an innovative addition to existing literature. Later this year, further work will project the impact of socioeconomic inequality on changing trends in morbidity, demography and intensity of care use. And there’s more to follow.
Only with a clear sight of future pressures on the NHS can policymakers improve and sustain its mission to the public – providing free at the point of use, comprehensive care. This report makes a unique and much needed contribution and its findings have profound implications for other public services, the labour market and pensions policy.
Dr Jennifer Dixon CBE
Chief Executive, The Health Foundation
Executive summary
How might patterns of ill health change because of our growing and ageing population? And what are the likely implications for health care services? This report explores these questions and projects future levels of illness in England’s population over the next 20 years. Although we have known for some time that an ageing population will mean an increase in demand for health services, this report gives us a better idea of the scale.
Our changing population
The UK population has grown by around a half over the past century, while life expectancy has increased by more than 20 years. Although improvements have slowed in the most recent decade, longer lives are to be celebrated and, in many ways, capture the social and economic progress society has made. But these changes have also brought with them increased demand for health care services. In 2019/20, spending on health in the UK was about 12 times its level in 1949/50 in real terms. By 2019 almost £1 in every £5 of government spending was devoted to health care.
The amount and pattern of ill health is an important factor in shaping our future prosperity and demand for NHS services. Patterns of death and disability have steadily shifted over time, with sustained reductions in mortality from injury and communicable diseases. Consequently, an increasing proportion of the demand on modern health systems is from long-term conditions – such as heart disease, dementia and diabetes – that affect the quality and length of people’s lives and can be managed with treatment and support, but generally cannot be cured. People living with multiple conditions tend to make more use of health care services, live in pain and discomfort and are at greater risk of developing further illness and dying.
Our main findings
- Life expectancy for people living in England is expected to increase further over the next 20 years, but the average age at which people are expected to be living with major illness is projected to remain constant at 70 years.
- The amount of time people are projected to live with major illness is expected to increase from 11.2 years in 2019 to 12.6 years in 2040.
- The number of people living with major illness is projected to increase by 2.5 million by 2040, more than a third. This implies a shift in the share of the adult population living with major illness, from almost 1 in 6 in 2019 (6.7 million) to almost 1 in 5 in 2040 (9.1 million). Most of the increase in people living with major illness is among those aged 70 years and older.
- The number of people aged 20–69 years with major illness increased by over a quarter from 2.4 to 3 million in the decade preceding the COVID-19 pandemic.
- The number of people living with major illness in England is projected to increase by over a third (37%). But the number of 20–69-year-olds (approximately the working age population) is projected to grow by just 4%. This is the group that generates the bulk of government revenues, which are used across all areas of government spending including the NHS.
Our findings matter because anticipating and planning for changes in demand for health care services over the coming decades is vital for policymaking. Investments in health care delivery must often be made years in advance: the workforce requires training, physical infrastructure needs to be built and capital requires careful investment. In addition, these projected changes in ill health have implications that extend far beyond the NHS. They are important for planning other public services, the labour market and pensions policy.
How we project ill health over the next two decades
In this analysis, we aim to inform the debates and decision making about the future need for health care by projecting levels of illness in England’s adult population up to 2040. To measure ill health we look at 20 health conditions that account for 65% of the burden of illness in England. These conditions comprise the Cambridge Multimorbidity Score (CMS), a useful metric for comparing different combinations of long-term conditions, which have very different impacts on quality of life and demand for health services. The CMS assigns a weight to different illnesses based on their impact on the health care system and individuals’ life expectancy. These scores range from 0.08 for hypertension to 1.53 for cancer and 2.50 for dementia.
We split the population into three groups: those with no diagnosed illness; those with some illness (any of the 20 conditions); and those with ‘major illness’, that is, either a single or combination of conditions that total a CMS of greater than 1.5. We use diagnosed illness rather than self-reported health in this analysis because we are interested in different forms of morbidity and our primary aim is to understand the potential impact on health care demand. Self-reported health, while useful under other circumstances, is subjective, reflecting a combination of illness levels, expectations of wellbeing and the impact of treatment.
To project patterns of ill health over the next two decades we use an epidemiological model that is based on existing evidence and the impact of key risk factors – such as smoking, alcohol, obesity, diet and exercise – on rates of illness by age and other characteristics. In our analysis we focus on adults – patterns of illness in childhood and young adulthood are important but beyond the scope of this work.
Overall, our analysis has several limitations. It is based on current evidence on the incidence of illness but there are significant gaps in this evidence. Crucially, our projections assume the impact of each of the 20 illnesses on services and individuals in 20 years’ time will be the same as in 2019. The projections we provide are a base case, designed to give an informed assessment of what could happen in the future based on current data and trends (see Box 1 for further detail on our limitations). They are not forecasts of the future. The value of projections is to support policymakers to both better prepare for the future and to act where policy change could lead to better outcomes.
People are living longer but with major illness
In the past century, life expectancy in England has improved by over 20 years. This, combined with low birth rates since the early 1970s, has instigated a large demographic shift in the population. Between 2019 and 2040, the population is projected to grow by 3.5 million, with almost all of the increase among people aged 70 years and older (3.3 million).
In addition to this demographic shift, the average number of years people spend living with major illness is projected to increase. This is because, although the age at which people are expected to be living with major illness is projected to stay the same, life expectancy is projected to increase. This means, on average, people are expected to live longer with illness.
Figure E1 shows how the age at which people are expected to be living with any illness or major illness, and overall life expectancy, changed between 2010 and 2019. It then projects illness and life expectancy to 2040 given changes in the population’s age profile and trends in the key risk factors of ill health. Between 2010 and 2019 the age at which people were expected to be living with major illness remained constant at around 70 years. At the same time, average life expectancy increased by just over a year (from 80.6 years in 2010 to 81.7 years by 2019). As a result, people are spending 1.3 more years on average living with major illness in England compared with 2010. There has also been a reduction in the age at which people can expect to be living with at least one diagnosed illness.
The trend of people living longer but with major illness is projected to continue over the next 20 years. Projecting to 2040, life expectancy is expected to extend further to 83.1 years, an increase of about 8 months per decade. As the age at which people are expected to be living with major illness is projected to remain constant, if these trends continue the amount of time people are projected to live with major illness will increase.
Figure E1: Average years of life people spend in different states of ill health, England, 2010, 2019 and projected for 2040

Source: Analysis of linked health care records and mortality data conducted by the REAL Centre and the University of Liverpool.
Notes: The black capped bars represent uncertainty intervals. The chart shows expectancy, which is a summary measure. In reality illness and death are distributed across all ages.
The increase in the number of years people are projected to live with major illness comes despite some individual-level risk factors – smoking, cholesterol and blood pressure – showing favourable trends. The health of the population is the result of a complex mix of many moving parts, but there are two key factors driving our projection that people will live longer with ill health.
First, with the exception of coronary heart disease (falling) and asthma (rising), the incidence of illness by age is projected to be more or less stable. In large part, this reflects rising levels of obesity over recent decades, counteracting the favourable trends in smoking, cholesterol and blood pressure. Many long-term health conditions are associated with obesity and obesity rates almost doubled in England between 1993 and 2019. Although we project a more muted increase in the future, many more of the cohort of people living into old age between 2019 and 2040 will have spent prolonged periods of their life with obesity. This change brings an accumulated increase in their risk of developing long-term illness.
The second factor is that medical advances have meant that people are living longer lives but not, on average, spending more time in good health. Without ‘cures’ for many conditions, people are therefore living their additional years with illness and the average person is living with more ill health.
The number of people living with major illness is projected to increase by more than a third, reaching almost 1 in 5 by 2040
Relatively modest changes in the overall size of England’s population are expected over the next two decades – increasing by around 3% per decade compared with 7% from 2010 to 2019. But nearly all population growth will be among people aged 70 years and older (3.3 million out of 3.5 million). Overall, the number of people living with major illness is projected to grow by 2.5 million, from 6.7 million people in 2019 to 9.1 million by 2040 – an increase of more than a third. By 2040, almost 1 in 5 people (19%) aged 20 years and older are projected to be living with major illness, moving from almost 1 in 6 in 2019.
The majority (80%) of the projected increase in major illness is among those aged 70 years and older. The number of people aged 20–69 years with major illness increased by over a quarter in the decade preceding the pandemic, from 2.4 to 3 million. Our projections suggest that by 2030 this will increase again, by a sixth, before stabilising to 2040, resulting in 3.5 million working age people living with major illness.
The number of people living with major illness in England is projected to increase by over a third (37%). But the number of 20–69-year-olds (approximately the working age population) is projected to grow by just 4% – this is the group that generates the bulk of government revenues. These revenues are used across all areas of government spending including the NHS.
Figure E2: The estimated number of people living with major illness in England, past and projected

Source: Analysis of linked health care records and mortality data conducted by the REAL Centre and the University of Liverpool.
Note: The black capped bars represent uncertainty intervals. To better represent the working age population, for Figures 5 and 6 we present the estimated and projected number of people living with and without major illness aged 20 years and older. The model is designed to project the population aged 30 years and older. We therefore assume that the proportion of people living with major illness aged 20–29 years is the same in 2040 as in 2019. For more detail see our modelling working paper. Watt T, Raymond A, Rachet-Jacquet L, Head A, Kypridemos C. A microsimulation model for multimorbidity in England. The Health Foundation; 2023.
These projections are an extension of what we saw in the decade before the pandemic. From 2010 to 2019, the population grew by 3.6 million and we saw an increase of 1.4 million people living with major illness – more than a 25% increase.
Conditions typically diagnosed and managed in primary care are projected to increase at the fastest rates
For health care planning it is also essential to understand trends within individual conditions. We project an increase in prevalence of 19 of the 20 conditions we looked at. The exception is coronary heart disease, which is projected to fall from 6.6% of the population aged 30 years and older in 2019 to 5.3% in 2040. This is the result of declining smoking rates combined with wider use of more effective preventive medication.
Figure E3 shows the projected number of diagnosed cases for the 10 conditions with the highest impact on health care use and mortality in 2019 and 2040. The largest increases in absolute number are for chronic pain and diabetes. We also project over a 30% increase in the number of people living with cancer, chronic obstructive pulmonary disease (COPD) and chronic kidney disease. In most cases, these increases are driven by population ageing rather than a rise in age-specific rates or earlier onset: rates of illness rise with age – for example 1 in 5 people aged 80–84 years has type 2 diabetes, more than double the rate of those aged 55–59 years. Our projected increase in prevalence is not the result of large increases in age-specific rates of incidence: of the 20 conditions, only asthma is projected to increase in incidence.
These changes denote a gradual shift in the health care needs of the population over time. The fastest growth is in conditions that are predominantly managed in primary or other non-acute care settings, making this an important area for further research. In addition, the growth in prevalence increases the complexity of care delivery, with more people living with multiple conditions. In 2019, people aged 70–74 years had an average of 2.7 diagnosed conditions. People aged 85 years and older had an average of 5.2 diagnosed conditions. By 2040, the number of people aged 85 years and older will increase but our projections also suggest that they will have an average of 5.7 conditions – increasing the complexity of managing their health needs.
Figure E3: Projected total number of diagnosed cases for the 10 conditions with the highest impact on health care use and mortality among those aged 30 years and older, including demographic changes, England, 2019 and projected for 2040

Source: Analysis of linked health care records and mortality data conducted by the REAL Centre and the University of Liverpool.
Note: Red shaded bars represent uncertainty intervals. COPD is chronic obstructive pulmonary disease.
Helping people to live well with illness
One critical question is whether this rise in the number of people living with major illness is inevitable. Reducing the number of people living with major illness over the next two decades would be a very substantial challenge: four-fifths of the projected increase in the average level of ill health is the result of population ageing. This is the result of longer life expectancy among people aged 70 years and older rather than increasing rates of illness within age groups.
Prevention aims to delay the age at which people develop these long-term health conditions but often there is also a gain in life expectancy, particularly when combined with improvements in treatment. As people live longer, they may also develop other diseases. The overall effect of disease prevention programmes on the amount of illness, its severity and need for health services is therefore complex. Preventing disease and delaying its onset produces important benefits to individuals and communities. But because delayed illness often leads to longer life, it may not automatically reduce pressures on the health system.
Given more people are projected to be living with major illness and multiple conditions, helping people to live well with illness is important and a key challenge for the health service. New technologies and health care innovation raise the possibility that some major illness could become more minor, in terms of its impact on people’s quality of life and life expectancy.
The impact of technological development on the cost of services is even harder to predict. There are some technologies that are purely cost saving, allowing the health system to deliver the same or a similar service at a reduced cost, but these are relatively rare. Instead, many new technologies offer improved outcomes or treatment experience (such as reduced side effects). Improved treatments then tend to come with a higher cost per patient or mean that many more patients are suitable. Technological innovation in health care can take several forms ranging from new drugs, new diagnostic and monitoring equipment, the use of data to streamline models of care and the science of genomics that allows for the development of personalised medicine. These changes can improve prevention and early diagnosis, as well as help patients live better with their illness. However, it is hard to know in advance how this kind of progress will affect these projections.
A ‘good problem’ to have?
This report provides sobering reading: there is a large projected increase in levels of ill health to 2040 primarily driven by an older population, and this is likely to be expensive. This will have implications for decisions about investment in health care, as well as for other public services, the labour market and pensions policy. However, these changes are also a testament to progress and a source of optimism – in many respects this is a good problem to have. There have been large improvements in life expectancy over the past 100 years, driven by improved living standards, public health interventions and advances in medical technology. Over the next 20 years, we project on average that people will spend their additional years with major illness rather than live longer in good health.
The purpose of the NHS, other public services and the wider welfare system is to benefit the lives of the people who live in England, while trying to make the most efficient use of the resources available. The health of the economy and the health of the population move in lockstep. Therefore the projections we present in this report highlight the importance of cross-government, long-term action. This is the only way to ensure our society and economy are set up to meet the needs of our changing population.
† The CMS conditions comprise 65% of all disability-adjusted life years (DALY) and 73% of those due to chronic illness in England in 2019 as per the Global Burden of Disease (Institute for Health Metrics and Evaluation (IHME), 2019).
‡ In 2019 for those aged 30 years and older in England with any illness (CMS greater than 0), nearly a third of all individuals had a score greater than 1.5 (70th percentile). The mean score was 1.2 and the median score was 0.8.
§ During this time electronic patient records have improved so it is unclear how much of the increase is driven by better diagnosis or greater prevalence of lower levels of illness. Particularly, reported anxiety and depression has increased rapidly since 2010.
Key findings
In this report we explore how patterns of ill health might change because of our growing and ageing population.
There is no silver bullet to reduce the growth in the number of people living with major illness. A long-term plan is needed to reform, modernise and invest in the NHS, alongside a bold new approach to investing in the nation's health and wellbeing.
Read our report to understand the full picture.
Introduction
Over the past century the UK population has grown by around a half,, while life expectancy has increased by more than 20 years. Although improvements have slowed in the most recent decade, longer lives are to be celebrated and, in many ways, capture the progress made by society and the economy over the past century. These changes have been brought about through a combination of improvements in public health, medicines and medical technology, as well as wider socioeconomic factors such as changing living standards, lifestyles and access to public services.,,
But these changes have also brought with them increased demand for health care services. Since 1948, increases in NHS spending have outpaced GDP growth, which generates tax revenue to pay for public services. As a result, public spending on health care services increased from 2.8% of UK GDP in 1955/56 to 7.4% in 2019/20 before the COVID-19 pandemic., In 2019/20, spending on health in the UK was about 12 times the level it was in 1949/50.,
Although the forces that have driven increases in life expectancy remain largely unchanged, today’s economic context is very different. The growth in government health expenditure since 1948 was in large part compensated for by significant reductions in defence spending as a share of GDP that are unlikely to be replicated. Economic growth has stagnated since the 2008 recession, a decade of austerity has left very few other areas of public spending to cut and the baby boomers – who helped to spur economic growth when they entered the labour market – are either retired or approaching retirement. Nearly all England’s projected population growth of 3.5 million between 2019 and 2040 is expected to be among those aged 70 years and older.
This matters because anticipating and planning for how demand for health care services may change over the coming decades is vital for policymaking. Investments in health care delivery (such as training staff and building facilities) must often be made years in advance., Those in charge of public finances therefore need to plan ahead when making choices about how to raise funds for such investment.
About this report
In this report, we estimate the current and project the future burden of illness in England. To do so, we use the best available administrative health care data, which link primary care records with hospital records and mortality. We then combine these data with a cutting-edge model and epidemiological evidence to project how levels of ill health might be expected to change between now and 2040. These projections are based on trends in some risk factors for illness (such as smoking, alcohol and BMI), illness rates, life expectancy and demographics in England.
We also present the projected numbers of people with individual conditions, showing how the changing pattern of ill health at a given age and the changing population structure together drive these trends. Changes in morbidity among an ageing population are the result of the dynamic interaction of complex factors. We therefore provide insights into how prevalence (the share of the population with a condition) depends on the interplay between rates of incidence (or onset) and rates of mortality. Finally, we discuss our findings and the issues policymakers are facing, highlighting key insights and implications for the health care system and beyond.
This report is the first in a new series of projections of illness, health inequalities and health care needs in England from the Health Foundation’s REAL Centre. This research programme is conducted in partnership with the University of Liverpool. The results presented here give a sense of the scale of growth in future health needs in England. This raises questions about future patterns of health inequality and demand for health care resources that will be explored in subsequent research.
Background and approach
How we estimate population health
Often-cited measures of population health are ‘healthy’ and ‘disability-free’ life expectancy – the number of years a person born can expect to remain in good health or without disability. Healthy and disability-free life expectancy are based on people’s self-reported experiences of illness. This is dependent on several interrelated factors such as: the presence of illness (and its effect on the ability to undertake daily activities); condition management; availability and effect of treatment and finally the context and expectations of the person. Diagnosed illness has been shown to have a more direct relationship with health care demand. Moreover, studies have shown that the relationship between self-reported health and diagnosed health can vary for different population groups.,,,, This suggests that diagnosed illness may be a more accurate predictor of demand for health care than healthy and disability-free life expectancy.
In this report we therefore focus on levels of diagnosed illness using primary care administrative data from the Clinical Practice Research Datalink (CPRD), linked to secondary care records (from the Hospital Episode Statistics (HES)) and mortality records. Although no measure is perfect and some illness remains undiagnosed in health records (see Box 1), patient-level primary care records have several advantages. First, they capture instances of well-managed illness that might not be reflected in hospital records. Second, they also enable estimation of illness for more granular population groups than more aggregated health data. Access to patient-level primary care records is a rarity in UK health policy research – to our knowledge this is the first time they have been used in a model projecting health needs in England.
How we use the Cambridge Multimorbidity Score (CMS)
In order to quantify illness and multimorbidity more precisely, we use the Cambridge Multimorbidity Score (CMS). The score assigns a weight or score to 20 conditions based on how the illness is likely to affect patients’ use of primary care, emergency health services and likelihood of death. For instance, cancer and heart failure are given higher scores than hypertension (high blood pressure) or hearing loss, because they are more likely to lead to death, unplanned hospital admissions or greater primary care needs. For those with multimorbidity, scores are added together, meaning individuals with the same score can have a different number and combination of conditions. This provides a common metric across illnesses and allows us to aggregate multimorbidity. We then use the average score for different population groups to define average illness levels. The assigned scores for the CMS are reproduced in the modelling working paper, section 8.1.
In addition, we split the population into three groups by CMS, as summarised in Table 1. We did this in order to summarise the complexity of multimorbidity in the simplest way possible: these categories are particularly useful when projecting the total number of people with similar levels of illness that lead to high health care needs.
Table 1: Using the Cambridge Multimorbidity Score (CMS) to estimate average levels of illness within age groups, England, 2019
|
Illness measure |
CMS range |
Percentage of population aged 30–69 years |
Percentage of population aged 70 years and older |
Percentage of total population aged 30 and older |
|
No illness |
0 |
53% |
12% |
45% |
|
Some illness |
CMS greater than zero but up to 1.5 |
37% |
41% |
38% |
|
Major illness |
CMS greater than 1.5* |
10% |
47% |
17% |
Note: Each column adds up to 100%.
Nearly half (45%) of the population aged 30 years and older in England have none of the 20 chronic conditions. Nearly a fifth (17%) have major illness as indicated by a CMS greater than 1.5. There is no officially recognised threshold for an individual’s overall CMS that indicates high health care needs or a high risk of mortality. We chose a threshold of 1.5 because it can indicate the presence of multimorbidity for conditions other than single diagnoses of cancer or dementia.
As illnesses tend to accumulate, many people will pass through the three groups as they age and are diagnosed with more conditions, causing their CMS to rise. The relationship between CMS and age is highlighted by the contrast between the third and fourth columns in Table 1. Almost half of those aged 70 years and older in our data fall into the major illness category in 2019, compared with just 10% of the 30–69-year-old population.
How we project future levels of illness
Modelling
The REAL Centre’s demand model projects future levels of illness by combining the CMS with a microsimulation model, the IMPACTNCD framework, developed by the University of Liverpool. Our model uses epidemiological evidence on the relationships between risk factors such as smoking and diet, the 20 health conditions we measure and mortality to project levels of diagnosed ill health in England’s population aged 30 years and older over the next two decades.
Broadly, the model works by creating a population that is representative of England from 2013 to 2019 using primary care administrative records. The model is then used to project longevity and health by simulating the onset of 20 chronic conditions and deaths for each subsequent year. This means that for each year, the model randomly assigns conditions to each individual with probabilities based on their characteristics including age, sex, geographic region, ethnicity and socioeconomic status. The probability of each individual dying each year is then ascribed on the same basis. The probability of onset of illness and death also depend on their assigned exposure to biological and behavioural risk factors and epidemiological evidence on risk factors. The risk factors we include are smoking, alcohol, diet, exercise, BMI, blood pressure and cholesterol. Future levels of risk factors are based on an assumed log-linear continuation of current trends, ie trends continue but the rate of change decreases over time.
Individual-level health changes produced by the model are then summed up to form the basis for our projections. Further details can be found in our modelling working paper, section 8.3. To isolate the effect of changes to the average level of illness from changes in population structure over time, we show trends in illness standardised for age, sex and deprivation alongside overall trends throughout the report.
Box 1: What are the limitations of our approach?
Projections are designed to make an informed assessment of what could happen in the future based on current data and trends. There is inherent uncertainty in projections analysis as it requires many assumptions about the factors that determine the number of people living with health care needs. However, given the extent of recent improvements in methods and data linkage, this report gives a uniquely detailed presentation of ageing and multimorbidity. The model itself is shared in greater detail in our modelling working paper and technical appendix. Aside from the model, we highlight four key limitations of the data and methods we use.
First, throughout this report we project trends in diagnosed morbidity. We use novel data that link primary and secondary care health records to measure morbidity rates for different population groups. However, these will differ from actual population morbidity rates because they do not account for unmet need. Over time the quality of electronic health records has improved. Whether changes in diagnosis over time were the result of true changes in people’s underlying health or better data recording cannot be deduced from these data. However, the impact of diagnosis and coding practices is expected to have a far more muted effect on major illness.
Second, our projections assume that the impact of ill health on care use remains the same over time. This is because our definition of morbidity is based on the CMS, which encapsulates the static relationship between individual conditions and their impact on health care use and mortality at a given point in time. But in reality, this impact can change over time due to changes in the severity of these illnesses, the stage of illness at which patients are diagnosed, or how they are treated and managed by the NHS and other care services. Medical science and technology has changed a lot, with innovations in pharmaceuticals, surgery and other treatments, as well as improvements in care delivery or screening policies leading to earlier diagnosis. All these can make a substantial difference to patients’ quality of life and outcomes. However, given the high uncertainty around the scale of these possible future improvements, in this report we project forward the status quo of the current state of care. Third, our projections make use of the Office for National Statistics (ONS) principal population projections. Additional uncertainty from the potential variation from those projections is not included in this analysis.
Fourth, the CMS does not include every single chronic condition. It is made up of 20 conditions that contributed to 73% of disability-adjusted life years due to chronic illness in England in 2019. This means the CMS cannot capture the full burden of chronic illness, but does capture a large majority of it.
Potential pathways for overall changes in the population’s health
The model can be used to analyse several aspects of projected future levels of illness. In this report we focus on two. The first is how the time spent in ill health by the average person is projected to change over time. The second is how the overall level of ill health is projected to change across the population, including the projected growth in the size and the ageing of the population in England (henceforth ‘population change’).
Several paths for population health are possible, depending on the relative changes in onset of illness and life expectancy:
- More illness (‘expansion of morbidity’): as a result of longer life expectancy, earlier onset of illness or both, people spend more time in ill health.
- Less illness (‘compression of morbidity’): population health improves faster than life expectancy, so people become ill later and spend less time in ill health.
- No change: the time people spend in ill health remains the same. The population might live longer, but the additional years are spent partly in poor health, partly in good health.
- More illness, but less severity (‘dynamic equilibrium’): people spend a greater share of their lives with diagnosed conditions, but the care needs associated with dealing with those conditions are lower.
The path taken has direct implications for health care demand, as longer periods of morbidity imply a greater need for health services. The consequences for health and wellbeing are more ambiguous as it depends not just on how the length of time with illness is changing but why. This is because if an individual’s ill health is well managed they can have an independent, enjoyable and active life. In this report, when we refer to health care demand, we focus only on the implications for the NHS given limited data on care needs and the complex relationship between health and social care that has been investigated elsewhere.
To adequately inform resource planning, we must also take into account population change. To do this, we combine estimates of the time spent in ill health with ONS projections of the size and demographic structure of the population. It is this overall burden of illness that has direct implications for health care demand. Previous attempts to project health spending, such as by the OBR in the UK and the OECD, have relied on different assumptions about future population health trajectories.,, Our results provide projections of population health using current trends in risk factors and life expectancy, and therefore may help provide some consistency in these exercises.
Due to our focus on long-term trends in ageing and health and our data sample covering up until 2019/20, we do not include COVID-19 and its impacts in our analysis. The pandemic has affected the lives of many, caused disruption to health, diagnostic and community services, and the impacts are not yet fully realised. Our focus on the decades to come means it is not possible to include sensible estimates of the long-term impacts of COVID-19 on ageing and multimorbidity.
** The analysis was conducted using the Clinical Practice Research Datalink (CPRD). The data are provided by patients and collected by the NHS as part of its care and support. Regulatory approvals to use CPRD data for this analysis were granted by the CPRD Independent Scientific Advisory Committee (ISAC protocol number 20-000096). (https://cprd.com/protocol/econometric-analysis-distribution-primary-and-secondary-costs-and-activity-patients-non).
†† These conditions are: dementia, cancer (all types), chronic obstructive pulmonary disease (COPD), atrial fibrillation, heart failure, constipation, epilepsy, chronic pain, stroke/transient ischaemic attack (TIA), diabetes (type 1 or 2), alcohol problems, psychosis/bipolar disorder, chronic kidney disease, anxiety/depression, coronary heart disease, connective tissue disorders, irritable bowel syndrome, asthma, hearing loss and hypertension.
‡‡ In 2019 for those aged 30 years and older in England with any illness, nearly a third of all individuals had a score greater than 1.5 (70th percentile). The mean score was 1.2 and the median score was 0.8.
§§ The model begins in 2013 to allow for quality assurance checks between the modelled and observed data but our analysis uses 2019 as the starting year.
¶¶ People living in more deprived areas tend to be younger compared with those living in more affluent areas. This is because, among other things, individuals from more affluent areas tend to live for longer. Population growth is also different among deprived and affluent areas. Therefore, when we present outcomes by year, we use this standardisation to account for the effect of different age distributions and different growth among the age – sex – decile groups of Index of Multiple Deprivation areas.
*** In its central projection of health spending, the Office for Budget Responsibility (OBR), the independent government spending watchdog for the UK, assumes constant levels of health by age and sex that, given the projected increases in life expectancy, means an expansion of morbidity.
††† The OECD (2012) assumes, in its cost pressure and cost containment scenarios, various degrees of compression of morbidity (or ‘healthy ageing’) by modelling projected additional years of life to be spent in good health.
Projections of ill health: overall levels of ill health in England over the next 20 years
Key points
- The large baby-boomer cohorts reaching retirement, combined with the projected expansion of ill health, means that 2.5 million more people aged 20 years and older are projected to be living with major illness between 2019 and 2040.
- The average level of ill health in England’s population is projected to rise by 5% through to 2040. Once population changes are factored in, the average level of ill health among those aged 30 years and older is projected to grow by 24%. Almost four-fifths of the expected rise in ill health is therefore attributable to population ageing.
- We project that improvements in life expectancy would be accompanied by an increase in the time spent with major illness, to over 12 years on average by 2040 (an ‘expansion of morbidity’).
- The 2.5 million increase in people living with major illness amounts to an increase of over a third (37%). Over the same period the number of 20–69-year-olds is projected to grow by just 4%. This is the group that generates the bulk of government revenues, which are used across all areas of government spending including the NHS.
- Levels of multimorbidity are projected to rise for all age groups. Individuals aged 85 years and older are projected to have the largest increase in the number of conditions. In 2019, this group had 5.2 long-term conditions on average. This is projected to increase to an average of 5.7 conditions in 2040.
- The combined effects of longer life, without significant reductions in rates of illness by age, are projected to lead to higher lifetime demand for health care. However, if people’s needs are well met this means more time for them to spend enjoying life.
People are projected to spend more time with major illness
The level of diagnosed illness tends to increase with population ageing. There are two reasons for this. First, for many conditions such as cardiovascular disease and dementia, the probability of developing the condition increases with age. Second, many health conditions are also chronic and incurable, so levels of illness are cumulative: the number of 75-year-olds with a condition is the sum of those newly diagnosed in each year and all previously diagnosed people. Because of this, rates of multimorbidity (having multiple illnesses at a time) also rise with age. We therefore expect, for example, that at any point in time the average level of ill health among 70-year-olds will always be higher than levels of ill health among 60-year-olds.
The relationship between age and health is important in understanding the changes in overall health in the population, but there are two important caveats. First, in this analysis we focus largely on averages. There are many 70-year-olds that have less illness than many 60-year-olds (as we have shown for people living in the least and most deprived areas in an earlier publication). Second, as we showed in our 2021 insight report, the average rates of illness at a particular age can change across cohorts. For example, the 70-year-olds of 2040 may have lower rates of certain conditions than the 70-year-olds of 2019. Our model accounts for changes that would be expected based on current trends in risk factors (see our modelling working paper, section 4 and the technical appendix for more detail on our projection methods).
Life expectancy and illness-free life expectancy projections
Our microsimulation model takes a representative population and combines it with recent trends in individual-level risk factors, the rates at which people develop illness and the rates of mortality conditional on their health to project future rates of illness and life expectancy.
Figure 1 shows how overall life expectancy and the time spent in different states of illness changed between 2010 and 2019 and how they are projected to change to 2040. In the 9 years from 2010 to 2019, life expectancy increased by 1.1 years (1 year for women, 1.2 years for men). This was less than half the increase seen in the period 2000–2010 (2.7 years). The model, which aligns with the ONS 2020-based results, projects that life expectancy will continue to improve at a gradual rate (just under 1 year per decade) so that, in 2040, the population in England is expected to live to 83.1 years on average, an increase of 1.4 years (this is an increase of 0.8 and 2.0 years for women and men respectively).
From 2010 to 2019 there was almost no change in the time spent without major illness. In 2019, people could expect, on average, to spend 70 years without major illness and that is projected to continue to 2040. But, between 2019 and 2040, we project life expectancy improvements to be accompanied by an increase in the time spent with major illness corresponding to an expansion of morbidity. This will translate into people spending 12.6 years with major illness in 2040 compared with 11.2 years in 2019.
This expansion in morbidity has implications for both health care demand and for quality of life. More people spending longer in ill health is likely to mean greater demands for health care. This would imply a need for greater spending, unless in the future the health system can generate counterbalancing productivity improvements. A projected expansion may therefore be met with concern. It is, however, equally important to note that the expansion in morbidity corresponds to an increase in individual and societal welfare. As is evidenced by the demand for life-extending treatments, longer life with better condition management is something that is desired by patients.
Figure 1: Average years of life people spend in different states of ill health, England, 2010, 2019 and projected for 2040
Source: Analysis of linked health care records and mortality data conducted by the REAL Centre and the University of Liverpool.
Notes: The black capped bars represent uncertainty intervals. The chart shows expectancy, which is a summary measure. In reality illness and death are distributed across all ages.
We project a minor change, of less than a year (0.8 years), in illness-free life expectancy – with people on average reaching 44 years of age without illness. The slight reduction in illness-free life expectancy relates to an increased projected incidence of asthma (details in the next section and modelling working paper, section 5). The projected increase in life expectancy will be accompanied by a projected increase in time spent with illness from 36.8 years in 2019 to 39.0 years in 2040.
Past trends in life expectancy and illness-free life expectancy
From 2010 to 2019 there was a large increase in the amount of recorded illness in primary and secondary care, particularly for conditions such as anxiety and depression and alcohol problems that are likely under-diagnosed and under-recorded., We can see in Figure 1 that illness-free life expectancy was 2.3 years lower in 2019 than in 2010 (from 47.2 to 44.9 years).
These findings are consistent with analysis from the Global Burden of Disease data for England which found that between 2010 and 2019, the total number of years lived with disability across the population (YLD) increased by 10%.
The life expectancy and illness-free life expectancies presented in Figure 1 are summary measures, while in reality illness and death are distributed across all ages. In Figure 2 we illustrate this variation, showing the survival curves for major illness and life expectancy from 2019 and projected in 2040. These curves use mortality rates and the share of the living population with major illness, by age from a single year.
This helps to show the scale and distribution of illness requiring high levels of health care for people at different stages of life – whether, for instance, we see a larger number of people living with illness at working age. It also shows us the way in which life expectancy is projected to change over time. These data represent period life expectancies, ie the number of years a person could expect to live and live without major illness if they experience the mortality and incidence rates of a particular time period throughout their lives.
Figure 2: Proportion of people who reach a given age without major illness or dying, England, 2019 and projected for 2040

Source: Analysis of linked health care records and mortality data conducted by the REAL Centre and the University of Liverpool.
The lines show the share of people that survive each 5-year age band in 2019 (solid) and 2040 (dashed). The black dashed line, showing the projected likelihood a person will survive to each age in 2040, is clearly above the black solid line (for 2019). This gap corresponds to a reduction in projected mortality rates, particularly for those aged 70 years and older. This is where the projected increase in life expectancy manifests. By contrast, the projected likelihood of surviving without major illness does not change from 2019 to 2040.
For instance, from birth, two-thirds (66%) can expect to survive through to age 84 years based on 2019 mortality rates, and 38% are expected to be living with major illness. In 2040, life expectancy is higher and 70% are expected to survive to this age. Because more people are surviving for longer, 41% of the cohort are expected to be living with major illness at this age (higher than the 38% in 2019).
This graph also helps us to understand the distribution of major illness among those of working age. In the 55–59 years age group, 19% of the population are expected to either have died (5%) or be living with major illness (14%). By the current retirement age (65–69 years), more than a third of people are projected either to have died (10%) or be living with major illness (26%). This is not projected to change over time by 2040. This has important implications for policies around retirement.
These projections highlight the role of both changes in life expectancy and rates of diagnoses by age in the expansion of morbidity. It is, however, important to understand that some of the same factors affect both. Over the past century, many factors have contributed to improvements in health: people are better educated, smoking rates are down, homes are better insulated and the risk of many infectious diseases has fallen due to vaccines and public health interventions. This lower exposure to risk factors allows people to live longer, but it also delays the onset of illness. Healthier lives may also allow people to live longer after being diagnosed with a particular condition. In essence, if population health improves, there will be an expansion in morbidity if the improvements to life expectancy are greater than the delays to the onset of illness.
Another important driver of improvements in life expectancy has been, and will continue to be, innovations in medicine and improvements in care delivery. However, this also affects the time spent living in ill health. Preventive medicine and curative care can reduce the prevalence of some conditions. Early diagnosis may increase the probability of a cure but may also lead to earlier recorded illness. Treatments often improve quality of life and extend lifespan, allowing people to live longer, fuller lives with diagnosed illness.
In these cases, there can be an expansion of morbidity that improves individual wellbeing: it is arguably better to be born in 1980 than 1940 because life expectancy is higher, even though a greater number of those years are lived in ill health with high health care demands.
The total number of people with diagnosed major illness is projected to increase by more than a third
2.5 million more people are projected to be living with major illness in 2040 than they were in 2019, an increase of more than a third. At a population level, the number of people with ill health depends on both the share of people with illness in each age group, and the number of people in each of those age groups. In addition to an increase in life expectancy and the time spent with major illness (as shown in Figure 1), England is also undergoing a demographic shift (see Box 2) that will see the baby boomers, born in the 1940s, 1950s and 1960s, reach old age.
Box 2: Projected demographic changes in England
The Office for National Statistics (ONS) projects that England’s population will grow from 56.3 million in 2019 to 59.8 million in 2040. This is potentially 3.5 million more people for whom to deliver care when they need it. The population will also become older on average, as the population aged 70 years and older is projected to rise from 7.6 million to 10.9 million, to comprise nearly a fifth of the population in 2040.
The total amount of health care required depends on a combination of the share of people with illness at a given age and the number of people at those ages. Based on the projected population structure, we can therefore estimate the projected growth in the burden of illness in the population in England. The projected population structure change between 2019 and 2040 from the ONS is reproduced in Figure 3.
Figure 3: Projected changes to the population structure by 10-year age band, women and men, England, 2019 and projected for 2040

Source: 2020-based ONS principal population projections for England; ONS historical estimates of the population for the UK and constituent countries.
There are three key patterns that emerge from these projected changes to the population structure. First is a decrease in the population younger than 20 years with more marked reductions for those younger than 10 years. This is partly driven by low fertility rates (below replacement level), which have been persistent since the end of the 1970s (Figure 4).
Second is a large increase in those aged 60–80 years. This is a consequence of the large birth cohorts in the 1950s and 1960s entering and progressing through old age. Figure 4 shows the peak of the baby boom in 1964; people born in this year were 55 years old in 2019 (working age) and will be 76 years old in 2040 (post-retirement age).
Figure 4: Total Fertility Rate (TFR), England and Wales, 1940–2018

Third is the increase in the population aged 80 years and older. This is a result of continued increases in life expectancy (albeit with improvements slowing in the past decade). To illustrate the impact of improving mortality rates, we can compare the likelihood of two cohorts of people born in England surviving to a given age – one born in 1910, the other in 1930. 19% of the 1910 cohort survive to 90 years in the year 2000, while 30% of the 1930 cohort survive to 90 years in 2020. This means if we had not had the overall improvements in mortality observed since 2000, then 37% of the 90-year-olds in England at the end of 2019 would not have been there. That is around 200,000 people.
If we combine our projections of the prevalence of chronic conditions by age with the population projections for England, we can estimate the growth in the number of people living with major illness. Figure 5 shows what the expansion of morbidity means at the population level. The next two decades are expected to see relatively modest changes in the overall population; increasing by around 3% per decade compared to 7% from 2010 to 2019. However, the increase in the size of the population aged 70 years and older, combined with the trend in the years spent with major illness, means that the number of people living with major illness is projected to increase from 13% of the population aged 20 years and older in 2010 to 19% in 2040. This means that by 2040, almost 1 in 5 people are projected to be living with major illness, increasing from almost 1 in 6 in 2019.
Figure 5: Population living with and without major illness, England, past and projected

Source: Analysis of linked health care records and mortality data conducted by the REAL Centre and the University of Liverpool.
Note: The black capped bars represent uncertainty intervals. To better represent the working age population, for Figures 5 and 6 we present the estimated and projected number of people living with and without major illness aged 20 years and older. The model is designed to project the population aged 30 years and older. We therefore assume that the proportion of people living with major illness aged 20–29 years is the same in 2040 as in 2019. For more detail see our modelling working paper.
These projections are the extension of a trend we saw in the decade before the pandemic. Between 2010 and 2019, the population grew by 3.6 million and we saw 1.4 million more people living with major illness: more than a 25% increase. There have also been important changes in the number of people aged 20–69 years living with major illness. In the decade preceding the pandemic this number increased by over a quarter, from 2.4 to 3.0 million people. That means almost 10% of the population aged 20–69 years (the bulk of the working age population) were living with major illness, impacting not just their own quality of life but economic productivity. Figure 6 shows that on current trends, by 2030 we project this number will rise to 3.5 million people before stabilising at that level.
Figure 6: The estimated number of people living with major illness in England, past and projected

Source: Analysis of linked health care records and mortality data conducted by the REAL Centre and the University of Liverpool.
Note: The black capped bars represent uncertainty intervals. To better represent the working age population, for Figures 5 and 6 we present the estimated and projected number of people living with and without major illness aged 20 years and older. The model is designed to project the population aged 30 years and older. We therefore assume that the proportion of people living with major illness aged 20–29 years is the same in 2040 as in 2019. For more detail see our modelling working paper.
The increase in the number of people with diagnosed illness, in combination with falling fertility rates and people living for longer, creates a stark picture. The number of people living with major illness in England is projected to increase by over a third (37%). But the number of 20–69 year olds is projected to grow by just 4% – this is the group that generates the bulk of government revenues. These revenues are used across all areas of government spending including the NHS.
The combined impact of these trends is projected to reduce the ratio of the working age population to the older population with major illness by nearly a third between 2019 and 2040 (from 10:1 to 7:1). In 2019 there were around 35.4 million people aged 20–69 years, while there were 3.6 million people aged 70 years and older with major illness. In 2040 we project that the respective population groups will reach 36.9 million and 5.6 million. The projections continue the trends of the recent past: in 2010 the ratio was 12:1.
Demographic changes drive the projected growth of ill health
Defining ill health and multimorbidity using the CMS allows us to directly compare the health of the population over time. The projected changes in overall health depend on the sum of the prevalence of many individual conditions. We present projections for these individual conditions in the next section, but here we summarise the projected growth in illness using the average CMS. This helps to visualise the impact of the projected increase in the time individuals spend in ill health on average and the population changes between 2019 and 2040.
Figure 7 shows that, excluding population changes, the average CMS in the population is projected to grow by 5.3% between 2019 and 2040 (0.2% per year). This is a consequence of people living longer and spending more time with illness. This is despite favourable trends in some risk factors such as smoking, cholesterol and blood pressure. Obesity rates in England almost doubled between 1993 and 2019. Although we project a more muted rate of increase in the future, people who have lived more of their lives in the 21st century will have greater lifetime exposure to obesity. The health implications of obesity can act to counter improvements in some of the other risk factors.
Between 2010 and 2019, life expectancy improved without corresponding increases in healthy life expectancy and this trend is projected to continue. This implies that life is being extended post onset of illness, likely through improved medical intervention. This places upward pressure on the levels of illness in the population: the marginal gains in life expectancy made by health interventions are spent in poorer health.
This change excludes the increase in the average age of the population. But when we include the population changes, the amount of diagnosed illness is projected to increase by 24.2% (1.0% per year). We see that the demographic shift is the more powerful determinant of the projected growth in overall levels of ill health in the population over the next two decades, accounting for almost four-fifths of the anticipated total rise.
Figure 7: Projected changes in the average Cambridge Multimorbidity Score relative to 2019, including and excluding population changes, England, 2019–2040

Source: Analysis of linked health care records and mortality data conducted by the REAL Centre and the University of Liverpool.
Note: The shaded areas represent uncertainty intervals.
Within the growth in overall illness we project a rise in multimorbidity. The average number of conditions that people have increases with age and with projected increases in life expectancy, the number of conditions per person is expected to increase. But we also project that people at a given age have more conditions in 2040 compared with 2019 and that this applies for all age groups as shown in Figure 8.
Figure 8: Average number of Cambridge Multimorbidity Score conditions by 5-year age groups for those aged 30 years and older, England, 2019 and projected for 2040

Source: Analysis of linked health care records and mortality data conducted by the REAL Centre and the University of Liverpool.
Note: The shaded areas represent uncertainty intervals.
People aged 85 years and older are projected to have the largest growth in the number of conditions. In 2019, this group had 5.2 long-term conditions on average and this is projected to increase to 5.7 on average in 2040.
‡‡‡ The ONS assumptions reflect the recent slowdown in mortality improvements. For instance, the projected life expectancy at birth for 2045 is 84.0 years using its current assumptions but was 85.6 years in older projections based on data from 2016.
§§§ The sum of ‘some illness’ and ‘major illness’.
¶¶¶ During this time electronic patient records have improved so it is unclear how much of the increase is driven by better diagnosis or greater prevalence of lower levels of illness. Particularly, reported anxiety and depression has increased rapidly since 2010.
**** A measure reflecting the impact an illness has on quality of life before it resolves or leads to death. YLDs account for the severity of a disability and the time the disability lasts so are typically weighted so that young adult ages are valued higher than infants or the very elderly.
†††† Life expectancy can be expressed in two ways – period life expectancy or cohort life expectancy. Throughout this report, we use period life expectancy, which uses mortality rates for different ages from a single year and assumes that those mortality rates remain unchanged for the remainder of a person’s life. There is no individual who will experience this, but it acts as an approximate summary of life length and lifetime health in a single year. This measure could underestimate life expectancy if, as they have done in the past, mortality rates improve over time.
‡‡‡‡ Office for National Statistics. Dataset – Principal projection – England population in age groups. 2020-based interim edition of this dataset. [Internet]. 2022 [cited 2023 Feb 28]. Available from: www.ons.gov.uk/peoplepopulationandcommunity/populationandmigration/populationprojections/datasets/tablea24principalprojectionenglandpopulationinagegroups.
§§§§ Office for National Statistics. Dataset – Principal projection – England population in age groups. 2020-based interim edition of this dataset. [Internet]. 2022 [cited 2023 Feb 28]. Available from: www.ons.gov.uk/peoplepopulationandcommunity/populationandmigration/populationprojections/datasets/tablea24principalprojectionenglandpopulationinagegroups.
¶¶¶¶ Replacement fertility is the level of fertility required for the population to replace itself in the long term. This level corresponds to 2.1 children per woman
***** Office for National Statistics. Dataset – Principal projection – England population in age groups. 2020-based interim edition of this dataset. [Internet]. 2022 [cited 2023 Feb 28]. Available from: www.ons.gov.uk/peoplepopulationandcommunity/populationandmigration/populationprojections/datasets/tablea24principalprojectionenglandpopulationinagegroups.
††††† The ratios we present are rounded to the nearest whole number: they are 9.7:1 and 6.6:1. A ratio of 9.7:1 implies that there are 0.103 people aged 70 years and older with major illness for every person aged 20–69 years. A ratio of 6.6:1 implies there will be 0.152 in 2040, an increase of 47%.
‡‡‡‡‡ The role of risk factors and their projected trends are discussed in more detail in the next section and in the modelling working paper and the technical appendix.
§§§§§ The projected growth in the average CMS cannot be used to infer growth in heath and care activity or costs. Projections of the funding and resource implications from this model are planned for 2024.
Projections of individual conditions: prevalence of key conditions in England over the next 20 years
Key points
- The prevalence of a given condition increases when the number of people being newly diagnosed is higher than the number of people entering remission or dying. Many of the long-term conditions we analyse currently have no cure, so higher survival rates lead to growing prevalence of illness in the population.
- We project that 19 of the 20 conditions will increase in prevalence by 2040. The exception is coronary heart disease, which has been positively affected by falling smoking rates and changing prescription patterns. In most cases, these increases are mainly driven by population ageing. For example, without population ageing, the prevalence of hypertension is projected to fall 0.6 percentage points by 2040. With population ageing, it is projected to increase by 3.5 percentage points.
- The conditions with the largest percentage point increases in prevalence are hearing loss (4.6), hypertension (3.5), diabetes (3.5) and chronic pain (2.6). The causes of these increases vary for each condition.
- Population growth means that over and above this increased prevalence, there is a further rise in the total number of people diagnosed with illness. Of the conditions that have the largest impact on service use and mortality, the greatest absolute projected increases are for diabetes (1.9 million), chronic pain (1.7 million) and heart failure (1.0 million). We also project over a 30% increase in the number of people living with cancer, COPD or chronic kidney disease.
The past two centuries of progress in public health, medicine and vaccines have meant that most of the disease burden in developed countries is from non-infectious or non-communicable diseases. The COVID-19 pandemic marked a rare event where an infectious disease took many lives, momentarily shifting the demand for care back towards infectious disease. There is a risk of pandemics disrupting health services in the future, but with long life expectancy, the underlying demand from people with non-communicable diseases will persist.
There are hundreds of non-infectious chronic illnesses affecting people in England. In this report we focus on the 20 conditions in the CMS that together contribute to 65% of disability-adjusted life years in England in 2019 and 73% of those due to chronic illness. To understand more about the potential future of illness in England we need to project the prevalence of these conditions, as well as the future demographics of the country.
The future prevalence of each disease depends on the share of the population diagnosed with the condition to begin with, in 2019 in our case, and the change over time. Each year, there will be an inflow into the pool of people with the condition (incidence) and an outflow from that pool, either through remission or death (whether or not this is death from the disease or with the disease). Prevalence will increase if the inflow is greater than the outflow. The age structure of the population can affect inflows and outflows as both incidence and death are age related. As prevalence is the share of the population affected, the total number affected also depends on population size.
For some conditions our modelled risk factors are a major determinant of disease incidence: for type 2 diabetes, coronary heart disease (CHD) and lung cancer, around 70% of new cases are caused by a combination of these individual-level risk factors (eg smoking and obesity) leaving around 30% unexplained (see our modelling working paper, Figure 4.3). For other conditions, a greater percentage of cases are estimated to be caused by other factors: only around a third of new dementia and asthma cases are attributable to our modelled risk factors. And crucially, due to the limitations of linked data and epidemiological research in the area, for more than half of our 20 conditions there is little or no quantitative evidence of a causal relationship with these risk factors. These include chronic pain and anxiety and depression, common conditions that account for a lot of health needs. For more detail on the inclusion of individual-level risk factors in our model see the modelling working paper, section 4 and the technical appendix.
The prevalence of each condition is affected differently by population change
Using the model and projected trends in risk factors, we estimate the amount of new illness (incidence) and the overall rates of illness (prevalence) and how this is affected by population ageing.
Figure 9 shows projected changes in prevalence rates for the 20 CMS conditions over the next two decades, where prevalence is defined as the percentage of the population with the condition. The teal bars exclude the effect of demographic change. The red bars include demographic change and therefore correspond to changes in the prevalence of illness within age groups.
The conditions with the largest overall projected increases (indicated by the red bars) are hearing loss, hypertension, chronic pain and diabetes. Comparing the length of the teal bars with the red bars shows the relative importance of change in the population structure, which is very different for these conditions. For diabetes, around half of the projected rise in prevalence is through greater prevalence at a given age, and half is due to population ageing (as the risk of type 2 diabetes rises with age). By contrast, all the growth in hypertension is due to the changing structure of the population. The teal bar is negative, meaning that if the population had the same structure in 2040, we would project lower rates of hypertension.
For chronic kidney disease, cancer, COPD, dementia and stroke, the teal bars (which exclude demographic change) indicate that change in prevalence is negative or close to zero. This means all the projected growth in prevalence is attributed to change in the population structure. For dementia, this result is consistent with international evidence, as research indicates that age-specific rates of dementia have fallen over time. That is, rates of dementia among 80-year-olds, for example, are lower than they were two decades ago. Increases in life expectancy do, however, mean that there are more older people, increasing the overall number of people diagnosed with the condition.
Coronary heart disease is the only condition where there is a projected fall in prevalence once demographic change is factored in. This condition has strong epidemiological links with smoking and smoking rates have fallen in England in the recent past with this trend projected to continue. In addition, changes in prescription patterns have played a role in reducing age-specific incidence over time. This reduction in prevalence is projected to occur even with population ageing although the fall would be even greater if the population in 2040 had the same age structure as in 2019.
Figure 9: Projected percentage point changes in prevalence rates by condition for those aged 30 years and older, including and excluding demographic changes, England, 2019 and projected for 2040

Source: Analysis of linked health care records and mortality data conducted by the REAL Centre and the University of Liverpool.
Note: The black capped bars represent uncertainty intervals. IBS is irritable bowel syndrome, COPD is chronic obstructive pulmonary disease, TIA is transient ischaemic attack. Cambridge’s definition of ‘alcohol problems’ incorporates both mental and physical conditions associated with alcohol addiction.
Several key conditions are projected to have millions more cases by 2040
The population is projected to grow as well as change in age structure. Higher prevalence therefore implies an increase in the total number of diagnosed cases of individual conditions. This will feed through into a change in the total demand for care. We estimate the total number of people diagnosed with each condition by applying 2019 and 2040 (projected) prevalence rates of individual conditions to the respective populations aged 30 years and older. These estimates are shown in Figure 10, which indicates the projected rise in the numbers of people diagnosed with conditions that have the greatest effect on health care needs and mortality. Among these conditions, the greatest increase is for diabetes, chronic pain and heart failure.
Figure 10: Projected total number of diagnosed cases for the 10 conditions with the highest impact on health care use and mortality among those aged 30 years and older, including demographic changes, England, 2019 and projected for 2040

Source: Analysis of linked health care records and mortality data conducted by the REAL Centre and the University of Liverpool.
Note: Red shaded bars represent uncertainty intervals. COPD is chronic obstructive pulmonary disease.
Many of the conditions exhibiting the largest growth in absolute numbers, such as diabetes and chronic pain, tend to be managed in primary care settings. In the next section we explore how these projected trends in prevalence are determined by relative levels and trends in incidence and mortality. We discuss how low levels of incidence can still result in a large projected increase in the number of people living in ill health.
Levels of illness in the population are determined by incidence and longevity
The projected increase in the level of a particular illness depends on the cumulative difference between inflows, or incidence, and outflows, in the form of remission and death. The larger the gaps between inflows and outflows, the larger the growth in the prevalence of the condition.
Figure 11 compares the rate of inflow, shown by the teal bars, and the major source of outflow, the rate of people dying with each condition in 2019 (excluding population change), shown by the red bars. We do not have information on rates of remission, which would complete the picture on outflows. This means that for conditions with no or minimal remission, the difference between the two bars gives the change in the prevalence of the condition in that year. However, the difference is less meaningful for conditions such as anxiety and depression where remission is common.
To draw out the implications we focus on conditions where remission is absent or minimal, such as dementia and diabetes. For dementia, there is currently no remission and, as shown in Figure 9 in the previous section, the prevalence is not projected to change if we exclude population change. In Figure 11, we see that there is no significant difference between the bars representing incidence and mortality for 2019: the rates of incidence (inflow) and mortality (outflow) are balancing out. By comparison, for diabetes, where remission is also minimal, mortality rates are around half that of incidence rates. This means that prevalence increased in 2019 and is projected to increase to 2040.
With the exceptions of coronary heart disease (falling) and asthma (rising), we project that rates of incidence for each condition will change very little between 2019 and 2040 based on current trends in incidence and risk factors (modelling working paper, section 5). The changes in prevalence presented in Figure 9 are therefore driven by the cumulative difference between deaths/remission rate and the stable incidence rate.
Figure 11: The rate of new cases compared with deaths for people with each condition aged 30 years and older, per head of population, England, 2019, standardised for age, sex and deprivation

Source: Analysis of linked health care records and mortality data conducted by the REAL Centre and the University of Liverpool.
Note: COPD is chronic obstructive pulmonary disease, IBS is irritable bowel syndrome, TIA is transient ischaemic attack.
Figure 12 uses the example of type 2 diabetes to show how the projected change in prevalence (Figure 9) relates to the difference between incidence and mortality. The teal line gives the projected incidence in each year, excluding demographic change. This is projected to remain more or less at the same level over the next 20 years. The red line indicates mortality rates of people with type 2 diabetes. This is projected to increase due to an increase in the average age of the population with the condition. As the population living with type 2 diabetes gets older, their likelihood of dying of any cause (not just type 2 diabetes) increases. Although mortality is increasing, the incidence rate (teal line) is consistently higher than the mortality rate. This is projected to result in a growth in the number of people living with type 2 diabetes (black line). The greater the difference between incidence and deaths (the gap between the teal and the red line), the steeper the black line.
Figure 12: Incidence, mortality (by any cause) and prevalence for type 2 diabetes patients aged 30 years and older, England, 2013–2040 (projected), standardised for age, sex and deprivation

Source: Analysis of linked health care records and mortality data conducted by the REAL Centre and the University of Liverpool.
Figure 12 excludes projected demographic changes. However, as shown in the previous section, the population is projected to be larger and older and this will have implications for health care resources. Figure 13a shows how this translates into changes in the number of people with type 2 diabetes.
Figure 13a: Number of people with type 2 diabetes, England, 2019 and projected for 2040 (excluding and including the effect of demographic changes)

Figure 13b: Number of people with dementia, England, 2019 and projected for 2040 (excluding and including the effect of demographic changes)

Source: Analysis of linked health care records and mortality data conducted by the REAL Centre and the University of Liverpool.
Note: The black capped bars represent uncertainty intervals.
In Figure 12 we showed that the prevalence of type 2 diabetes is projected to increase between 2019 and 2040. By applying prevalence rates by age to the number of people in different age groups in 2019, we see that there were an estimated 3.4 million people with type 2 diabetes. If there was no change to the population size and structure over the next two decades, with the changing prevalence shown in Figure 12, we project 4.0 million people would have type 2 diabetes in 2040. The population is, however, projected to be larger and older – and this could translate into 5.0 million people with type 2 diabetes by 2040.
As a counterexample, shown in Figure 13b, the prevalence of dementia is projected to fall in individual age groups. That is, if there was no change to the population over the next two decades, we project a reduction in the number of people with the condition between 2019 and 2040 from 680,000 to 660,000. The effect of population ageing, however, means that there are projected to be 1.0 million people with dementia in 2040 – an increase of 45%.
How these projections of illness compare with other research findings
Our findings are in line with other projections carried out in the UK and Europe of overall illness. Kingston et al. (2018) project an expansion of morbidity for England, estimating a rise in multimorbidity, especially complex multimorbidity in older age cohorts through to 2035. Milan et al. (2021) model the burden of disease associated with the 10 most common non-infectious diseases for Germany through to 2060, including coronary heart disease, cancer, COPD, dementia, pain and heart failure, under different scenarios of compression and expansion of morbidity. The authors project that, even assuming a compression of morbidity, increases in life expectancy would translate into a significant increase in the burden of disease.
Guzman-Castillo et al. (2017) forecast that the number of older people with care needs will expand by 25% between 2015 and 2025 for England and Wales. They project the prevalence of illness-related disabilities to stay the same or slightly grow within age groups. Their overarching finding is driven by growth in the size of the population of older people.
Our results are also in line with existing projections of the prevalence of specific conditions. Despite a decrease in the projected incidence and age-specific prevalence rates of dementia, Ahmadi-Abhari et al. (2017) project an increase in the number of people with dementia in England and Wales by 2040, as do Wittenberg et al. (2020) in England to 2040, as well as an increase in those requiring palliative care (Etkind et al., 2017).,, Extrapolating current trends, Maddams et al. (2012) also project an increase in the number of cancer cases, for colorectal, lung, prostate, breast and all cancers combined, in England by 2040. Similar projections have been published for England for the number of COPD cases, and for diabetes.
Many studies have explored the changes to health care delivery as a consequence of the changing demand for health care. The REAL Centre’s launch report documented the rapid expansion of elective care services over the past two decades. It showed how the delivery system can change in response to the external drivers of health care demand. The projections we present here reflect a continuation of trends for many of those same drivers.
Research in this area has tried to break down the growing demand for care into its constituent parts, to better understand the growth we have seen.,,, These studies, using emergency care and some planned care settings between 2000 and 2015, found that successive cohorts, once controlling for age and period effects, used less health care.
This is consistent with the increases in healthy life expectancy that have been recorded over the past decades,, and improvements in disability-free years of life after adjusting for age globally. However, as was discussed in earlier sections of the report, longer life typically brings greater multimorbidity: analysis from the Global Burden of Disease data for England showed that between 2010 and 2019, the total years lived with disability was 8.1 million, an increase of 10% from 2010 and 25% from 1990. Further to these findings, a recent review highlights that across multiple countries and in the UK, expansion in morbidity has been brought about by the fact that life expectancy has tended to grow faster than disability-free and healthy life expectancy.
The findings in this report indicate that demographic factors are likely to be the key driver of the growing multimorbidity in the next two decades. The impact of our projections of population health on NHS funding needs is beyond the scope of this report. This analysis of resourcing will be vital and will be covered in subsequent reports in this programme.
How this increase in ill health is managed by the health and care system remains a key question. Negative cohort effects for health care expenditures (ie reducing health care spending for combinations of age and levels of illness) are not incompatible with our findings of an expansion of morbidity. More time spent in ill health may mean less health care need if, despite increases in prevalence, the severity of these conditions reduces, or their management improves (Manton’s dynamic equilibrium hypothesis).
¶¶¶¶¶ These conditions are: dementia, cancer (all types), chronic obstructive pulmonary disease (COPD), atrial fibrillation, heart failure, constipation, epilepsy, chronic pain, stroke/transient ischaemic attack (TIA), diabetes (type 1 or 2), alcohol problems, psychosis/bipolar disorder, chronic kidney disease, anxiety/depression, coronary heart disease, connective tissue disorders, irritable bowel syndrome, asthma, hearing loss and hypertension.
****** These are the 10 conditions with the highest weighted prevalence in 2040. CMS weights for all 20 conditions can be found in the modelling working paper, Table 8.1.
†††††† In our patient records, diagnosis of chronic pain is based on having at least four prescriptions of analgesics or epilepsy drugs (conditional on not having been diagnosed with epilepsy) in the span of a year. This method will likely lead to underdiagnosis, especially given that over-the-counter medication is available without a prescription. There are multiple ways of defining chronic pain, which is commonly identified through surveys. Public Health England, using the Health Survey for England, estimates that the prevalence of chronic pain in 2017 was 34% for people aged 16 years and older and 53% for people aged 75 years and older.
‡‡‡‡‡‡ The full list of our modelled conditions where remission is absent or minimal is atrial fibrillation, chronic kidney disease, COPD, connective tissue disorders, coronary heart disease, dementia, diabetes, epilepsy, hearing loss, heart failure, hypertension, irritable bowel syndrome, psychosis and stroke or transient ischaemic attacks (TIA).
§§§§§§ A measure reflecting the impact an illness has on quality of life before it resolves or leads to death. The years lived with disability account for the severity of a disability and are typically weighted so that young adult ages are valued higher than infants or the very elderly.
Summary and conclusions
Summary
In this report, we project the future trends in illness for the population of England up to 2040. Our projections suggest an expansion in morbidity, with people spending more time in ill health. This is because life expectancy is projected to rise by 1.4 years on average between 2019 and 2040, while the age at which people are expected to be living with major illness is projected to remain unchanged at 70 years old. This would mean, on average, people living additional years with major illness (defined as having a CMS above 1.5) rather than dying. While longer life is on the whole something to be celebrated, it also implies increased demand for health care services.
The expansion in morbidity combined with the change in the size and age structure of the population means that we project an increase of 2.5 million people aged 20 years and older living with major illness by 2040. Most of this rise is driven by demographic changes rather than by expanding morbidity. The total projected rise in the average level of illness, as measured using the average CMS, is 24%.
We then presented projections of the 20 chronic conditions that make up the CMS. We project an increase in prevalence of 19 of the 20 conditions, with the exception of coronary heart disease. In most cases, the increases are driven largely by population ageing rather than a rise in age-specific rates or earlier onset.
The remainder of this section examines some of the implications of our findings, first for the health care system and then for the wider economy and society.
Implications for the health care system
How should the health care system in England respond to the projected increase in morbidity? We briefly discuss some of the options.
A focus on prevention
Prevalence
Primary prevention through reducing the risk factors associated with ill health, such as stopping smoking and maintaining a healthy weight, will delay the onset of many health conditions. It may also make these conditions easier to treat, allowing people to have a better quality of life and live longer, even if they do develop illness. Overall, while some people value some health states as worse than being dead,, this is likely to increase wellbeing. Prevention is therefore key to ensuring that people enjoy the longest and best quality of life possible.
Whether primary prevention results in a compression in morbidity, ie people spend less time in ill health across their lives, is more uncertain. For this to be the case, prevention would need to reduce incidence, or the flow of people into illness, by more than it reduces mortality rates. While this is possible, it is not a given – as new pharmaceuticals and improvements in medical technology are designed to minimise the impact of illness and keep people with ill health alive.
Costs
The implications of primary prevention for health care spending depend both on the impact on the prevalence of ill health and the costs of treating those who develop conditions. There is a large amount of evidence that prevention is hugely cost-effective, offering large increases in length and quality of life for relatively little financial or other investment.,
However, the cost-effectiveness of prevention does not amount to it being cost saving. It may be that a reduction in risk factors does not reduce prevalence because it boosts survival as well as delays onset, but that the costs of treating people are lower because they are healthier. Any reduction on in-year costs would be weighed against a longer life expectancy, which will tend to increase costs over the longer term.
In summary, there are many important reasons to invest in primary prevention. It will almost certainly increase individual and societal wellbeing by increasing life expectancy and quality of life. It may also have beneficial impacts through greater independence and an increased ability to engage in the labour market and care for loved ones that have care needs. The impact of prevention on overall levels of illness and the costs of caring for the population is less clear.
The use of technology and pharmaceuticals
Technological innovation in health care can take several forms ranging from: new drugs, new diagnostic and monitoring equipment, the use of data to streamline models of care and the science of genomics that allows for the development of personalised medicine. These changes can improve prevention and early diagnosis, as well as help patients live better with their illness. However, it is hard to know in advance how this kind of progress will affect these projections.
Prevalence
Technology could affect the future level of illness in two ways. The first is to affect prevalence or the number of people with an illness. Improved diagnostics may mean earlier diagnosis, thus increasing numbers but also making conditions more manageable and (where possible) remission more likely. Over time this could reduce the adverse effects or even prevalence of illness and multimorbidity. Technology can also keep people alive for longer when they are diagnosed with a condition. This will tend to increase prevalence.
The second potential impact of technology is to reduce the effect that diagnosed conditions have on people’s lives. In the context of our research, this means that technology could reduce the weight of the CMS assigned to a particular illness. Although not included in our list of conditions, the most relevant example is HIV/AIDS, which had a very big impact on survival and quality of life in the 1980s and early 1990s but is now a condition people are able to live with for decades. Our analysis assumes that the impact conditions have on people’s lives and health care use remains the same until 2040. We are therefore basing levels of major illness on the 2019 CMS. It may however be that improvements in the treatment of some of our 20 conditions over the next two decades mean the CMS could fall. This means that there may be lower levels of major illness than we project.
Costs
The impact of technological development on costs varies. Some technologies are purely cost saving, allowing the health care system to deliver the same or a similar service at a reduced cost, although these can be few and far between. Instead, many new technologies will offer improved outcomes or treatment experience (for example, reduced side effects). The National Institute for Health and Care Excellence (NICE) evaluates whether these treatments offer a sufficient gain in quality-adjusted life years (QALYs) to justify the expenditure. Improved treatments often come with a higher cost per patient, which has been a driver of health care spending throughout the world. Others may have a lower cost per patient per year, but if the treatment extends life, then the total cost of treating that patient over the course of their life might increase.
It is not possible to give a definitive answer on how future technology will affect costs. However, in 2019 the Topol review concluded that new digital technologies are more likely to improve outcomes and experience rather than save labour. Given the projected demographic shift, technology that can improve labour productivity will be ever more important.
The increase in the levels of illness we project highlights the importance of adopting and spreading technologies that make health services more efficient at delivering current forms of care. New technologies that improve care for patients are to be welcomed. Where these are not cost neutral, it will be important to approve those that offer the greatest value to patients relative to their costs.
Additional spending
Most of the projected increase in levels of major illness by 2040 is the result of changes in the size and age structure of the population. There is therefore a limit to how much improvements in population-level risk factors and effective use of new technologies can contain the costs of meeting increased demand for health care. England, in keeping with all other developed countries, therefore faces a choice between spending more and reducing the quality or scope of what health care services are offered.
Good health is a national asset, with positive implications for quality of life as well as GDP and other measures of societal wellbeing: people place high value on their health and that of their loved ones. Over time, given population ageing and projected economic growth, an overall increase in spending to meet increased health care demand is inevitable. The crucial question is how this is to be funded.
Most European countries, including the UK, offer some form of universal health care system. This is typically either through a social insurance or a taxpayer-funded system such as our own. If these universal systems are not given sufficient funding to meet demand, then it is likely to increase demand for additional or private services. There will still be an overall increase in spending, as people pay out of pocket or for private insurance. However, this would only benefit sections of the population who could afford it. Given our projections of future levels of ill health, the choice is not whether or not more money is spent but how it is spent and who will benefit.
Maintaining universal health care systems in the future will almost certainly mean additional spending. To retain public support, these systems will have to demonstrate that they are making the most effective use of the resources they are given. This again points towards having an effective prevention strategy and using new technology in the most efficient way.
Implications beyond health care
Our results have implications that extend beyond the health care system. Here, we briefly discuss these for other public services, the welfare system and the wider economy. Each area deserves more attention than we can give them in this report, so we will return to explore these themes in future publications.
Other public services
There are direct implications of our projections for social care for older adults. In our 2021 insight report, we showed that the rate of social care need by age has fallen over the past decade while the number of diagnosed conditions has risen. This indicates that people are now able to live independent lives for longer after such a diagnosis. The projections in this report suggest that this trend may continue. The age at which people are expected to be living with major illness is projected to stay the same, while levels of multimorbidity and life expectancy are projected to rise. Therefore, when people do require social care in older age, they will typically have more complex health care needs.
The projections highlight the scale and impact of population change and the baby boomers reaching retirement age. The potential impact on social care can be seen if we focus on the example of dementia, which tends to increase the odds of social care use. The population standardised prevalence of dementia is forecast to fall, consistent with international evidence that age of onset has on average increased. However, as the probability of individuals developing dementia increases with age, the large increase in the number of older people means a rise in the total number of people living with dementia.
The projections also have implications for wider public services, such as social housing and community services.
The welfare system
The growth in the number of older people will increase those who qualify for age-related benefits. The largest of these is the state pension. There are also benefits, such as attendance allowance, where eligibility does not depend on age but receipt is heavily age related. Under the current system, our projections indicate that people would be eligible for these health-related benefits for a longer period of time.
Labour supply and the wider economy
On average, we project that years of additional life expectancy will all be spent with major illness. This has important implications for the extent to which the retirement age can be increased, as major illness is likely to reduce a person’s ability to work. A consultation by the UK government to increase the state pension age to 68 years has recently been paused. There are important inequalities in both illness onset and life expectancy, which make such increases problematic and which will be discussed in a subsequent report. However, even on average, there could be a limit to the extent to which retirement can be delayed much more.
Most of our projected increase in major illness is for those aged 70 years and older, but we still see a projected increase of around 500,000 in the total number of working age people diagnosed with major illness, whose ability to remain economically active may be more limited. It is however important to note that there are and will be some people who do not have major illness and are unable to work, and those who have major illness yet are employed. The relationship between work and health is complex and will require a range of solutions from both the government and employers to ensure those of working age are supported to stay in work if they are able.
In addition to being able to recruit enough health care workers, a major issue for the government will be our ability to pay for the growth in care. Strong economic growth improves the government’s budget for all public services. Fostering a vibrant, healthy, working age population would serve both these purposes. This has implications for migration policy given the shrinking labour market from the domestic working age population.
Looking to the future
The findings of this report provide sobering reading: there is a large projected increase in levels of ill health to 2040 primarily driven by an older population, and this is likely to be expensive. However, these changes are also a testament to progress and a source of optimism. There have been large improvements in life expectancy over the past 100 years, driven by improved living standards, public health interventions and advances in medical technology.
Over the next 20 years, we project on average that additional years of life will all be spent with major health conditions rather than people dying earlier. The purpose of the NHS, other public services and the wider welfare system is not to save money. It is to benefit the lives of the population, while trying to make the most efficient use of available resources. The projections we present in this report highlight the importance of a cross-government, long-term strategy to ensure our society and economy are set up to meet the needs of our changing population.
¶¶¶¶¶¶ Health care financing decisions for treatment are based on quality-adjusted life years (QALY). QALYs is a system that gives a weight to quality of life based on levels of illness. It runs from 0 to 1, with 0 meaning death and 1 meaning full health. Therefore, in our current system, any stage of illness is assumed on average to be preferable to, or at least as good as, death.
References
- Office for National Statistics. UK Population Estimates 1851 to 2014 [Internet]. 2015. 2015 [cited 2023 Feb 28]. Available from: www.ons.gov.uk/peoplepopulationandcommunity/populationandmigration/populationestimates/adhocs/004356ukpopulationestimates1851to2014.
- Office for National Statistics. Dataset – Estimates of the population for the UK, England, Wales, Scotland and Northern Ireland [Internet]. 2022 [cited 2023 Feb 28]. Available from: www.ons.gov.uk/peoplepopulationandcommunity/populationandmigration/populationestimates/datasets/populationestimatesforukenglandandwalesscotlandandnorthernireland.
- Office for National Statistics. How has life expectancy changed over time? [Internet]. 2015 [cited 2023 Feb 28]. Available from: www.ons.gov.uk/peoplepopulationandcommunity/birthsdeathsandmarriages/lifeexpectancies/articles/howhaslifeexpectancychangedovertime/2015-09-09.
- Chernew M, Cutler D, Ghosh K, Landrum MB. Understanding the Improvement in Disability Free Life Expectancy In the U.S. Elderly Population. Cambridge, MA; 2016 Jun.
- Vos T, Lim SS, Abbafati C, Abbas KM, Abbasi M, Abbasifard M, et al. Global burden of 369 diseases and injuries in 204 countries and territories, 1990–2019: a systematic analysis for the Global Burden of Disease Study 2019. The Lancet. 2020 Oct;396(10258):1204–22.
- Roser M, Ortiz-Ospina E, Ritchie H. Life Expectancy [Internet]. Our World in Data. 2019 [cited 2023 Feb 28]. Available from: https://ourworldindata.org/life-expectancy.
- Institute for Fiscal Studies. What does the government spend its money on? IFS spending composition spreadsheet. [Internet]. IFSTaxLab. 2021 [cited 2023 Feb 28]. Available from: https://ifs.org.uk/taxlab/taxlab-key-questions/what-does-government-spend-money.
- Rocks S, Boccarini G, Charlesworth A, Idriss O, McConkey R, Rachet-Jacquet L. Health and social care funding projections 2021. The Health Foundation [Internet]. 2021;1–92. Available from: www.health.org.uk/publications/health-and-social-care-funding-projections-2021.
- Roberts A, Watt T, Gershlick B, Firth Z, Charlesworth A, Johnson P, et al. Securing the future: funding health and social care to the 2030s. 2018 May.
- Office for National Statistics. Dataset – Principal projection – England population in age groups. 2020-based interim edition of this dataset. [Internet]. 2022 [cited 2023 Feb 28]. Available from: www.ons.gov.uk/peoplepopulationandcommunity/populationandmigration/populationprojections/datasets/tablea24principalprojectionenglandpopulationinagegroups.
- Kraindler J, Gershlick B, Charlesworth A. Failing to capitalise: Capital spending in the NHS [Internet]. London; 2019 Mar [cited 2023 Feb 28]. Available from: www.health.org.uk/publications/reports/failing-to-capitalise.
- Shembavnekar N, Buchan J, Bazeer N, Kelly E, Beech J, Charlesworth A, et al. NHS workforce projections 2022 [Internet]. London; 2022 Jul [cited 2023 Feb 28]. Available from: www.health.org.uk/publications/nhs-workforce-projections-2022.
- Lantz PM. Revisiting Compression of Morbidity and Health Disparities in the 21st Century. Milbank Q. 2020 Sep 18;98(3):664–7.
- Tetzlaff F, Epping J, Golpon H, Tetzlaff J. Compression, expansion, or maybe both? Growing inequalities in lung cancer in Germany. PLoS One. 2020 Nov 20;15(11):e0242433.
- Tawiah R, Jagger C, Anstey KJ, Kiely KM. Trends in disability-free life expectancy at age 50 years in Australia between 2001 and 2011 by social disadvantage. J Epidemiol Community Health (1978). 2021 Nov;75(11):1056–62.
- Watt T, Raymond A, Rachet-Jacquet L. Quantifying health inequalities in England [Internet]. 2022 [cited 2023 Feb 28]. Available from: www.health.org.uk/news-and-comment/charts-and-infographics/quantifying-health-inequalities.
- House JS, Lantz PM, Herd P. Continuity and Change in the Social Stratification of Aging and Health Over the Life Course: Evidence From a Nationally Representative Longitudinal Study From 1986 to 2001/2002 (Americans’ Changing Lives Study). The Journals of Gerontology: Series B. 2005 Oct 1;60(Special_Issue_2):S15–26.
- Prus SG. Age, SES, and health: a population level analysis of health inequalities over the lifecourse. Sociol Health Illn. 2007 Mar;29(2):275–96.
- Watt T, Raymond A, Rachet-Jacquet L, Head A, Kypridemos C. A microsimulation model for multimorbidity in England. The Health Foundation; 2023 (www.health.org.uk/publications/health-in-2040).
- Payne RA, Mendonca SC, Elliott MN, Saunders CL, Edwards DA, Marshall M, et al. Development and validation of the Cambridge Multimorbidity Score. Can Med Assoc J. 2020 Feb 3;192(5):E107–14.
- Kypridemos C, Guzman-Castillo M, Hyseni L, et al. Estimated reductions in cardiovascular and gastric cancer disease burden through salt policies in England: an IMPACTNCD microsimulation study. BMJ Open 2017;7:e013791 (doi: 10.1136/bmjopen-2016-013791).
- Gruenberg EM. The failures of success. Milbank Mem Fund Q Health Soc. 1977;55(1):3–24.
- Fries JF. Aging, Natural Death, and the Compression of Morbidity. New England Journal of Medicine. 1980 Jul 17;303(3):130–5.
- Manton KG. Changing Concepts of Morbidity and Mortality in the Elderly Population. Milbank Mem Fund Q Health Soc. 1982;60(2):183–244.
- Raymond A, Bazeer N, Barclay C, Krelle H, Idris O, Tallack C, et al. Our ageing population: How ageing affects health and care need in England [Internet]. London; 2021 Dec [cited 2023 Feb 28]. Available from: www.health.org.uk/publications/our-ageing-population.
- Licchetta M, Stelmach M. Fiscal sustainability analytical paper: Fiscal sustainability and public spending on health. Office for Budget Responsibility [Internet]. 2016;(September). Available from: https://obr.uk/fiscal-sustainability-analytical-paper-published-today.
- Astolfi R, Chern JY, Wan TTH, Begun JW, Term LL, Getzen TE, et al. OECD Health Working Papers No. 59. A Comparative Analysis of Health Forecasting Methods. Strategic Finance. 2012;26(59).
- de la Maisonneuve C, Oliveira Martins J. Public spending on health and long-term care: a new set of projections [Internet]. Paris; 2013 Jun [cited 2023 Feb 28]. (OECD Economic Policy Papers). Report No. 6. Available from: www.oecd.org/economy/growth/Health%20FINAL.pdf.
- Head A, Fleming K, Kypridemos C, Schofield P, Pearson-Stuttard J, O’Flaherty M. Inequalities in incident and prevalent multimorbidity in England, 2004–19: a population-based, descriptive study. Lancet Healthy Longev. 2021 Aug;2(8):e489–97.
- Carreira H, Williams R, Strongman H, Bhaskaran K. Identification of mental health and quality of life outcomes in primary care databases in the UK: a systematic review. BMJ Open. 2019 Jul 2;9(7):e029227.
- John A, McGregor J, Fone D, Dunstan F, Cornish R, Lyons RA, et al. Case-finding for common mental disorders of anxiety and depression in primary care: an external validation of routinely collected data. BMC Med Inform Decis Mak. 2016 Dec 15;16(1):35.
- Institute for Health Metrics and Evaluation (IHME). Global Burden of Disease 2019 – England, all causes. [Internet]. 2019 [cited 2023 Feb 28]. Available from: https://vizhub.healthdata.org/gbd-compare.
- Office for National Statistics. Dataset - Births in England and Wales: summary tables [Internet]. 2023 [cited 2023 Feb 28]. Available from: www.ons.gov.uk/peoplepopulationandcommunity/birthsdeathsandmarriages/livebirths/datasets/birthsummarytables.
- Matthews FE, Stephan BCM, Robinson L, Jagger C, Barnes LE, Arthur A, et al. A two decade dementia incidence comparison from the Cognitive Function and Ageing Studies I and II. Nat Commun. 2016 Apr 19;7(1):11398.
- Ahmadi-Abhari S, Guzman-Castillo M, Bandosz P, Shipley MJ, Muniz-Terrera G, Singh-Manoux A, et al. Temporal trend in dementia incidence since 2002 and projections for prevalence in England and Wales to 2040: modelling study. BMJ. 2017 Jul 5;j2856.
- Kingston A, Robinson L, Booth H, Knapp M, Jagger C. Projections of multi-morbidity in the older population in England to 2035: estimates from the Population Ageing and Care Simulation (PACSim) model. Age Ageing. 2018 May;47(3):374–80.
- Milan V, Fetzer S, Hagist C. Healing, surviving, or dying? – projecting the German future disease burden using a Markov illness-death model. BMC Public Health. 2021 Dec 11;21(1):123.
- Guzman-Castillo M, Ahmadi-Abhari S, Bandosz P, Capewell S, Steptoe A, Singh-Manoux A, et al. Forecasted trends in disability and life expectancy in England and Wales up to 2025: a modelling study. Lancet Public Health. 2017 Jul;2(7):e307–13.
- Wittenberg R, Hu B, Jagger C, Kingston A, Knapp M, Comas-Herrera A, et al. Projections of care for older people with dementia in England: 2015 to 2040. Age Ageing. 2020 Feb 27;49(2):264–9.
- Etkind SN, Bone AE, Gomes B, Lovell N, Evans CJ, Higginson IJ, et al. How many people will need palliative care in 2040? Past trends, future projections and implications for services. BMC Med. 2017 Dec 18;15(1):102.
- Maddams J, Utley M, Møller H. Projections of cancer prevalence in the United Kingdom, 2010–2040. Br J Cancer. 2012 Sep 14;107(7):1195–202.
- McLean S, Hoogendoorn M, Hoogenveen RT, Feenstra TL, Wild S, Simpson CR, et al. Projecting the COPD population and costs in England and Scotland: 2011 to 2030. Sci Rep. 2016 Sep 1;6(1):31893.
- Holman N, Forouhi NG, Goyder E, Wild SH. The Association of Public Health Observatories (APHO) Diabetes Prevalence Model: estimates of total diabetes prevalence for England, 2010-2030. Diabetic Medicine. 2011 May;28(5):575–82.
- Tallack C, Charlesworth A, Kelly E, McConkey R, Rocks S. The bigger picture. 2020 Oct.
- Wittenberg R, Sharpin L, McCormick B, Hurst J. Understanding emergency hospital admission of older people [Internet]. Oxford; 2015 Jan [cited 2023 Mar 1]. Available from: http://eprints.lse.ac.uk/60622/1/__lse.ac.uk_storage_LIBRARY_Secondary_libfile_shared_repository_Content_Wittenberg,%20R_Understanding%20emergency_Wittenberg_Understanding%20emergency_2015.pdf.
- Mason A, Rodriguez Santana I, Aragón MJ, Rice N, Chalkley M, Wittenberg R, et al. Drivers of health care expenditure: final report. CHE Research paper [Internet]. 2019;(169). Available from: www.york.ac.uk/che/news/news-2019/che-research-paper-169.
- Chalkley M, McCormick B, Anderson R, Aragón MJ, Nessa N, Nicodemo C, et al. Elective hospital admissions: secondary data analysis and modelling with an emphasis on policies to moderate growth. [Internet]. Southampton; 2017 Feb [cited 2023 Feb 28]. Available from: www.ncbi.nlm.nih.gov/books/NBK424475.
- Jayawardana S, Cylus J, Mossialos E. It’s not ageing, stupid: why population ageing won’t bankrupt health systems. Eur Heart J Qual Care Clin Outcomes. 2019 Jul 1;5(3):195–201.
- Cutler D, Ghosh K, Landrum MB. Evidence for Significant Compression of Morbidity In the Elderly U.S. Population. Cambridge, MA; 2013 Aug.
- Steensma C, Loukine L, Choi B. Evaluating compression or expansion of morbidity in Canada: trends in life expectancy and health-adjusted life expectancy from 1994 to 2010. Health Promotion and Chronic Disease Prevention in Canada. 2017 Mar;37(3):68–76.
- Spiers GF, Kunonga TP, Beyer F, et al. Trends in health expectancies: a systematic review of international evidence. BMJ Open 2021;11:e045567 (doi: 10.1136/bmjopen-2020-045567).
- Dolan, P. Modeling valuations for EuroQol health states. Medical Care. 1997;35(11):1095–1108.
- MVH Group. The measurement and valuation of health: Final report on the modelling of valuation tariffs. York: Centre for Health Economics, University of York; 1995.
- Neumann PJ, Cohen JT. Cost savings and cost-effectiveness of clinical preventive care. Synth Proj Res Synth Rep. 2009 Sep;(18).
- Owen L, Morgan A, Fischer A, Ellis S, Hoy A, Kelly MP. The cost-effectiveness of public health interventions. J Public Health (Bangkok). 2012 Mar 1;34(1):37–45.
- Topol E. The Topol Review: Preparing the healthcare workforce to deliver the digital future [Internet]. London; 2019 Feb [cited 2023 Apr 25]. Available from: https://topol.hee.nhs.uk.
- Public Health England. Chronic pain in adults 2017 – Health Survey for England [Internet]. London; 2020 Dec [cited 2023 Feb 28]. Available from: www.gov.uk/government/publications/chronic-pain-in-adults-2017.
- Whitehead SJ, Ali S. Health outcomes in economic evaluation: the QALY and utilities. Br Med Bull. 2010 Dec 1;96(1):5–21.
Dedicated to the memory of our colleague Moeez Masroor Subhani and his wife Aimen Rafiq Khan.
Acknowledgements
The authors gratefully acknowledge constructive feedback provided by the following individuals:
- Raphael Wittenberg (Deputy Director and Associate Professorial Research Fellow, Care Policy and Evaluation Centre (CPEC), LSE)
- Ben Jupp (Director of Strategy, NHS England) and the Strategy team at NHS England
- Abbygail Jaccard (Head of Modelling, Office for Health Improvement and Disparities)
- Ashwin Kumar (Professor of Social Policy, Manchester Metropolitan University)
- Martin O’Flaherty (Professor in Epidemiology, University of Liverpool)
We would also like to thank the REAL Centre Oversight Board for their guidance and feedback.
In addition, the authors would like to thank colleagues for their input, support and guidance, with particular thanks to Jennifer Dixon, Hugh Alderwick, Jo Bibby, Patrick South, Adam Briggs, Dave Finch, Charles Tallack, Ruth McConkey, Jay Hughes and George Stevenson. We would also like to thank members of the Health Foundation communications team: Sean Agass, Kate Addison, Tatjana Cvijanovic, Jenny Cockin, Billie Morgan and Pete Stilwell.
Errors and omissions remain the responsibility of the authors alone.
When referencing this publication please use the following URL: https://doi.org/10.37829/HF-2023-RC03