About this briefing
The analysis within this briefing was conducted by the Improvement Analytics Unit, a partnership between NHS England and the Health Foundation. This Health Foundation briefing considers the findings of the analysis.
The briefing looks at the impact of a package of enhanced support for older people living in care homes. The enhanced support was introduced in April 2014 and was developed by Principia, a local partnership of general practitioners, patients and community services that aims to provide better quality of care for people in Rushcliffe in Nottinghamshire, England.
The briefing outlines the enhanced support package, then describes the methods the Improvement Analytics Unit used to derive the linked data used in the analysis, select a matched comparison group, and compare hospital utilisation between the two groups. The briefing describes the results of the analysis and discusses the findings. It concludes by looking at the implications and priorities for future research and improvement activity.
More detail about the methods used is available in an accompanying technical appendix, available from www.health.org.uk/publication/improvement-analytics-unit-analysis-principia
Key points
- The NHS is developing new ways of delivering health care, yet local teams often lack access to the analytical skills they need to judge whether improvements are being made to the quality of the care received by patients. To help meet this need, the Health Foundation has partnered with NHS England to establish the Improvement Analytics Unit. The unit will feed back information on a regular basis to teams participating in transformation programmes in England.
- This briefing represents the first output from the Improvement Analytics Unit. It concerns the impact of providing enhanced support for older people living in 22 care homes in Rushcliffe, and in one care home in a neighbouring area of Nottinghamshire. The enhanced support was developed by Principia, a local partnership of general practices, patients and community services. The package included aligning care homes with general practices, regular visits from a named GP, improved support from community nurses, independent advocacy and support from the third sector, and a programme of work to engage and support care home managers.
- The Improvement Analytics Unit examined the impact of the enhanced support on hospital utilisation using newly developed linked care home and hospital data. Residents of Principia care homes were compared with a matched comparison group, consisting of similar individuals living in similar care homes in comparable areas of England.
- Principia care home residents attended accident and emergency (A&E) departments 29% less often than the matched comparison group, and were admitted to hospital as an emergency 23% less frequently. There was no evidence of an impact on the number of nights a person spent in hospital, elective admissions or outpatient attendances. Residents in the Principia care homes were just as likely to die outside of hospital as matched comparison residents.
- Assuming the two groups were comparable, the most likely explanation of the Improvement Analytics Unit's findings is that they reflect higher quality care for residents of the Principia care homes. The matched comparison group had similar age, gender, health conditions and prior hospital utilisation to the Principia residents, although they may have differed in unobserved ways.
- Before the approaches used are replicated elsewhere, it is important to understand the causes of the lower observed use of emergency care. It is not possible to tell from this analysis what might have been the ‘active ingredient(s)’ leading to the lower rates. This could be related to the enhanced support, some other aspect of care delivery or local context. A process evaluation (looking at the context, implementation and how the package might have impact) would help to identify the active ingredients.
Introduction
To improve patient outcomes in an increasingly challenging financial climate, the NHS is developing new ways of delivering care. Some of these initiatives require cross-organisational working, blurring traditional distinctions between primary, secondary, physical health, mental health and social care.
To be effective, improvement efforts require access to robust and timely information on the differences that changes are making to the quality of the care provided to patients. Unfortunately, local teams often lack access to the analytical skills and data they need to judge whether improvements are being made. To help meet this need, the Health Foundation is partnering with NHS England to establish the Improvement Analytics Unit. The new unit is working with local teams in England that are participating in national transformation programmes, and feeding back information on progress against key metrics related to the quality and efficiency of health care.
The ambition is to establish the Improvement Analytics Unit as a resource within the NHS. It began with two initial pilots to test the technical feasibility of the approach to linking data and selecting control groups. This briefing is the first output and considers the impact of providing enhanced support to people living in care homes in the NHS Rushcliffe Clinical Commissioning Group (CCG) area. Since it was not possible to randomise individuals to alternative interventions, comparisons were made against retrospectively matched control groups. The analysis was conducted jointly by the Health Foundation and NHS England. This briefing is authored by the Health Foundation and considers the findings of the analysis.
While the analysis provides useful information regarding the effect of enhanced support for care home residents in Rushcliffe, ultimately the greatest value will come from combining the quantitative evidence from the Improvement Analytics Unit with other evidence, such as from qualitative evaluation, to guide the progress of new models of care or other projects as they evolve. Thus, in the longer term, initiatives like the Improvement Analytics Unit might form one part of a wider approach to ‘rapid-cycle evaluation’, in which qualitative and quantitative information is combined with quality improvement skills to enable ‘course correction’ in a more timely manner than has been possible before now.
Enhanced support for people living in care homes
Principia is a local partnership of general practices, patients and community services that aims to provide better quality of care for people in Rushcliffe in Nottinghamshire, England. Established as a community interest company in 2006, it serves a population of just under 125,000.
From April 2014, Principia introduced an enhanced support package for care home residents. This was offered in all 22 care homes in Rushcliffe caring specifically for frail older residents. It was also offered in two care homes for frail older residents in neighbouring areas that were under the care of a general practice within the CCG covering Rushcliffe.
Principia’s approach relies on a multidisciplinary team where all stakeholders are engaged and working together, taking joint responsibility for the care and wellbeing of the care home residents. It consists of several elements (for more details see Box 1).
- Alignment between general practices and care homes. Previously, care homes contained residents who were registered with multiple general practices, with implications for quality improvement efforts as well as the coordination of care for individual patients. Although care home residents still have a choice of general practitioner (GP), efforts have been made to encourage them to register with aligned general practices using advocacy, as described in the next point.
- Advocacy and independent support. This was delivered by Age UK Nottingham and Nottinghamshire (Age UK Notts) and aimed to supply independent information to residents and their families about changing to the aligned local general practice after moving to the care home. More generally, it aimed to provide a safe and trusted point of contact.
- Enhanced specification of general practice care for frail older people living in care homes. For example, each care home had a named GP, who visited the home on a regular basis, meeting with the residents who were registered with the aligned general practice and proactively reviewing their medications and care plans.
- Improved support from community nurses for nurses employed within care homes. This included peer-to-peer support, training courses and signposting to existing specialist community services. Community nurses accompanied GPs on the regular resident review rounds.
- A programme of work to engage and support care home managers. For example, meetings between the care home managers and the CCG have aimed to improve relationships between care providers working in different settings, promoting shared ownership and consistency of approach. The programme also included a care home managers’ network, facilitated by Age UK Notts.
The overall aim was to improve the residents’ care, including the degree to which they were involved in decisions about their care, and their quality of life. There were specific aims to reduce secondary care utilisation, including the numbers of accident and emergency (A&E) attendances and emergency hospital admissions. There are several possible mechanisms through which this might plausibly have been achieved. For example, the enhanced support might have improved the management of health conditions, enabled earlier detection of deteriorations in health or care, or improved decision making from the care home staff regarding when to seek emergency health care.
From April 2015, Principia was chosen as a vanguard site for the New Care Models programme that followed from the NHS Five year forward view. The programme supports the improvement and integration of services in England, and has established several different types of vanguard. Principia has formed one of these – a multispecialty community provider (MCP) – with the aim to ‘facilitate more integrated working between services and promote a culture of mutual accountability for improving patient experience and outcomes.’ The enhanced support package for care home residents is seen as an important component of Principia’s MCP, although the package shares features with another type of vanguard – enhanced health in care homes.
Box 1: An overview of Principia’s enhanced support package
The enhanced specification of general practice care was enabled by aligning care homes with general practices. It included: reviews of new residents within five days of moving to the care home and comprehensive geriatric assessments within two weeks; weekly or fortnightly visits to the care homes to review residents, with proactive reviews of medication and efforts to standardise the care of people with long-term conditions; increased detection of dementia through assessments of new residents and ongoing monitoring; increased partnership working between general practices, community staff and care homes to improve the consistency of the care provided by a multidisciplinary team. As well as improving direct care for individual patients, the continuity of relationship between GPs and care homes may have enabled broader problems with care delivery to be detected sooner and addressed more effectively.
The advocacy and independent support, delivered by Age UK Notts and supported by volunteers, aimed to supply independent information to residents and their families on changing to the aligned general practice after moving to a care home; and more generally, provide a safe and trusted point of contact. One initiative (the ‘worry catcher’) aimed to create a safe space for residents and their families to raise any issues or concerns.
The improved community nursing support included peer-to-peer support to nurses employed within care homes, as well as training in areas such as continence, catheter management, wound care, end-of-life care and the identification and treatment of pressure sores. Community nurses accompanied GPs on the regular resident review rounds. They also assisted care home staff in navigating the local health and social care system, making them more aware of specialist teams, such as a new falls specialist, and the medicines management pharmacist.
The programme of work to engage care home managers included independent facilitation (by Age UK Notts) for the existing care home managers’ network, and meetings between the care home managers and the CCG throughout the year. The aim was to give care home managers a voice and a point of contact within the multispecialty community provider, and promote shared ownership from all partners in the changes being made to care delivery.
Approach to this analysis
The Improvement Analytics Unit examined the effect of the enhanced support on the residents of 23 participating care homes, including one of those outside of the Rushcliffe area. The analysis focused on people who moved to these care homes between August 2014 and July 2016 when aged 65 or over. For shorthand, we refer to these people as ‘Principia residents’.
The Improvement Analytics Unit examined whether the enhanced support affected the hospital use of care home residents, including the number of A&E attendances and emergency hospital admissions. The use of hospital care by Principia residents was compared with a ‘control’ group of individuals, matched on a range of factors as outlined in the ‘Selecting a comparison group’ section. Both groups were followed up for as long as possible after admission to the care home.
* We excluded one of the two care homes from outside of Rushcliffe since only half of its residents received enhanced support under a Principia-led general practice.
Data and linkage
Obtaining access to linked data has been a recurrent challenge when evaluating integrated care initiatives like Principia’s enhanced support. By their very nature, these initiatives involve practitioners working together across organisational boundaries, but the data on hospital, general practice, community and social care are held separately and are not usually linked. To conduct this analysis, we needed to find a way to follow individuals as they moved between care homes and hospitals, while maintaining patient confidentiality. The situation was complicated by the need to include residents who paid for their care home stay themselves, without local authority support, since they are still eligible to receive the enhanced support, yet might not feature in local authority databases.
The Improvement Analytics Unit has access to pseudonymised data from the Secondary Uses Service (SUS) – a national, person-level database that is closely related to the widely-used Hospital Episode Statistics (HES). SUS contains information on A&E attendances, inpatient admissions and outpatient appointments that are funded by the NHS in England, but unfortunately it does not record accurately whether an individual resides in a care home. Therefore, the unit needed a new database containing information on the residents of care homes, and a method of linking that data to SUS.
The care home resident database was assembled by a team at the Arden & Greater East Midlands Data Services for Commissioners Regional Office (Arden & GEM DSCRO). The process began with extracts from the National Health Applications and Infrastructure Services (NHAIS) database, which contains information on all registrations with general practices in England. The data in question were monthly snapshots, containing a list of individuals registered at each general practice, including their residential address and NHS number. The addresses from these NHAIS extracts were cross-referenced with a database of care homes obtained from the Care Quality Commission (CQC). This enabled the Arden & GEM DSCRO to construct a merged database containing individuals who moved into care homes, based on whether they changed their recorded address to one that matched the location of a care home. The database covered care home stays that began between August 2014 and July 2016. It included the month during which the individual moved into the care home and (where applicable) the month during which they left and the reason for leaving (ie, whether they had moved elsewhere or died). The merged database also contained some limited information about the care home itself, such as whether it offered nursing care in addition to residential care, and how many beds it contained.
The database of care home stays was pseudonymised before it was transferred to the Improvement Analytics Unit. This meant that names, addresses and full dates of birth were removed, and the NHS number replaced by a linkage key. That key was used to link the database of care home stays to the SUS data that the Improvement Analytics Unit already held. The linked care home and hospital data were analysed within an accredited secure data environment based at the Health Foundation. The overall approach to information governance was scrutinised by the project Oversight Group and information governance experts at NHS Digital. The Data Access Advisory Group at NHS Digital recommended that the data be provided for this project. At no point did the Improvement Analytics Unit have access to identifiable data. Throughout, the minimum amount of data was used.
The process resulted in a truly unique database, containing the hospital histories of every care home resident in the selected areas. At a time when information about the quality of care offered to care home residents can be lacking, the database provides valuable insights. To give one example, Figure 1 shows how often care home residents were admitted to hospital each year for certain conditions. The rationale of looking at admissions is that, for some conditions, such as fractures and sprains, admissions are often preventable (see Box 2). In other cases, such as pneumonia, admission rates might be reduced by making improvements to the care offered. Therefore, the linked data sets can be revealing as to the quality of care offered to care home residents.
Figure 1: Rates of hospital admissions for care home residents per year
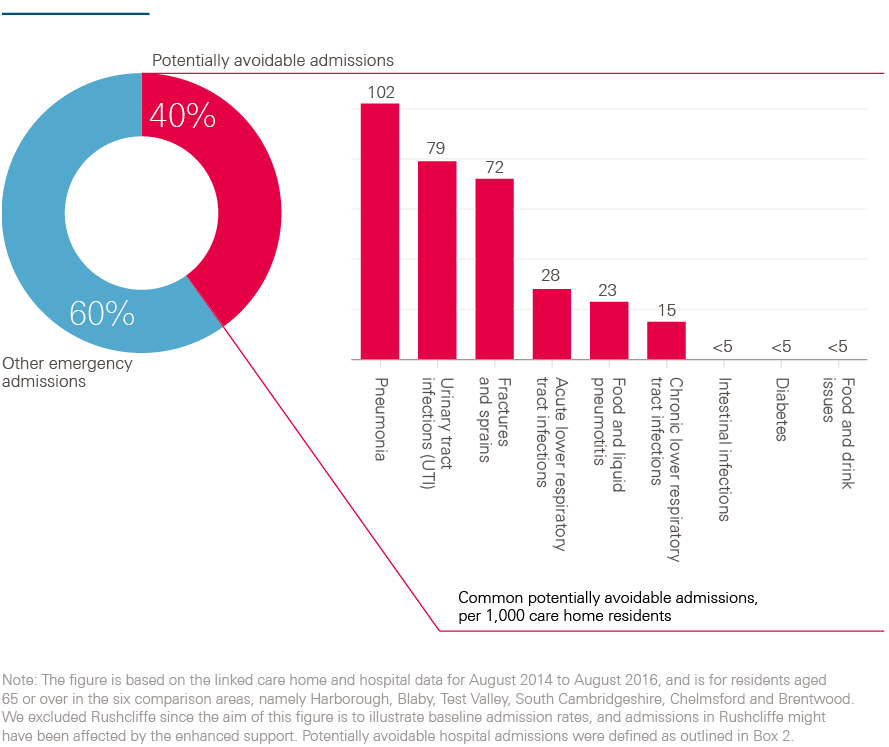
Box 2: Conditions for which we considered emergency admissions to be potentially avoidable
The analysis included conditions that are often manageable, treatable or preventable in community settings without the need to go to hospital, as well as those that may be caused by poor care or neglect. These conditions were:
- acute lower respiratory tract infections, such as acute bronchitis
- chronic lower respiratory tract infections, such as emphysema
- diabetes
- food and drink issues, such as abnormal weight loss and poor intake of food and water, possibly due to neglect
- fractures and sprains
- intestinal infections
- pneumonia
- pneumonitis (inflammation of lung tissue) caused by inhaled food or liquid
- pressure sores
- urinary tract infections.
To calculate the number of potentially avoidable emergency admissions, the Improvement Analytics Unit counted admissions with one of these conditions as the primary diagnosis for the first consultant episode of the hospital spell. Note, however, that this list of conditions was originally intended to be applied to the general population aged 65 or over, rather than to care home residents. Within the timeframe of this study, it was not possible to validate the appropriateness of these conditions for the care home population. Sometimes individuals need to be admitted to hospital for these conditions, regardless of the quality of the care offered. The metric is not perfect but we would expect the enhanced support to have greater impact on admissions for these conditions than others.
† Pseudonymised data sets have been stripped of identifiable fields, such as name, full date of birth and address. However, a unique person identifier (such as NHS number) has been replaced with a random identifier. The scrambled version of that field is used as the ‘key’ to link data sets together. For this analysis, the scrambled version of the NHS number was used to link together hospital records for the same individual over time.
‡ Except for December 2014 (see technical appendix for details: www.health.org.uk/publication/impact-enhanced-support-rushcliffe).
§ For example, rather than using national data, the work was restricted to certain local areas (see ‘Selecting a comparison group’).
Identifying the Principia residents
The study was focused on individuals who:
- moved into a Principia care home (including one from outside the Rushcliffe area) that cared specifically for frail older residents between August 2014 and July 2016
- were not previously residents of care homes (as far as we could detect in our data)
- were aged 65 years or over
- experienced an inpatient admission to hospital within the two years before moving to the care home.
Although the enhanced support was introduced in April 2014, the study only examined people who moved into a care home from August 2014. This was partly because the NHAIS extracts began in August 2014, but we were also aware, from our conversations with Principia, that it took several months for the enhanced support to become fully operational. Thus, the approach allowed for a five-month ‘bedding in’ period for the intervention.
Individuals without a history of inpatient admissions were excluded as we lacked the information on their health conditions that was needed to select a comparison group. We included residents regardless of whether they changed to the aligned general practice, since they may have benefited from the enhanced support regardless. This meant we examined 588 residents from 23 care homes that participated in the enhanced support programme.
Selecting a comparison group
Rushcliffe had relatively low rates of hospital admission before the enhanced support was introduced. Across the entire population (not just care home residents), in 2013/14, there were 776 emergency admissions for every 10,000 individuals living in Rushcliffe, compared with 891 for the average local authority in England. Compared with other areas of England, Rushcliffe also had relatively low levels of socioeconomic deprivation and low population density. Therefore, the Improvement Analytics Unit selected comparison residents from areas that had similar demographic and socioeconomic characteristics and emergency admission rates to Rushcliffe: Harborough, Blaby, Test Valley, South Cambridgeshire, Chelmsford and Brentwood. To the best of our knowledge, none of these were offering area-wide interventions like Principia’s enhanced support during the period concerned. The technical appendix contains more information on how the areas compared with Rushcliffe.
We applied the same inclusion and exclusion criteria to care home residents in the six comparison areas as we had to Principia residents. This produced a total of 2,957 residents aged 65 years or over from 93 care homes. From that wider group of care homes and residents, a matched subset of care homes and residents was identified that was similar to the Principia group on the following characteristics.
- Care home characteristics: The number of beds in the care home; whether the care home was registered with the CQC as a nursing or residential home; whether the care home was registered as caring for additional population groups in addition to older people; whether the care home was in a rural or urban setting; the socioeconomic deprivation level of the local area.
- Resident characteristics: Age; gender; ethnicity (white or non-white); particular health conditions associated with frailty (such as cognitive impairment, falls or significant fractures); particular health conditions that have been shown to be predictive of emergency hospital readmissions (such as chronic pulmonary disease and congestive heart failure); an index based on conditions that predict subsequent mortality (the Charlson index); and the number of emergency admissions, potentially avoidable admissions, nights in hospital, A&E attendances, elective admissions and outpatient attendances prior to moving to the care home.
The matched comparison residents were selected using genetic matching, which is a computer-intensive search algorithm that often produces more closely balanced groups than other methods. The approach ensured that the Principia and matched comparison residents moved into care homes at similar points in time, without seasonal differences in those admission dates.
We selected one matched comparison resident for each Principia resident, giving us 588 residents in the comparison group from 64 care homes.
¶ These figures have been standardised for age based on the indirect method. The technical appendix contains more data on Rushcliffe and the comparison areas. See www.health.org.uk/publication/impact-enhanced-support-rushcliffe
** The technical appendix contains more information regarding how these variables were defined. See www.health.org.uk/publication/impact-enhanced-support-rushcliffe
†† The matching was done with replacement, meaning that a single comparison resident might be matched to more than one Principia resident. The group of 588 matched comparison residents consisted of 422 unique people.
Impact measures
Once the Improvement Analytics Unit was content that the matched comparison group was similar to the Principia residents, the unit proceeded to compare how often residents used hospital care. The following seven impact measures were assessed.
- Attendances at A&E departments (which might not result in a hospital admission).
- Emergency admissions (occurring through A&E departments, or via direct and urgent referrals from GPs and other health care professionals).
- The subset of ‘potentially avoidable’ emergency admissions, based on a list of conditions considered to be manageable in community settings or preventable through good quality care (see Box 2).
- Elective admissions.
- Outpatient attendances.
- The number of nights spent as a hospital inpatient, following either an emergency or elective admission. We expressed this as a percentage of the total length of stay in the care home, and excluded admissions where the person was admitted and discharged on the same day.
- The percentage of deaths that occurred outside of a hospital. We included this metric because the enhanced support included an element of end-of-life planning.
Hospital utilisation was measured for the period during which individuals were resident in care homes, counted from the month during which they moved into the care home to the month they departed. We tracked hospital utilisation until August 2016, so the analysis considered between 1 and 23 months of utilisation, depending on when the person joined (and left) the care home. On average, we followed Principia residents for 211 days (standard deviation 178 days), and matched comparison residents for 201 days (standard deviation 177 days).
Comparisons between the Principia residents and the matched comparison group were made using multivariable regression. The regression models were not strictly necessary, since the matched comparison and Principia residents already had similar baseline characteristics. However, some small differences remained even after matching, and the regression models adjusted for those. Matching and regression generally perform better in combination than separately. The regression models produced a ‘best estimate’ of the relative difference in hospital utilisation between the Principia residents and the matched comparison group, together with a 95% confidence interval.
The analysis was conducted in line with a statistical analysis plan, which was discussed with a Technical Advisory Group and finalised before the data analysis began.
‡‡ We included attendances at specialty A&E departments and minor injury units as well as major A&E departments. However, for this population, virtually all the A&E activity occurred in major departments.
§§ For the number of A&E attendances, emergency admissions, potentially avoidable emergency admissions, elective admissions and outpatient attendances, the models produced ‘rate ratios’. For the percentage of nights spent in hospital and the percentage of deaths that occurred outside hospital, the estimates refer to a slightly different quantity, namely odds ratios.
¶¶ There were some minor deviations from the statistical analysis plan, for example, in the covariance structure assumed in the regression modelling. These are unlikely to have had a qualitative impact on the findings. Full details are available on request.
Results
After matching, the matched comparison group was similar to the Principia residents across the range of individual and care home characteristics considered. Full information is available in the technical appendix, but for example Principia residents were aged 85.9 years on average, compared with 86.6 years for the matched comparison group. The two groups also had a similar profile of health conditions (see Figure 2). For example, 53% of both Principia and matched comparison residents were recorded as having dementia, while mobility problems were noted for 25% of the Principia residents and 21% of the matched group.
Figure 3 shows trends in hospital utilisation. The left-hand side of each chart shows that the Principia and matched comparison residents experienced similar rates of hospital activity before moving into care homes. This is to be expected due to the matching process. However, some differences still existed for elective admissions and outpatient attendances. The right-hand side shows that, following moving to the care home, the Principia residents appeared to use less hospital care than the matched comparison group for certain types of hospital activity. The regression modelling aimed to quantify how different these patterns were, when adjusting for the residual differences between the two groups in prior hospital use, as well as other baseline characteristics.
After moving to a care home, Principia residents experienced 0.74 A&E attendances each year on average, compared with 1.02 for the matched comparison residents. After regression adjustment, Principia residents attended A&E departments 29% less often than the matched comparison group. The 95% confidence interval suggested a relative difference in the range 11% to 43% (see Table 1).
Therefore, notwithstanding statistical uncertainty, it seemed that the Principia group experienced fewer A&E attendances than the matched comparison group.
Figure 2: Percentage of Principia and matched comparison residents with certain health conditions
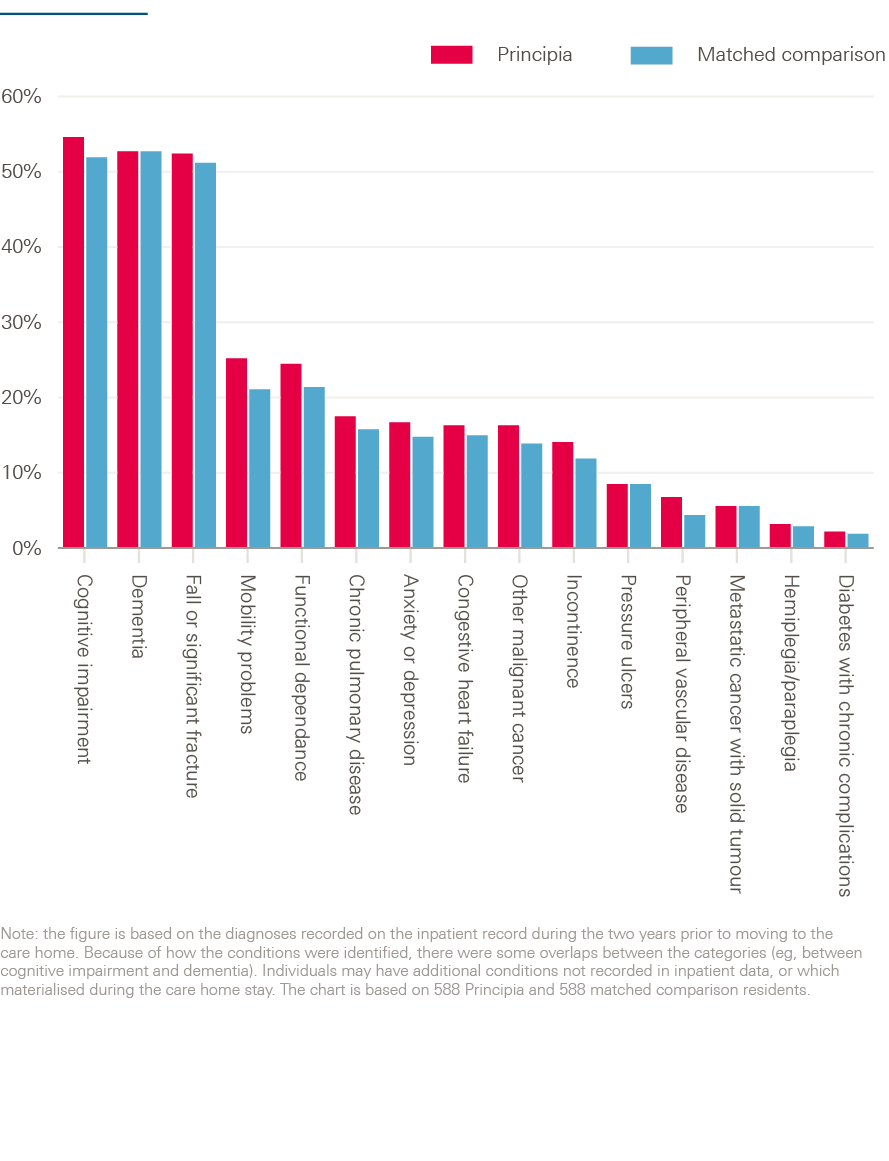
Figure 3: Number of hospital contacts per quarter for the Principia and matched comparison residents
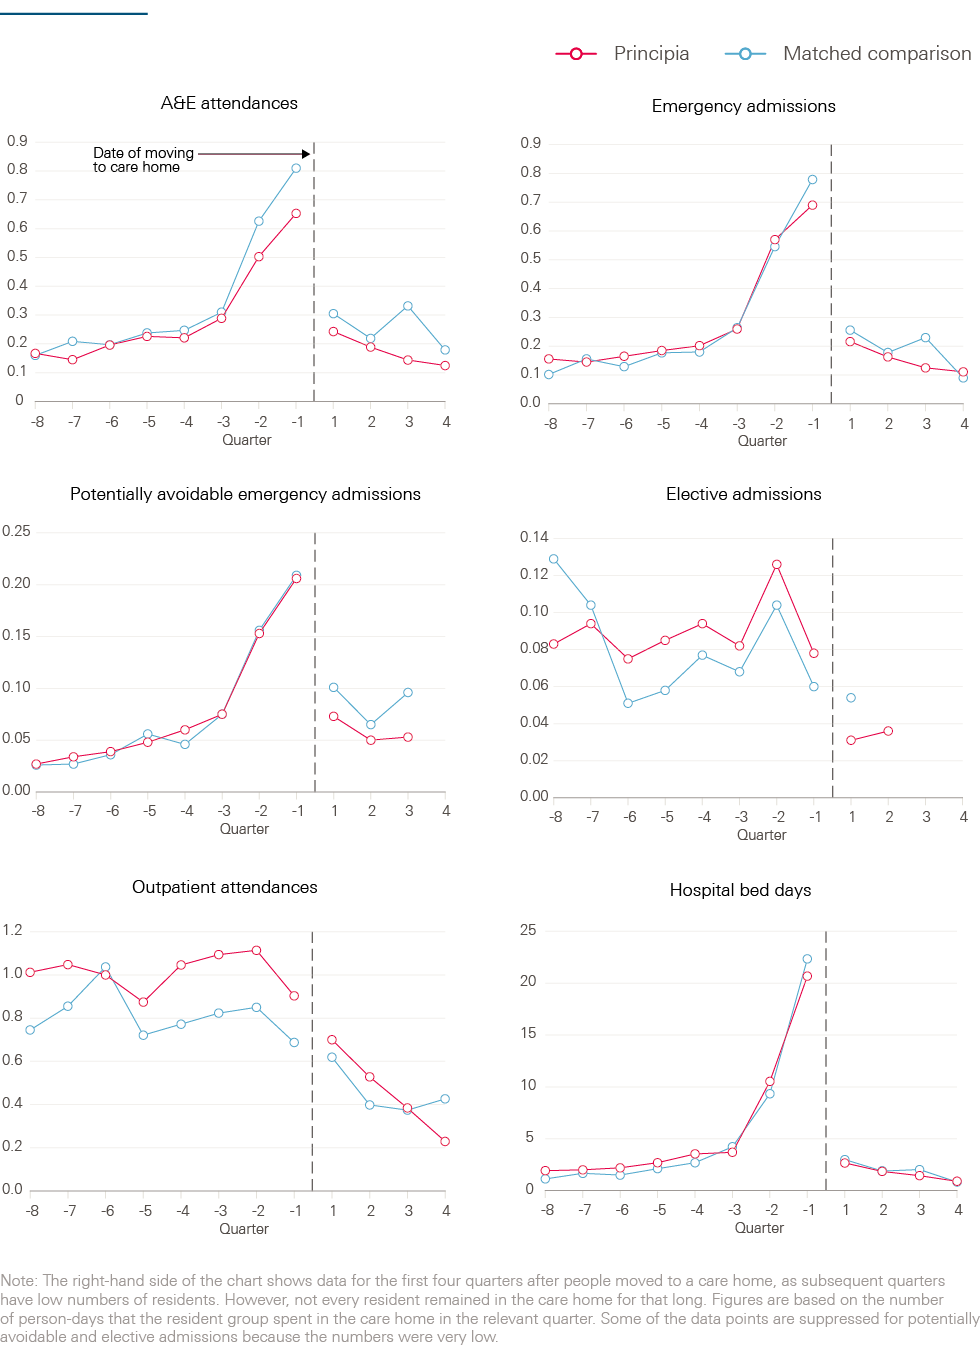
Table 1: Hospital utilisation among Principia and matched comparison residents
|
Crude rates Principia residents (number per person per year) |
Crude rates matched comparison residents (number per person per year) |
Relative difference from matched comparison group (adjusted rate ratio) |
95% confidence interval |
p-value |
|
|
A&E attendances |
0.74 |
1.02 |
29% lower |
11% to 43% lower |
0.002 |
|
Emergency hospital admissions |
0.64 |
0.78 |
23% lower |
3% to 39% lower |
0.024 |
|
Potentially avoidable emergency hospital admissions |
0.22 |
0.30 |
28% lower |
0% (no difference) to 49% lower |
0.052 |
|
Elective hospital admissions |
0.11 |
0.13 |
29% higher |
36% lower to 163% higher |
0.445 |
|
Outpatient appointments |
1.99 |
1.85 |
11% higher |
12% lower to 40% higher |
0.372 |
Note: this table compares hospital utilisation in the period following moving to a care home. It is based on an average length of stay of 211 days (standard deviation 178 days) among the Principia residents, and 201 days (standard deviation 177 days) for the matched comparison group. For this Table and Table 2, we excluded residents who remained in a care home for under one month, and thus studied 568 Principia residents and 565 matched comparison residents. The adjusted rate ratios were obtained by applying regression models to the matched data. Note that, following adjustment, the Principia group experienced more elective admissions than the matched comparison residents, even though the unadjusted rate was lower. Since the confidence interval was very wide, our analysis for elective admissions was inconclusive.
The Principia group experienced an average of 0.64 emergency admissions per person for each year in the care home, compared with 0.78 for matched comparison residents. After adjustment, Principia residents experienced 23% fewer emergency admissions than the matched comparison group. The 95% confidence interval spanned 3% to 39% so, again, it seemed that there were fewer emergency admissions for Principia residents than the matched comparison group.
Principia residents experienced 0.22 potentially avoidable admissions per person per year, compared with 0.30 for matched comparison residents. After adjustment, there were 28% fewer potentially avoidable admissions among the Principia group. This is, proportionately, a greater change than detected for all emergency admissions (28% compared to 23%), but greater uncertainty existed in the figures for potentially avoidable admissions. For these, the 95% confidence interval spanned 0% (no difference) to 49% fewer admissions. As a result, it was not possible to be confident that the Principia group experienced fewer potentially avoidable admissions than the matched comparison residents.
There was no evidence for a difference in elective admissions and outpatient attendances. On average, the Principia residents spent 3.2% of nights as a hospital inpatient (see Table 2), compared with 4.1% for the matched comparison group. Although Principia residents had 14% lower odds of being an inpatient on any given day, there was substantial uncertainty, with a very wide confidence interval that included the possibility of there being no difference or Principia residents having higher odds. Therefore, it is not possible to conclude that the two groups differed in terms of nights spent in hospital. Also, during the period examined, around one-third of each group of residents died. Among Principia residents, 81.5% of deaths occurred outside of hospital, compared with 83.5% for the matched comparison group. However, after adjustment, Principia residents had 7% greater odds of dying outside of hospital than the matched comparison group, but the confidence interval was very wide and again the analysis was inconclusive.
Table 2: The percentage of nights and deaths experienced in hospital
|
Crude rates Principia residents (number per person per year) |
Crude rates matched comparison residents (number per person per year) |
Relative difference from matched comparison group (adjusted odds ratio) |
95% confidence interval |
p-value |
|
|
Percentage of nights during which the person was an inpatient at hospital |
3.2 |
4.1 |
14% lower |
43% lower to 29% higher |
0.469 |
|
Percentage of deaths that occurred outside of hospital |
81.5 |
83.5 |
7% higher |
47% lower to 115% higher |
0.851 |
Note: The adjusted odds ratios were obtained by applying regression models to the matched data. Following adjustment, the Principia group was more likely to die outside of hospital than the matched comparison group, even though a smaller percentage of them died outside of hospital. Our analysis for both metrics was inconclusive, due to the wide confidence intervals.
*** A confidence interval shows some of the uncertainty in the results. Although our best estimate is that the Principia residents attended A&E departments 29% less often than the matched comparison group, the actual difference might lie in the interval from 11% to 43%. There is only a very small (5%) probability that actual difference was higher than 3% or lower than 39%.
Interpretation of the findings
Older people living in care homes that participated in the enhanced support programme attended A&E departments 29% less often than a matched comparison group (95% confidence interval: 11–43%), and were admitted to hospital as an emergency 23% less frequently (95% confidence interval: 3–39%). These findings require careful interpretation, informed by a discussion of the strengths and limitations of the analysis.
In the absence of randomisation, residents of the participating care homes were compared with a retrospectively matched comparison group. These two groups had similar age, gender, health care conditions and previous hospital utilisation, and they lived in care homes that were similar in terms of size and provision of nursing care. Moreover, the matched comparison residents lived in local authority areas that were comparable to Rushcliffe in terms of demographic and socioeconomic characteristics and historic, per capita rates of emergency hospital admission. Notwithstanding these similarities, unmeasured differences may have existed between the Principia residents and the matched comparison group, for example in the availability of informal care support or local authority funding. Also, although we ensured that the comparison areas had similar overall emergency admission rates to Rushcliffe, we could not assess whether they had similar levels of admissions from care homes in the period running up to the introduction of the Principia enhanced support in April 2014. These unmeasured differences might explain some or all of the difference we observed in the utilisation of emergency care. However, although we cannot be definitive, some reassurance is available. For example, the Principia and matched comparison groups had similar mortality rates, lending support to the notion that neither group had more severe health conditions than the other. In fact, the two groups appeared similar even before matching, which might mean there was limited scope for bias through unobserved variables. More information is available in the technical appendix.
If the lower use of emergency care does not reflect differences in the characteristics of the individuals, care homes or areas, then the most likely explanation is that it reflects the care provided to care home residents. However, we could not determine definitively whether the enhanced support produced the lower levels of emergency care utilisation, or some other innovation in care delivery. Here, it would help to have data on admissions from care homes before April 2014. This would enable comparisons to be made between new residents in Principia care homes and people who moved to the same care homes earlier, before the start of the enhanced support, in a ‘difference-in-difference’ style analysis. Such analysis would reveal whether the reductions in emergency care utilisation occurred at the same time as the introduction of the enhanced support, potentially leading to stronger evidence about attribution.
It would also be helpful to combine quantitative with qualitative evaluation. Based on our own discussions with Principia, we have described the enhanced support as including regular visits from a named GP, improved support from community nurses, independent advocacy and support from the third sector, and a programme of work to engage and support care home managers. However, we could not observe how these elements operated in practice, or examine the mechanisms through which the enhanced support might have interacted with contextual factors to produce the lower rates of A&E attendance and emergency admission. Such insights would be helpful because complex interventions such as these often evolve over time in response to experience and changing priorities and needs. Understanding these dynamics is important when considering whether to replicate the enhanced support, since the effects might be different in other contexts. Certain elements of the enhanced support package may be more significant determinants of emergency care utilisation than others.
The effect of the enhanced support package might vary according to the characteristics of the residents involved. By using linked data sets, the Improvement Analytics Unit could examine both local authority and privately funded residents. However, the analysis was restricted to residents aged 65 or over who moved to a care home following the introduction of the enhanced support. Therefore, it did not consider impacts on existing residents. Furthermore, the unit considered only people who experienced at least one inpatient hospital admission in the two years before moving to the care home.
This analysis focused on hospital care. This is an important consideration for people with social care needs, who report fragmentation in services, with frequent handovers between care teams often leading to duplication and confusion. However, lower admission rates do not always indicate better patient outcomes and lower cost. Therefore, further analysis is needed regarding impacts on clinical metrics, patient outcomes and the cost of care (which should include the cost of providing the enhanced support to care home residents). Further data linkage, beyond that already performed, might provide a fuller picture. This could draw on information recorded by local authorities when assessing individuals for social care support, or on clinical diagnostic data recorded in the primary care electronic medical record. Ideally, digitally mature health and social care systems would begin to record the outcomes reported by individual service users on a routine basis – this information could then inform improvements to service delivery, as well as direct care. Qualitative studies might also explore the perceptions and experiences of care home residents, their families, and health and social care practitioners.
Implications and priorities for future work
Since a single evaluation can only provide so much information, the findings need to be seen within the broader literature. Unfortunately, there are not many other studies to draw on. In 2014, a systematic review was published that summarised the evidence on approaches to reduce acute hospital admissions from care homes. It found only 11 studies. Several of these examined geriatric specialist services, often using comprehensive geriatric assessment., Others examined ways to structure and standardise clinical practice, for example by eliciting and recording preferences for future treatment,,, identifying residents whose goals and preferences are consistent with hospice care, improving the detection and management of pneumonia,, and improving the management of chronic obstructive pulmonary disease. While some of the individual studies found reductions in acute admissions, the systematic review concluded that the evidence was of low or very low quality.
Some insights are available from a previous Health Foundation-funded initiative. In the Safer Clinical Systems programme, a team used techniques adapted from high-risk industries to try to reduce readmission rates from care homes. There was little discernible reduction in hospital activity as a result of the programme, but valuable insights are nevertheless available from a process evaluation of it. The crux of the story is that, in that instance, the interventions were developed largely by a team based in the local hospital, without much involvement from the surrounding care homes, where there was a different understanding of the causes of readmission. The interventions therefore aimed to deal with the problems perceived by the hospital team (such as poor communication, and low levels of capacity within care homes), but missed some other problems, meaning that uptake and impact were poor. In contrast, Principia has had a programme of work to build relationships across organisational boundaries, engaging care home teams. It is possible that this has led to greater common understanding of the nature of the problems that need to be addressed and, therefore, more effective interventions. Coproduction is also one of the elements of the framework for enhanced health in care homes that emerged from the New Care Models programme.
Overall, it seems that the evidence regarding use of hospital care is much more sparse for care home residents than for adults living outside these settings in the community. However, future improvement efforts might benefit from the data linkage methods presented in this briefing. Indeed, one of the problems in this area is that very little is known about admissions from care homes, and therefore baseline rates have been difficult to establish. One of the few previous studies was published as part of QualityWatch and examined hospital admissions data for post code areas containing care homes. The Improvement Analytics Unit has built on that previous study by linking data more precisely, using the full address, while still protecting the identity of the individuals concerned. The approach might serve as a model for the future.
A recurrent message from the Health Foundation’s improvement work is that, to improve the quality of care, repeated measurement is necessary to allow timely modification of initiatives, and inform their more effective evolution. Over the coming years, the Improvement Analytics Unit will analyse more local initiatives, feeding back analysis quickly to inform ongoing decision making and practice. To find out more, visit www.health.org.uk/IAU
††† QualityWatch is a joint research programme from the Health Foundation and the Nuffield Trust. For more details, see: www.qualitywatch.org.uk
References
- Bardsley M. Understanding analytical capability in health care: Do we have more data than insight? London: Health Foundation, 2016.
- NHS England. Five year forward view. London: NHS England, 2014. Available from: www.england.nhs.uk/wp-content/uploads/2014/10/5yfv-web.pdf
- NHS England. New care models: The multi-specialty community provider (MCP) emerging care model and contract framework. London: NHS England, 2016. Available from: www.england.nhs.uk/wp-content/uploads/2016/07/mcp-care-model-frmwrk.pdf
- NHS Rushcliffe Clinical Commissioning Group. Principia MCP Vanguard. www.rushcliffeccg.nhs.uk/principia-mcp-vanguard
- NHS England. New care models: The framework for enhanced health in care homes [Internet]. London: NHS England, 2016. Available from: www.england.nhs.uk/wp-content/uploads/2016/09/ehch-framework-v2.pdf
- National Audit Office. Health and social care integration [Internet]. London: National Audit Office, 2017. Available from: www.gov.scot/Topics/Health/Policy/Adult-Health-SocialCare-Integration/Narrative%5Cnhttp://www.gov.scot/Resource/0047/00479800.pdf
- Care Quality Commission. The state of health care and adult social care in England in 2012/13 [Internet]. London: The Stationery Office, 2013. Available from: www.ncbi.nlm.nih.gov/pubmed/21727839
- Diamond A, Sekhon JS. Genetic matching for estimating causal effects: A general multivariate matching method for achieving balance in observational studies. Rev Econ Stat [Internet]. The MIT Press; 2013 Jul 30;95(3):932–45. Available from: www.mitpressjournals.org/doi/abs/10.1162/REST_a_00318#.VJHoE2SsXDM
- Ho DE, Imai K, King G, Stuart EA. Matching as nonparametric preprocessing for reducing model dependence in parametric causal inference. Polit Anal [Internet]. 2007 Dec 6;15(3):199–236. Available from: http://pan.oxfordjournals.org/cgi/doi/10.1093/pan/mpl013
- Stuart EA, Huskamp HA, Duckworth K, Simmons J, Song Z, Chernew ME, et al. Using propensity scores in difference-in-differences models to estimate the effects of a policy change. Heal Serv Outcomes Res Methodol [Internet]. 2014 Aug 7;14(4):166–82. Available from: http://link.springer.com/10.1007/s10742-014-0123-z
- Pawson R, Tilley N. Realistic evaluation. London: SAGE Publications Ltd, 1997.
- Marshall M, Silva D De, Cruickshank L, Shand J, Wei L, Anderson J. What we know about designing an effective improvement intervention (but too often fail to put into practice). BMJ Qual Saf. 2016.
- Henderson C, Knapp M, Fernandez J-L, Beecham J, Hirani SP, Cartwright M, et al. Cost effectiveness of telehealth for patients with long term conditions (Whole Systems Demonstrator telehealth questionnaire study): nested economic evaluation in a pragmatic, cluster randomised controlled trial. BMJ [Internet]. 2013 Mar 21;346:f1035. Available from: www.bmj.com/content/346/bmj.f1035
- Deeny SR, Steventon A. Making sense of the shadows: Priorities for creating a learning health care system based on routinely collected data. BMJ Qual Saf. 2015;24:505–15.
- Graverholt B, Forsetlund L, Jamtvedt G. Reducing hospital admissions from nursing homes: a systematic review. BMC Health Serv Res [Internet]. 2014;14:36. Available from: www.pubmedcentral.nih.gov/articlerender.fcgi?artid=3906881&tool=pmcentrez&rendertype=abstract
- Díaz-Gegúndez M, Paluzie G, Sanz-Ballester C, Boada-Mejorana M, Terré-Ohme S, Ruiz-Poza D. Evaluación de un programa de intervención en residencias geriátricas para reducir la frecuentación hospitalaria. Rev Esp Geriatr Gerontol. 2011;46(5):261–4.
- Schippinger W, Hartinger G, Hierzer A, Osprian I, Bohnstingl M, Pilgram EH. Mobiler geriatrischer Konsiliardienst für Pflegeheime: untersuchung der effektivität eines internistisch-fachärztlichen konsiliardienstes zur medizinischen versorgung von pflegeheimbewohnern. Z Gerontol Geriatr [Internet]. 2012 Dec 25;45(8):735–41. Available from: http://link.springer.com/10.1007/s00391-012-0395-2
- Caplan GA, Meller A, Squires B, Chan S, Willett W. Advance care planning and hospital in the nursing home. Age Ageing. 2006;35(6):581–5.
- Molloy DW, Guyatt GH, Russo R, Goeree R, O’Brien BJ, Bédard M, et al. Systematic implementation of an advance directive program in nursing homes: a randomized controlled trial. JAMA [Internet]. 2000;283(11):1437–44. Available from: www.ncbi.nlm.nih.gov/pubmed/10732933
- Morrison RS, Chichin E, Carter J, Burack O, Lantz M, Meier DE. The effect of a social work intervention to enhance advance care planning documentation in the nursing home. J Am Geriatr Soc. 2005;53(2):290–4.
- Casarett D, Karlawish J, Crowley R. Improving the Use of Hospice Services in Nursing Homes. JAMA. 2013;294(2):211–7.
- Hutt E, Ruscin JM, Linnebur SA, Fish DN, Oman KS, Fink RM, et al. A Multifaceted Intervention to Implement Guidelines Did Not Affect Hospitalization Rates for Nursing Home-Acquired Pneumonia. J Am Med Dir Assoc [Internet]. Elsevier; 2011;12(7):499–507. Available from: http://dx.doi.org/10.1016/j.jamda.2010.03.011
- Loeb M, Carusone S, Goeree R, Walter SD, Brazil K, Krueger P, et al. Effect of a clinical pathway to reduce hospitalizations in nursing home residents with pneumonia: A randomized controlled trial. JAMA [Internet]. 2006;295(21):2503–10. Available from: http://dx.doi.org/10.1001/jama.295.21.2503
- Lee DTF, Lee IFK, Mackenzie AE, Ho RNL. Effects of a care protocol on care outcomes in older nursing home patients with chronic obstructive pulmonary disease. J Am Geriatr Soc. 2002;50(5):870–6.
- Sutton E, Dixon-Woods M, Tarrant C. Ethnographic process evaluation of a quality improvement project to improve transitions of care for older people. BMJ Open [Internet]. British Medical Journal Publishing Group; 2016;6(8):e010988. Available from: www.ncbi.nlm.nih.gov/pubmed/27491666
- Smith P, Sherlaw-Johnson C, Ariti C, Bardsley M. QualityWatch Focus on: Hospital admissions from care homes. London: The Health Foundation and the Nuffield Trust; 2015.
Acknowledgements
The Improvement Analytics Unit is a partnership between the Health Foundation and the Operational Research and Evaluation Team at NHS England.
This briefing was authored by Therese Lloyd, Arne Wolters and Adam Steventon from the Health Foundation, based on analysis undertaken by the Improvement Analytics Unit. The wider Improvement Analytics Unit team also includes Sarah Blundell, Richard Brine, Martin Caunt, Stefano Conti, Caroline Gori, Carlotta Greci, Creina Lilburne, Stephen O’Neill, Filipe Santos, Florence Starr and Charles Tallack.
The Improvement Analytics Unit reports to an Oversight Group and has established a Technical Advisory Group. We are grateful to members of these groups for their support and advice, as well as to Fiona Callaghan, Elizabeth Harris and Robert Taylor from NHS Rushcliffe Clinical Commissioning Group for their continued support.
Errors or omissions remain the responsibility of the authors alone.