Key points
Key points
- Health and care partners in Northumberland have been pursuing an ambitious programme to redesign the way care is delivered for their local population. The first phase was implemented in June 2015 and involved opening the UK’s first purpose-built, specialist emergency care hospital in Cramlington.
- The new hospital aims to provide better care for patients with potentially life-threatening conditions by providing faster access to consultants and diagnostics and shortening length of stay. It is staffed by accident and emergency (A&E) consultants 24 hours a day, 7 days a week, and by specialty consultants 7 days a week from 8.00 to 20.00.
- After it opened, three existing A&E departments were gradually refocused on providing care for minor injuries and illnesses. The aim was to convert these departments to be urgent care centres, staffed 7 days a week by a mix of hospital doctors, GPs and emergency nurse practitioners. However, over the period considered by this evaluation, the three existing departments were not fully converted and continued to provide A&E care, alongside hospitals in surrounding areas to which some of the population of Northumberland Clinical Commissioning Group (CCG) looked for treatment.
- This report examines the initial impact of these changes on hospital use for people registered with a GP in the Northumberland CCG area, over a 12-month period from August 2015. Comparisons were made against synthetic control areas that were formed by combining data from several other CCGs in England. The report considers the early impact of the redesign programme with the aim of informing ongoing efforts to improve the quality of care provided for the local population.
- The changes to urgent and emergency care were associated with a 13.6% increase in A&E visits for people registered with a general practice in Northumberland CCG. On average, their A&E visits were 14.3 minutes shorter than would have been expected for Northumberland. Indeed, 91.8% of patients in Northumberland were admitted, transferred or discharged within 4 hours of attending A&E, compared with 85.2% in the control area. The analysis did not find evidence of impact on admission rates, and it was not possible to determine whether the changes to service delivery had any impact on length of stay.
- Further research is needed to understand why patient activity changed in this way, as there are several possible explanations for these findings. The increased A&E activity may reflect perceived improvements in the quality of care provided, as well as the increase in the number of departments providing A&E care. This could have made A&E a more attractive or convenient place to obtain treatment. The reductions in A&E waiting times might also have reflected improvements to care processes.
- More qualitative data on the underlying mechanisms of the care processes are needed to be able to better understand the implications of the findings for the delivery of health care. Further quantitative evaluation is also important, because complex changes to health care rarely have the intended impacts on outcomes in the short term, and further course correction is often needed.
Introduction
In March 2015, a partnership including Northumberland CCG and the Northumbria Healthcare NHS Foundation Trust formed a primary and acute care system (PACS). This is one of the new care models that was announced in the Five year forward view. Its aim is ‘to join up services to allow better decision making and more sustainable use of resources, with a greater focus on prevention and integrated community based care, and less reliance on hospital care’. The Northumberland PACS serves a population of more than 320,000 people across Northumberland – one of the largest and most rural areas of England.
The partners in Northumberland have been pursuing an extensive change programme, the first step of which was implemented in June 2015, shortly after the PACS was formed. This aimed to centralise emergency care in a new hospital, while converting existing A&E departments into walk-in centres for urgent care needs. This report considers the impact of these changes on hospital use up to July 2016. It should be noted, however, that further changes are planned, including improvements to primary care and the introduction of integrated complex care teams. Ultimately, the Northumberland PACS aims to create an accountable care organisation, in which a group of providers will agree to take collective responsibility for all care for the local population for a defined period within a single fixed budget.
What changes were made to urgent and emergency care?
Before June 2015, the population of Northumberland CCG had access to A&E departments in general hospitals at North Tyneside, Wansbeck and Hexham (which form part of Northumbria Healthcare). These three hospitals accounted for around 90% of all A&E visits by the population of Northumberland CCG,, with most of the remaining visits made to departments run by another trust in the neighbouring Newcastle area.
Across all hospitals, there were 301 A&E attendances per 10,000 people per month for the population of Northumberland CCG., This was high in comparison to the national average (278) and had been growing over time. Local NHS organisations had become concerned about the number of patients relying on emergency care services to meet relatively routine and minor care needs that could potentially have been managed more effectively elsewhere. At the same time, there was a desire to provide better care for seriously ill and injured patients.
A new specialist emergency care hospital was built at Cramlington. It is the first of its kind in the UK. It aims to provide seriously ill patients with faster and higher quality care than they would receive elsewhere. There has been a focus on providing patients with rapid access to senior doctors, and the hospital is staffed by A&E consultants 24 hours a day, 7 days a week. It is also staffed by consultants in other specialties from 8.00 to 20.00,
7 days a week. The hospital was designed to improve the flow of patients – departments that work closely together (for example, x-ray, A&E and paediatrics) were placed next to each other. Additional aspects of the clinical model at Cramlington are described in Box 1.
After the new hospital opened, the three original A&E departments (at North Tyneside, Wansbeck and Hexham) shifted their focus to providing urgent but non-emergency care to patients with relatively minor complaints. These urgent care centres are staffed 7 days a week by a mix of hospital doctors, GPs and emergency nurse practitioners, who have rapid access to diagnostic services by virtue of being based on a hospital site. A series of public engagement events was held to communicate these changes, and the hospitals are now described as walk-in centres for urgent, but not life-threatening, care needs. However, there were concerns that some patients might continue to present at the older hospitals with serious or life-threatening conditions. Therefore, in practice, the older facilities were not fully converted and continued to provide A&E care, operating on a 24-hour basis until their opening hours were reduced to 8.00–00.00 in December 2016.
The intention was that these changes would improve the quality of care offered to seriously ill and injured patients (by providing faster access to consultants and diagnostics, and shortening length of stay), as well as for those with less serious needs (by delivering urgent care in dedicated centres that could proceed in a more orderly fashion once free from the disruption from emergency cases). This evaluation considers the impact of the changes on hospital use, since it is an aim of the wider Northumberland PACS to reduce reliance on A&E and hospital care.
Box 1: The clinical model at Cramlington
Northumberland’s new hospital at Cramlington is the UK’s first purpose-built, specialist emergency care hospital. It aims to provide better care for patients with potentially life-threatening conditions by providing faster access to consultants and diagnostics and shortening length of stay. It is staffed by accident and emergency (A&E) consultants 24 hours a day, 7 days a week, and by specialty consultants 7 days a week from 8.00 to 20.00.
In addition to emergency care, the new hospital provides critical care, medical and surgical services, a neonatal unit, children and young people’s services, maternity services and a full range of diagnostic imaging services. It also provides some elective care, for example for higher risk patients who may need critical care support as part of their recovery and treatment.
Patients presenting at A&E in Cramlington who do not require emergency admission may be referred to the ambulatory care unit (ACU). The ACU provides medical and surgical ambulatory care, emergency gynaecology and frailty assessments.
Prior to the introduction of the new specialist emergency care hospital, all three Northumbria Healthcare general hospitals serving the population of Northumberland CCG provided ambulatory care services, including rapid access treatment units and short-stay wards.
Although most ambulatory care activity has been moved to Cramlington, some services, which serve small numbers of patients, are still active in the general hospitals. Sometimes, GPs or other health professionals request patients be admitted directly to hospital in response to urgent care needs. Unlike some hospital providers that admit these patients directly, Northumbria Healthcare routes some of them through A&E.
Northumbria Healthcare also serves the population of North Tyneside – a metropolitan borough between Newcastle and the North Sea.
About this evaluation
This evaluation was conducted by the Improvement Analytics Unit – a partnership between the Health Foundation and NHS England that aims to provide local teams with robust and timely information on the impact of initiatives, in order to inform ongoing improvement efforts (see Box 2).
The report considers data spanning the period from 1 August 2015 (shortly after the new specialist emergency care hospital opened) to 31 July 2016 (1 year later). It therefore considers early data from the PACS programme at a time when the number of departments provided by Northumbria Healthcare offering A&E services to the population of Northumberland CCG had effectively been increased from three to four, but with changes to the clinical model that aimed to centralise major A&E cases, reduce length of stay and improve outcomes.
Due to constraints with national data sets, this report is restricted to considering impacts on hospital use, including A&E visits, inpatient admissions and length of stay. It cannot examine whether there have been improvements in the clinical quality of care (for example, infection rates) or patient outcomes (such as quality of life).
Box 2: The work of the Improvement Analytics Unit
The Improvement Analytics Unit produces robust analyses regarding the impact of changes to how health care is delivered. It achieves this by using large data sets to track the quality of care offered to patients receiving new interventions, and making comparisons against control groups. These control groups are used to provide an estimate of the outcomes that would have been expected in the absence of the initiative being evaluated.
The approach can be understood by drawing a parallel with randomised controlled trials, which are often used to evaluate the impact of new drugs and medical procedures. In these trials, subjects are enrolled and then randomly assigned to receive either the new intervention or more standard care. Outcomes are then assessed at a later point in time – the effect of the intervention is calculated based on the difference in the outcomes of the intervention and control groups.
Randomised controlled trials are often considered the ‘gold standard’ in impact evaluation, since randomisation ensures that two groups are comparable at baseline. Unfortunately, it is rarely feasible to conduct these trials for the kinds of interventions considered by the Improvement Analytics Unit. For example, it would not be possible to recruit large numbers of health care areas and randomly determine which of these should build a new specialist emergency care hospital while converting old A&E departments to urgent care centres.
The unit selects control groups by applying advanced statistical methods to existing NHS data sets. The unit works with academic experts, and for this evaluation worked closely with Stephen O’Neill from the National University of Ireland Galway and the London School of Hygiene and Tropical Medicine, who brought technical expertise in the synthetic control method. The analysis was conducted jointly with NHS England, but this briefing was prepared by the Health Foundation. It is the second from the Improvement Analytics Unit, with the first one considering the impact of enhanced support for people living in care homes.
Approach to the analysis
The Improvement Analytics Unit (see Box 2) adopted a population approach to the evaluation for this report. It examined hospital use for the population of Northumberland CCG, irrespective of whether patients were treated by Northumbria Healthcare or elsewhere (eg within the Newcastle hospitals run by a neighbouring trust). This approach was taken because the changes that were made to urgent and emergency care might have affected behaviour in complex ways. For example, it is plausible that, following June 2015, some patients sought care at the new hospital in Cramlington who would have otherwise crossed the county border for treatment – such a phenomenon would have increased activity at Northumbria Healthcare without increasing the overall rate of A&E visits for the population.
By including all activity among the population of Northumberland CCG, regardless of the hospital, this report presents a more accurate picture of the effect the changes had on health care for the local population. The population approach is also consistent with the ambition of the Northumberland PACS partners to create an accountable care organisation.
This report also includes comparisons between the hospital use of the population of Northumberland CCG and a control area. This approach differs from the approach that many organisations take to performance monitoring, which typically relies on examining trends over time – for example, comparing the rate of A&E visits experienced between August 2015 and July 2016 with the rate of A&E visits before the changes were made. Such a ‘before-and-after’ approach is useful for assessing whether metrics changed over time, but cannot isolate the effect of the redesign of urgent and emergency care from the effect of other changes that were taking place in England at the same time. In contrast, the control area in this analysis provided an estimate of the hospital use that would have been expected in Northumberland in the absence of the redesign.
As indicated in Box 3, selecting a control area is challenging, since no other part of England is exactly like Northumberland. However, the Improvement Analytics Unit formed a control area by combining data from several other parts of England in a way that ensured the resulting area was similar to Northumberland in terms of its historic trend in hospital use. This ‘synthetic control’ method is relatively new, but has been used to evaluate a large-scale tobacco control programme, as well as other health policies., The method is appropriate when an intervention affects an entire area, and when data are available from several other areas. Box 3 illustrates the method using a previous study.
Box 3: An illustration of the synthetic control method
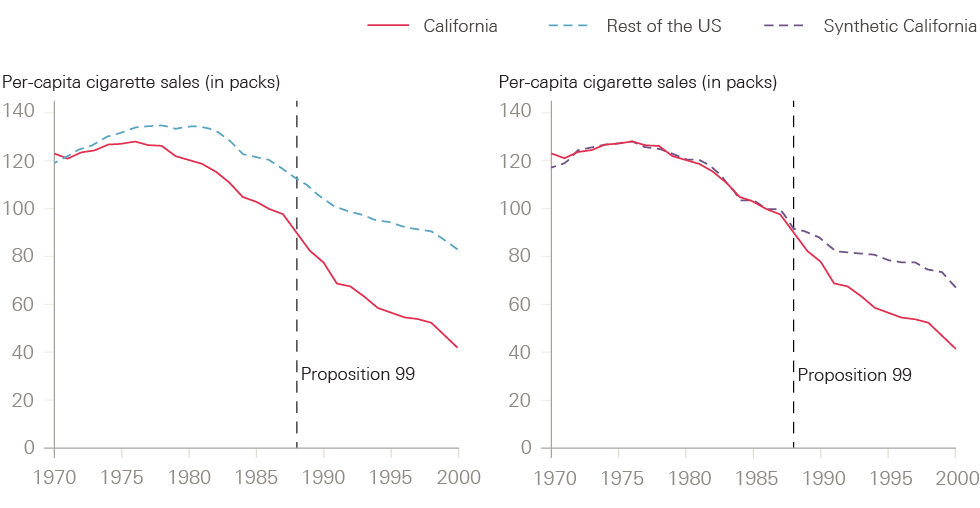
In 1988, the electorate in California voted for a large-scale tobacco control programme known as Proposition 99, which increased California’s cigarette excise tax by 25 cents per pack, earmarked the tax revenues to health and anti-smoking education budgets, funded anti-smoking media campaigns, and spurred local, clean, indoor-air ordinances throughout the state. One of the aims of the reforms was to reduce the sale of cigarettes, but evaluating the impact on cigarette sales is challenging because sales are affected by many other factors, including other public health initiatives and public attitudes to smoking.
The challenges are illustrated in the left-hand chart in Figure 1, which is taken from an evaluation of Proposition 99 and shows that the number of cigarette sales had been falling in California even before the reforms were passed into law. Sales continued to reduce after 1988, but it is hard to conclude from the figure how much of the reduction was due to Proposition 99. The trend for the rest of the US is shown in the dashed line, but by itself provides little insight. The evaluation team therefore applied the synthetic control method.
As can be seen in the right-hand chart in Figure 1, the synthetic control area was selected to have a very similar profile of cigarette sales to California in the years preceding Proposition 99. Since California is unique, it was not possible to use a single state as the control. Instead, the control was formed as a blend of five states, with Utah making up 33% of the control state, Nevada 23%, Montana 20%, Colorado 16% and Connecticut 7%. The blend of states is unimportant, provided that the overall synthetic area showed similar trends in cigarette sales to California prior to 1988, and therefore provides an estimate of what might have happened to sales in California had Proposition 99 not been enacted. The right-hand chart suggests that between 1989 and 2000, the reforms reduced cigarette consumption by almost 20 packs per capita – or by around 25%. The analysis for this report involved a very similar method to evaluate the impact of the changes to urgent and emergency care in Northumberland.
Figure 1: Trends in per-capita cigarette sales, California compared with synthetic California and the rest of the US
The evaluation of the redesign of urgent and emergency care involved a series of steps. These are described in more detail in the next section, but are summarised here.
- Selecting the donor pool – 20 CCGs in England most like Northumberland CCG in terms of variables such as the number of GPs per capita and the prevalence of common diseases were selected. These formed the basis for the selection of the synthetic control areas, and are referred to as the ‘donor pool’.
- Obtaining person-level data – the Improvement Analytics Unit obtained data for residents of the CCGs in the donor pool and Northumberland CCG.
- Producing impact metrics – the unit used the person-level data to produce a series of impact metrics, which related to how individuals used hospital care in each CCG between August 2015 and July 2016.
- Risk-adjusting the impact metrics – the unit risk-adjusted the impact metrics, where possible, to deal with changes over time in the characteristics of patients seeking hospital care. The risk-adjusted impact metrics aimed to reflect the levels of hospital use for a population that remained unchanged over time.
- Selecting synthetic control areas – the unit selected a different synthetic control area for each of our impact metrics. These were chosen by considering the historic trend in the relevant metric over the pre-intervention period (defined as May 2011 to April 2015). Weights were assigned to each of the CCGs in the donor pool in such a way that the weighted average of the risk-adjusted impact measures was similar to Northumberland CCG over this period.
- Estimating the impact – the Improvement Analytics Unit based its estimates of the changes to urgent and emergency care on the differences in the risk-adjusted impact measures between Northumberland CCG and the relevant synthetic control area over the post-intervention period (defined as August 2015 to July 2016).
- Conducting sensitivity analyses – the unit conducted several sensitivity analyses to confirm findings were robust to changes in method.
The statistical approach was finalised before data were made available for the analysis, and is described in a detailed statistical analysis plan that is available upon request.
Method
1. Selecting the donor pool
The Improvement Analytics Unit began by selecting the 20 CCGs in England that were most similar to Northumberland (see Figure 2). There are 209 CCGs in England, but 30 CCGs in London and 59 vanguard CCGs participating in the new care models programme were excluded. This left 120 CCGs, which the unit characterised using variables such as the number of GPs per capita and the prevalence of common diseases. The unit then assessed the similarity of each CCG to Northumberland CCG across the whole set of variables, placing greater weight on variables that were more predictive of admission rates. The most similar 20 CCGs formed the basis for the selection of the synthetic control areas. More detail on these areas and the selection method can be found in the technical appendix.
Figure 2: Clinical commissioning groups selected for the donor pool

Note: The CCG areas (ranked from most to least similar in terms of the weighted distance metric) are: Shropshire; Wolverhampton; Oldham; Doncaster; Bolton; Tameside and Glossop; North East Essex; Basildon and Brentwood; Ipswich and East Suffolk; Mid Essex; Birmingham South and Central; East Riding of Yorkshire; Stoke-on-Trent; North West Surrey; Bristol; Heywood, Middleton and Rochdale; Coastal West Sussex; North Derbyshire; Rotherham; and West Essex.
2. Obtaining person-level data for residents
The remaining parts of the study used data from the Secondary Uses Service (SUS) – a national, person-level database that is closely related to the widely used Hospital Episode Statistics (HES). The Improvement Analytics Unit has access to SUS data for its work, and processes them in a secure environment based at the Health Foundation. All data are pseudonymised, meaning they have been stripped of all fields that could be used to identify patients directly, such as name, date of birth and address. Individuals’ NHS numbers are replaced with a pseudonym, which the unit used to link records for the same individual over time. The overall approach to information governance was scrutinised by the programme oversight group and by information governance experts at NHS Digital.
There are some limitations to how the SUS data are collected that affected the ability of the evaluation team to reflect some specific details of health care delivery in Northumberland.
- Northumbria Healthcare NHS Foundation Trust records some ambulatory care unit activity in SUS as emergency admissions, even though a local payment arrangement exists for this activity. Figures for emergency admissions therefore include some ambulatory care unit activity. Other ambulatory care unit activity is recorded as outpatient attendances, but outpatient data were not considered in this evaluation.
- When studying emergency admissions, it was not possible to confidently distinguish between patients who originally presented at A&E from those who were admitted to hospital directly following an urgent request from a GP. Both types of emergency admission are therefore included in the analysis.
- A&E attendances at North Tyneside, Wansbeck and Hexham were recorded in SUS as attendances to ‘type 1’ departments (major, consultant-led 24-hour services with full resuscitation facilities) for the entirety of the period covered by this evaluation, even though these departments were gradually refocused on providing care for minor injuries and illnesses. To deal with this, the Improvement Analytics Unit chose to define A&E attendances as including activity at minor injury units, walk-in centres and specialty departments, in addition to those at major departments. The unit applied the same definition before and after the changes, and for the different CCG areas, to make sure the analysis compared like with like.
3. Producing impact metrics
The SUS data were used to assess how the population of each CCG used hospital care. The impact metrics were as follows:
- The rate of visits to A&E departments – calculated as the total number of A&E visits from the SUS data, per 10,000 people in the local population. As explained, the metric included major A&E departments, specialty departments, minor injury units and walk-in centres used by the population of Northumberland CCG, whether run by Northumbria Healthcare or other trusts.
- The rate of inpatient (elective and non-elective) admissions per 10,000 people. This metric included all inpatient admissions recorded in the SUS. It included certain admissions to the ambulatory care unit at the new specialist emergency care hospital.
- The rate of emergency admissions per 10,000 people. This metric was intended to capture admissions that were unpredictable and occurred at short notice because of clinical need. It may have included certain admissions to the ambulatory care unit.
- The rate of elective admissions per 10,000 people.
- The percentage of patients in the CCG who were admitted, transferred or discharged within 4 hours of arrival at A&E. It is worth noting that this figure relates to the CCG population as a whole. The metric therefore differs from the A&E performance measure reported monthly by NHS England, which is reported separately for each trust. In addition, the metrics used in this report are risk-adjusted (see the next step for more details).
- The average length of a visit to A&E in minutes, from the point of arrival to admission, transfer or discharge.
- The percentage of patients attending A&E who were subsequently admitted to hospital.
- The average length of inpatient admissions in days – this was analysed separately for all admissions, emergency admissions and elective admissions.
These impact measures were calculated monthly by applying the same definitions to data for each CCG. The synthetic control areas were determined using monthly data from May 2011 to April 2015 only. The impact of the changes was examined using analogous data for the period following implementation (August 2015 to July 2016).
4. Risk-adjusting the impact metrics
The Improvement Analytics Unit was aware that the redesign of urgent and emergency care might have led to changes in the characteristics of patients attending hospital, and these changes to case-mix might in turn have affected the impact measures. For example, it is plausible that following the redesign, more routine care was provided within primary care settings. In this case, A&E departments might have increasingly focused on care for patients with more severe needs, and we would expect a greater proportion of these patients to be admitted. Therefore, when comparing impact metrics, the unit adjusted for changes in the characteristics of patients attending hospital over time.
The risk-adjustment method took account of the following variables:
- age (structured into 5-year bands up to 90 years, and then 90 years and over)
- gender
- ethnicity
- the CCG responsible for the patient’s care
- the numbers of elective and emergency admissions and A&E attendances in the preceding 24 months
- the day of the week and month that the admission or A&E visit commenced
- comorbidities (indicators for each of the 31 conditions used in the Elixhauser index, plus dementia)
- for the impact measures that related to inpatient care, the primary diagnosis attached to the admission record. These were categorised using the summary hospital-level mortality indictor-grouped Clinical Classifications Software.
By risk-adjusting the impact measures, the findings could not be affected by changes in these variables over time. However, the risk-adjustment method was unable to take account of variables that were not recorded in the SUS data, including direct measures of illness severity. The rate of A&E visits and overall admissions were also not risk-adjusted, as the health profile of the overall population was unlikely to change significantly over the period involved.
5. Selecting synthetic control areas
The Improvement Analytics Unit chose a different synthetic control area for each of the impact metrics. In each case, the synthetic control area was formed by assigning weights to the CCGs in the donor pool, then taking the weighted average of the relevant risk-adjusted impact metric. The weights were chosen so that the synthetic control area was very similar to Northumberland CCG in terms of the relevant risk-adjusted metric over the 48 months from 1 May 2011 to 30 April 2015.
The rationale is that, if the two areas were similar on a particular metric over this long period, then it is reasonable to suppose they would have continued to be similar in the absence of the changes to urgent and emergency care. The synthetic control areas provide a ‘best estimate’ regarding what would have happened to hospital use in Northumberland had these changes not been made.
The unit used an established statistical procedure to select the weights, and then validated the procedure by graphically assessing the similarity of the synthetic control area and Northumberland CCG over the period from May 2011 to April 2015. Data for the 6 weeks immediately preceding the changes to urgent and emergency care were excluded (from 1 May 2015 to 15 June 2015), since patterns of hospital use might already have started to change in anticipation of the changes being made. For some of the impact metrics, it was not possible to select a synthetic control area that adequately tracked Northumberland CCG over the entire period. In these instances, findings have not been reported as they are unreliable.
6. Estimating the impact of the changes to urgent and emergency care
After forming the synthetic control areas, the unit estimated the impact of the changes to urgent and emergency care based on the differences between Northumberland CCG and the relevant synthetic control area. Although the new specialist emergency care hospital opened on 16 June 2015, data for the first 6 weeks were excluded, to allow the changes to bed in. Impacts were examined for the period from 1 August 2015 to 31 July 2016.
As explained in Box 3, the effect of the changes to urgent and emergency care can be estimated as the difference between the impact metric for Northumberland and that of the relevant synthetic control area. However, the precision of this estimate must be assessed. This is important since outcomes vary over time even without changes to care delivery, and it would be misleading to attribute normal statistical variation to the effect of changes made. Traditionally, statisticians deal with this issue by reporting the ‘p-value’, which is the probability that an effect of at least the magnitude observed could have arisen by chance. If this probability is low (eg less than 5%), then the findings are usually considered to represent a systematic difference between the two groups.
However, the synthetic control approach does not lend itself to the calculation of p-values, or related quantities like confidence intervals, and so a different approach was needed – the significance score. The significance score performs a very similar role to the p-value: the lower the significance score, the more confidence that the findings reflect a systematic difference in the impact measures between the two areas, rather than chance. The unit used a threshold of 5% to determine whether its findings were statistically robust.
7. Conducting sensitivity analyses
Although the evaluation approach is considered robust, it made several assumptions. As previously stated, the key assumption was that if Northumberland CCG and the synthetic control area were similar on a particular metric over a long period, then they would have continued to be similar in the absence of changes to urgent and emergency care. The Improvement Analytics Unit tested the sensitivity of the findings to these assumptions by making the following changes to its method:
- structuring the hospital data on a quarterly, rather than monthly, basis
- increasing the duration of the anticipation period, and thus only using data from May 2011 to April 2014 when determining the weights used to form the synthetic control areas, rather than from May 2011 to April 2015
- considering the importance of risk adjustment by estimating effects without risk-adjusting the impact measures
- reducing the size of the donor pool to the 10 CCGs most similar to Northumberland
- using an alternative donor pool, selected using the Commissioning for Value method. This donor pool differed substantially from the donor pool in Figure 2, with only five CCGs common to both rankings. As before, CCGs in London and other new care models vanguards were excluded.
‡ This included primary and acute care systems, multispecialty community providers, enhanced health in care homes, and urgent and emergency care, as well as CCGs linked to two acute care collaborations – the Salford and Wigan Foundation Chain and the Healthcare Group in Dartford and Gravesham.
¶ Since April 2014, admissions to the ambulatory care unit have been counted as emergency admissions when medical ambulatory care is provided or frailty assessments are conducted, provided that the activity is not scheduled in advance. They are recorded as outpatient activity when the activity is scheduled at least a day in advance (eg when a patient is asked to come back the next day for a scan) or when the unit is providing surgical care or emergency gynaecology. Before April 2012, all admissions to the ambulatory care unit were counted as emergency admissions. Between April 2012 and April 2014, they were all recorded as outpatient appointments.
** The Elixhauser comorbidity index is a method of categorising comorbidities of patients based on the International Classification of Diseases (ICD) diagnosis codes found in administrative data, such as hospital abstracts data.
†† Indicators for summary hospital-level mortality indicator categories with less than three cases per 10,000 population for elective or emergency admissions were excluded to ensure model convergence and prevent overfitting.
‡‡ For more information see the technical appendix: www.health.org.uk/impact-redesign-care-Northumberland
§§ The rate of elective admissions, the proportion of accident and emergency visits leading to an admission, the average length of stay of elective admissions, and the average length of stay of emergency admissions.
¶¶ For more information see the technical appendix: www.health.org.uk/impact-redesign-care-Northumberland
*** These were Shropshire, North East Essex, Ipswich and East Suffolk, East Riding of Yorkshire, and North Derbyshire.
Results
The new specialist hospital provides most emergency hospital care for the population of Northumberland CCG
Figure 3 shows trends in hospital use for the population of Northumberland CCG, without risk-adjustment. As expected, there was a sharp reduction in the number of A&E visits at Northumbria Healthcare’s three general hospitals after June 2015. From then, the new specialist emergency care hospital delivered around 49% of A&E visits for the population of Northumberland CCG and 62% of emergency admissions. It provided only a small percentage of elective admissions (2%), as would be expected.
The analysis also revealed changes over time to the characteristics of patients seeking health care. For example, the average age of the population of Northumberland CCG experiencing emergency admission increased from 55.0 years before the redesign to 56.1 years afterwards (see Table 1). Patients also tended to have more comorbidities following the changes (they had on average 2.0 conditions after the changes, compared with 1.8 before). Interestingly, these overall averages disguised substantial changes within particular hospitals. For example, the average age of patients being admitted as an emergency in Hexham increased from 69.4 years before the changes to 78.9 years afterwards. These patterns are not directly relevant to the evaluation, since it is concerned with the impact of the changes across the entire population of Northumberland CCG – however, they are suggestive of the complexity involved in redesigning health care.
Table 1: Characteristics of the population of Northumberland CCG experiencing emergency admission, April 2011–June 2015 and July 2015–June 2016
|
Average age in years |
Average number of comorbidities |
Number of emergency admissions per quarter |
||||
|
Before |
After |
Before |
After |
Before |
After |
|
|
The Northumbria specialist emergency care hospital at Cramlington |
- |
54.3 |
- |
1.8 |
- |
5,275 |
|
Hexham general hospital |
69.4 |
78.9 |
1.7 |
2.3 |
862 |
260 |
|
Wansbeck general hospital |
59.3 |
74.8 |
1.8 |
2.9 |
4,650 |
929 |
|
North Tyneside general hospital |
34.5 |
67.3 |
1.7 |
2.9 |
993 |
176 |
|
Other hospitals |
49.9 |
52.7 |
1.7 |
1.9 |
2,377 |
2,498 |
|
Average across Northumberland CCG |
55.0 |
56.1 |
1.8 |
2.0 |
- |
- |
Note: ‘Before’ is April 2011–June 2015. ‘After’ is July 2015–June 2016.
Figure 3: Trends in hospital use for the population of Northumberland CCG
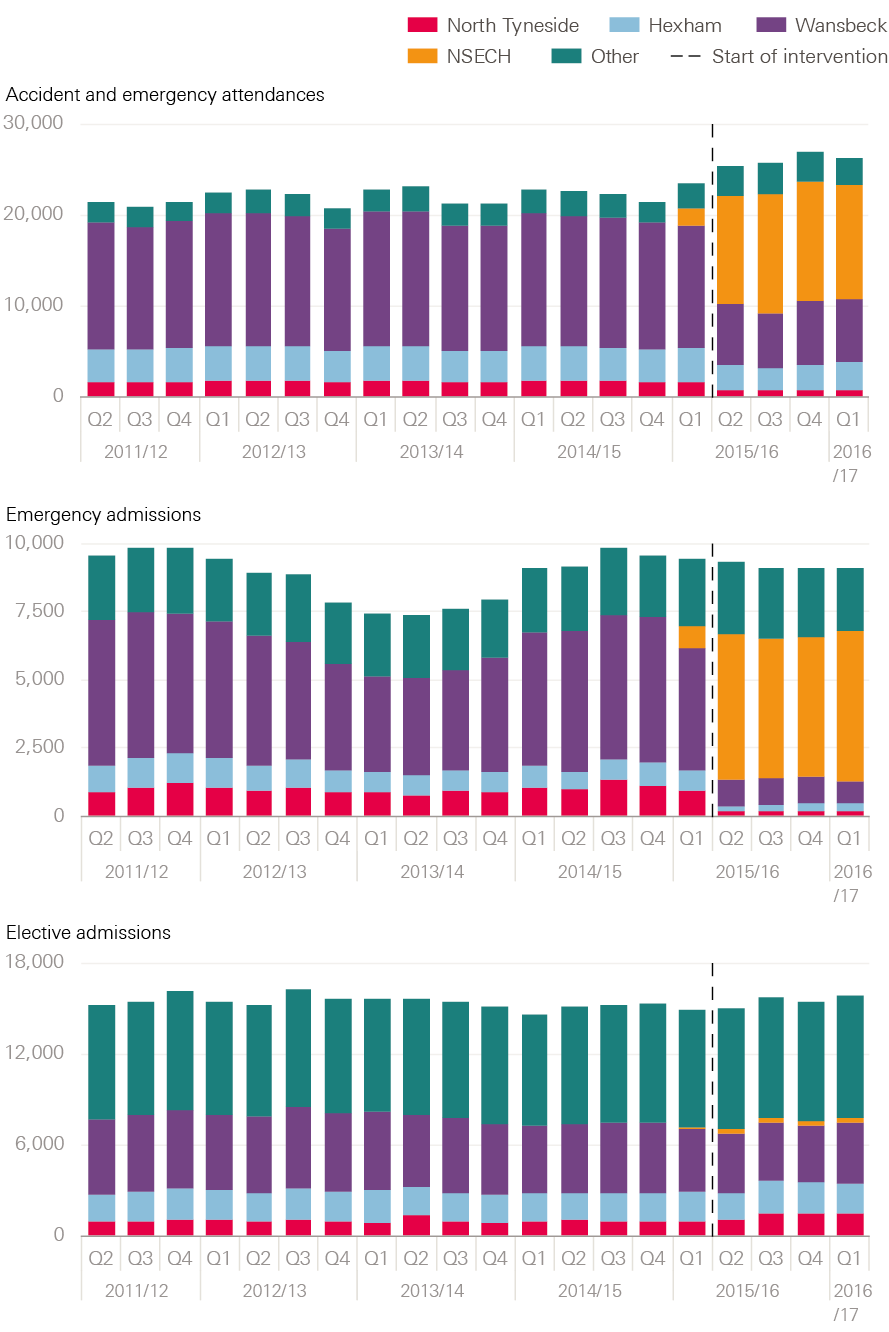
Note: Years are financial years. The vertical line is drawn at 1 July 2015 but the changes to urgent and emergency care were made slightly earlier, on 16 June 2015. These figures will not match Figure 4, since they are not risk-adjusted and are expressed as total numbers of visits rather than numbers per 10,000 people.
Results from applying the synthetic control method
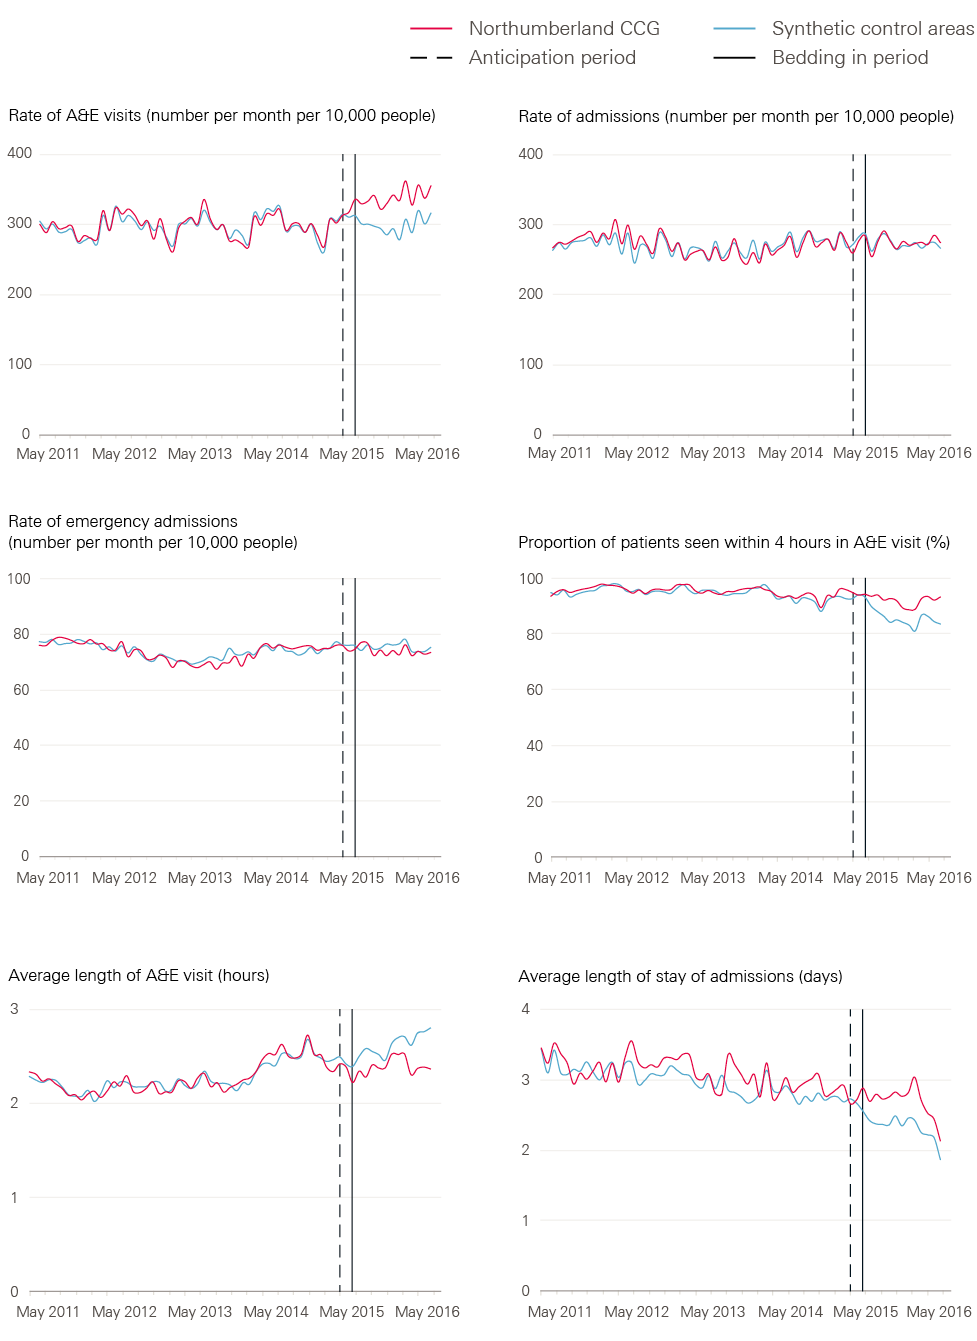
While Figure 3 shows the trends in hospital use over time for the population of Northumberland CCG, it provides limited insight into the impact of the redesign of emergency care on hospital use. This is because, although the total volume of A&E visits for Northumberland CCG patients seems to have increased in Figure 3, it is necessary to consider what would have happened in a control area. Therefore, Figure 4 shows the results of applying the synthetic control method. The red lines show the risk-adjusted hospital use of patients in Northumberland CCG, while the blue lines show the equivalent data for patients in the synthetic control area. The two lines tend to be similar over the 4 years preceding the changes to urgent and emergency care (ie to the left of the first vertical line). The impact of the changes can be assessed by comparing the lines for Northumberland CCG and the synthetic control area over the post-intervention period (ie to the right of the second vertical line).
The results are summarised here (see Table 2 for the data).
- The rate of A&E visits – the rate for Northumberland CCG increased to approximately 340 visits per 10,000 people per month following the changes to urgent and emergency care. However, it remained broadly constant in the synthetic control area at around 300 A&E visits per 10,000 people per month for the local population. There were around 40 more A&E visits per 10,000 people per month for the population of Northumberland CCG than for the synthetic control area (13.6% more). Since the significance score was 0%, the Improvement Analytics Unit has a high degree of confidence that these findings represent a systematic difference.
- The rate of inpatient admissions (including ambulatory care) – following the changes to urgent and emergency care, the overall admission rate in Northumberland CCG was 274.6 admissions per 10,000 people per month, compared with 272.3 for the relevant synthetic control area. While this is an increase of 2.3 admissions per 10,000 people, the significance score was very high at 95%, meaning that such differences might easily be the result of chance.
- The rate of emergency admissions (including ambulatory care) – following the changes, there were 74.2 emergency admissions per 10,000 people per month for the population of Northumberland CCG, compared with 75.4 in the relevant synthetic control area. This suggests a slight reduction in the emergency admission rate, but with a significance score of 70% it is not possible to be confident that these differences were not the result of chance.
- The percentage of patients attending A&E who were admitted, transferred or discharged within 4 hours of arrival – this remained steady for the population of Northumberland CCG following the redesign of urgent and emergency care, yet declined in the relevant synthetic control area. Indeed, 91.8% of A&E visits in Northumberland CCG lasted less than 4 hours, compared with 85.2% in the synthetic area. The percentage of A&E patients seen within 4 hours was around 7% higher in Northumberland CCG – with a significance score of 0% this was unlikely to be the result of chance.
- The average length of a visit to A&E in minutes – the duration of A&E visits remained steady for the Northumberland CCG population at around 144 minutes, but increased in the synthetic control area. A&E visits were on average 14.3 minutes shorter for those in Northumberland CCG, compared with those in the synthetic control area. This difference was unlikely to be the result of chance, with a significance score of 0%.
- The average length of inpatient admissions in days – the average length of stay in hospital had been falling in both areas for some time. Following the changes to urgent and emergency care, the average length of stay continued to fall for the population of Northumberland CCG, but it was hard to determine whether Northumberland CCG achieved shorter lengths of stay than the relevant synthetic control area. The Improvement Analytics Unit’s best estimate is that, compared with patients treated in the synthetic control area, patients admitted in Northumberland CCG remained in hospital on average 0.4 days longer following the changes to urgent and emergency care. However, the significance score was 10% and the synthetic control area did not track Northumberland CCG as closely over the pre-intervention period for this metric as for others. Therefore, it is not possible to be conclusive about whether there was an impact on length of stay.
The findings were unchanged when the unit amended its method in the ways described in the technical appendix.
Table 2: Comparison of hospital use between the population of Northumberland CCG and the relevant synthetic control areas, August 2015–July 2016
|
Northumberland CCG (mean, SD) |
Relevant synthetic control area (mean, SD) |
Difference |
Relative difference (%) |
Significance score |
|
|
Rates of hospital use: expressed as activity per month per 10,000 people |
|||||
|
A&E visits |
339.6 (12.7) |
299.1 (12.1) |
40.5 |
13.6 |
0% |
|
Admissions |
274.6 (9.1) |
272.3 (7.1) |
2.2 |
0.8 |
95% |
|
Emergency admissions |
74.2 (1.8) |
75.4 (1.4) |
-1.2 |
-1.6 |
70% |
|
A&E visit length in minutes |
143.8 (5.0) |
158.1 (6.8) |
-14.3 |
-10.5 |
0% |
|
Length of admissions in days |
2.7 (0.2) |
2.3 (0.8) |
0.4 |
12.1 |
10% |
|
Expressed as a proportion of patients |
|||||
|
A&E visits lasting less than 4 hours |
91.8 |
85.2 |
6.7 |
6.9 |
0% |
Note: SD=standard deviation. A lower significance score indicates greater confidence that the effect is not due to chance.
Figure 4: Comparison of the impact metrics for the population of Northumberland CCG and the relevant synthetic control areas, April 2011–June 2017
Interpretation of the findings
This study examined the early impacts of changes to how urgent and emergency care is delivered in Northumberland CCG, which involved opening a new specialist emergency care hospital and gradually converting the three older local A&E departments into urgent care centres. The Improvement Analytics Unit found that, when compared against a synthetic control area, the changes were associated with a 13.6% increase in the number of A&E visits to hospitals within Northumbria Healthcare and other local trusts for people who were registered with a GP in the Northumberland CCG area. This is the average impact between August 2015 and July 2016, when the number of departments provided by Northumbria Healthcare offering A&E services to the population of Northumberland CCG had effectively been increased from three to four. It is possible that the increases detected in the number of A&E visits were the result of public perceptions that the quality of emergency care had improved following changes to the three existing A&E departments and the opening of a new state-of-the-art hospital. Thus, the redesign may have made A&E a more attractive or convenient place to seek care.
The unit also found that patients in Northumberland CCG who attended A&E between August 2015 and July 2016 spent less time in A&E than similar patients in the synthetic control area – the average time saving was 14.3 minutes. 91.8% of patients in the CCG area were admitted, transferred or discharged within 4 hours, compared with 85.2% of patients in the synthetic control area. These reductions might have been due to improvements in care processes enabling the more efficient flow of patients through the hospital.
It is harder to determine the impact the changes had on inpatient care. Emergency admission rates were very slightly lower in Northumberland CCG than in the synthetic control area, but these differences could well have been the result of chance. The unit found that length of stay reduced in both Northumberland CCG and the synthetic control area, but it was not possible to determine whether the reductions in Northumberland were greater than those in the relevant synthetic control area.
Strengths and limitations
The control area was intended to represent the level of hospital use that would have been experienced in Northumberland CCG in the absence of the changes to urgent and emergency care. However, it is possible that the control area was not comparable to Northumberland CCG at the outset of the study, and so the findings might be due to systematic differences between the areas, rather than changes in how care was delivered. In the absence of a randomised controlled trial, it is not feasible to eliminate this risk, but the study was designed to reduce it as much as possible through the following.
- The unit selected the synthetic control area from a donor pool of 20 other CCGs in England that had similar characteristics to Northumberland CCG for variables like number of GPs per capita and prevalence of common diseases. However, there were still some differences between the characteristics of the donor pool and Northumberland CCG – the unit could not assess how similar the areas were in characteristics that were not recorded in the data, such as the quality of social care.
- The unit weighted the contribution of the CCGs in the donor pool to ensure the resulting synthetic area had been experiencing similar trends in hospital use to Northumberland CCG. The key assumption is that, since Northumberland CCG and the control areas experienced similar rates of hospital use over the 4 years before the changes were made, they would have continued to experience similar outcomes in the absence of change. This is an untestable but plausible assumption.
- The unit was aware that the profile of patients attending hospital might differ between areas and change over time. Therefore, impact metrics were risk-adjusted to take account of differences and make sure that comparisons were made between similar patients. However, the unit could only adjust for variables that were recorded in the SUS data (like age, gender, health conditions and prior hospital use) and not for variables that were unobserved (such as the clinical severity of health conditions). Therefore, it is still possible that the findings were affected by differences in characteristics of the patients.
- A wide range of sensitivity analyses were conducted, confirming that the findings were robust to changes in how impact metrics were defined, the number of CCGs in the donor pool, and the duration of time used to determine the weights for the synthetic control area.
These aspects of the study design were intended to ensure the impact of changes to the delivery of care was isolated, by reducing the possibility that estimated treatment effects were biased by differences in the groups being compared. However, there is still uncertainty about which changes to care delivery the findings reflect. The Improvement Analytics Unit’s main interest was the changes that were made to urgent and emergency care in Northumberland, yet other changes may have been made. To the unit’s knowledge, no other major changes were made in Northumberland CCG in June 2015 that could have explained the increase in A&E visits and reductions in the length of A&E visits, but it is possible that there were changes at hospitals outside of the Northumberland area. As mentioned, around 10% of all A&E visits by the population of Northumberland CCG occur at providers other than Northumbria Healthcare NHS Foundation Trust.
Still another possibility is that there were changes within the CCGs in the donor pool. The unit removed 59 CCGs participating as new care models vanguards, but innovation is also happening elsewhere. That said, the synthetic control areas were formed from several CCGs and this limits the contribution that any one CCG makes towards the findings. Moreover, it is unlikely that changes to national policy affected the relative difference in outcomes between Northumberland CCG and the synthetic control area.
The report considered the changes from the perspective of the Northumberland PACS, and therefore focused on outcomes for people living in the Northumberland CCG. However, Northumbria Healthcare also serves the surrounding areas and, for example, there may have been impacts on people living in North Tyneside that were not captured by this analysis. The report has also been restricted to examining impacts on hospital use, due to limitations with the existing data sets. Ideally, future studies would consider the impact on the use of primary and community care, as well as care processes within the hospital
(such as waiting times for diagnostic tests), clinical outcomes (such as infections), patient outcomes, mortality rates and patient satisfaction. In the absence of these data, care must be taken when interpreting the findings in this report, since shorter lengths of stay or lower admission rates do not always indicate better patient outcomes or lower cost.
There were also limitations in how hospital use was recorded, since it was not possible, for example, to distinguish between admissions to inpatient departments and admissions to ambulatory care units. Northumbria Healthcare records both of these as inpatient admissions in the SUS data, but receives lower reimbursement for the ambulatory care units, reflecting the lower intensity of the care provided. It is possible that reductions in emergency admissions to inpatient departments were missed if these were disguised by increases in the number of admissions to the ambulatory care units, or shifts in the definitions used over time.
‡‡‡ For more information see the technical appendix at: www.health.org.uk/impact-redesign-care-Northumberland
Implications for future work
This report has examined the early impact of an ambitious programme to redesign the delivery of urgent and emergency care. It found that, in the first year, the programme increased A&E visits by 13.6%, yet reduced waiting times in A&E by 14.3 minutes on average. Further evaluations could consider why these changes occurred, and to what extent they reflect improvements in care processes, expansions of the supply of emergency care, or a change in public perception about the quality of care provided at local hospitals. These evaluations – which might draw on interviews with front-line teams and patients – could inform the design of future efforts to improve the quality of care provided.
There are some similarities between the findings from this evaluation and other studies of large-scale changes to the delivery of health care. Evaluations often show that the anticipated impacts of changes materialise only after a long period of time has elapsed, while in the short term there may be unexpected outcomes, as patients and health care professionals respond to the changes in ways that were not fully anticipated from the outset. Additionally, improvements to the availability or perceived quality of health care services are often associated with an increased number of patients seeking those forms of care.
Frequent evaluation can be helpful to monitor the impacts that changes are having, and to inform efforts by local teams to make ‘course correction’. It may therefore be desirable to repeat this quantitative evaluation, in order to assess how patterns of hospital use have continued to evolve since the time period considered in this report. Indeed, the Northumberland PACS is planning changes to primary and community care that may have an impact on the use of emergency and urgent care. The behaviour of the local population might also continue to evolve.
References
- NHS England. Five year forward view. 2014. Available from: www.england.nhs.uk/wp-content/uploads/2014/10/5yfv-web.pdf
- NHS England. Integrated primary and acute care systems (PACS) – Describing the care model and the business model. 2016. Available from: www.england.nhs.uk/wp-content/uploads/2016/09/pacs-framework.pdf
- Health Foundation analysis of data from the Secondary Uses Service for April 2011 to June 2015 [unpublished].
- Health Foundation analysis of Hospital Episode Statistics data [unpublished].
- Health Foundation analysis of Secondary Uses Service Data for 2013/14 and 2014/15 [unpublished].
- Lloyd T, Wolters A, Steventon A. The impact of providing enhanced support for care home residents in Rushcliffe: Health Foundation consideration of findings from the Improvement Analytics Unit. Health Foundation; 2017. Available from: www.health.org.uk/publication/impact-enhanced-support-rushcliffe
- Abadie A, Diamond A, Hainmueller J. Synthetic control methods for comparative case studies: estimating the effect of California’s tobacco control program. Journal of the American Statistical Association. 2010;105(490):493–505. Available from: http://dx.doi.org/10.1198/jasa.2009.ap08746
- Krief N, Grieve R, Hangartner D, Turner AJ, Nikolova S, Sutton M. Examination of the synthetic control method for evaluating health policies with multiple treated units. Health Economics. 2016;25:1,514–28. Available from: http://dx.doi.org/10.1002/hec.3258
- Abadie A, Gardeazabal J. The Economic costs of conflict: A case study of the Basque Country. American Economic Review. 2003;93(1):113–32. Available from: http://dx.doi.org/10.3386/w8478
- Quan H, Sundararajan V, Halfon P, et al. Coding algorithms for defining comorbidities in ICD-9-CM and ICD-10 administrative data. Medical Care. 2005;43(11):1,130–9. Available from: http://dx.doi.org/10.1097/01.mlr.0000182534.19832.83
- HCPU-US. HCUP-US Tools & Software Page for Classifications Software (CCS) for Mortality Reporting. HCaUP editor; 2009.
- NHS RightCare. Reducing unwarranted variation to improve people’s health. NHS England; 2017. Available from: www.england.nhs.uk/rightcare
Acknowledgements
The authors thank the wider Improvement Analytics Unit team, which included Charlene Allen, Sarah Blundell, Richard Brine, Martin Caunt, Geraldine Clarke, Stefano Conti, Caroline Gori, Carlotta Greci, Creina Lilburne, Therese Lloyd, Filipe Santos, Florence Starr, and Emma Vestesson.
The Improvement Analytics Unit reports to an oversight group and has established a technical advisory group. The authors are grateful to members of these groups for their support and advice, as well as to Andrea Brown, Siobhan Brown and Melody Price from NHS Northumberland CCG, and Alastair Beattie and Dr Mike Guy from Northumbria Healthcare NHS Foundation Trust, for their continued support.
Errors or omissions remain the responsibility of the authors alone.