Key points
- Nottingham City Clinical Commissioning Group (CCG) provides an enhanced package of care to its care home residents, aiming to improve health outcomes and the care delivered. This package, whose elements were first introduced in 2007, has since been steadily developed and expanded. By September 2014 the package of care largely consisted of the Dementia Outreach Team, the Care Home Nursing Team, Age UK Nottingham & Nottinghamshire Advocacy, and GP Local Enhanced Support.
- This briefing presents the findings of the evaluation into the effects of providing enhanced support for older people living in a care home in the Nottingham City CCG’s area from September 2014 until April 2017 at which point, as part of NHS England’s new care models programme, a Clinical Pharmacy service and Telemedicine facility were established on top of the existing enhanced package of care. Specifically, the Improvement Analytics Unit examined whether the existing enhanced support had a discernible effect on hospital utilisation for new residents who moved into one of 39 residential and nursing care homes in Nottingham City between September 2014 and April 2017.
- The Nottingham City care home residents were compared with a matched comparison (‘control’) group, which consisted of individuals broadly similar to those in Nottingham City CCG care homes on a range of key characteristics measured prior to the roll-out of the enhanced support and who moved into a care home of a similar type in comparable areas of England.
- The rate of emergency admissions into hospital for Nottingham City care home residents was estimated to be 18% lower compared with the control group. This impact on emergency admissions is even stronger when focusing on emergency admissions relating to conditions which are ‘potentially avoidable’ – for example, through better provision of primary care or community support at an earlier stage in the patient’s care pathway. Nottingham City residents experienced a potentially avoidable emergency admissions rate estimated to be 27% lower compared with the control group.
- There was no discernible difference in the number of Accident & Emergency (A&E) attendances between the Nottingham City care home residents and the control group, although Nottingham City residents had 20% fewer A&E attendances that did not result in admissions compared with the matched comparison group.
- When comparing residents from nursing care homes with residents from residential care homes, we found a significant difference, indicating that the lower rate of hospital activity is driven by residents of residential care homes. Compared to the control group Nottingham City residential care home residents had 34% fewer emergency admissions, 39% fewer potentially avoidable emergency admissions, 20% fewer A&E attendances, and 35% fewer A&E attendances that did not result in admission. We found no statistically significant difference in hospital use between nursing care home residents in Nottingham City compared with the control group.
- Assuming that Nottingham City care home residents and the control group were comparable, the most likely explanation for these findings is that they reflect higher quality of care being delivered to residents of care homes in Nottingham City. The matched comparison group had similar age, gender, health conditions and prior hospital utilisation to the Nottingham City residents, although they may have still differed in unobserved ways.
- The evidence in this briefing indicates that there is potential to reduce emergency admissions to hospital and A&E attendances for care home residents, and reduce pressure on NHS hospitals. Roll-out of the EHCH framework announced in the NHS Long term plan can play an important role in this, and future evaluation of EHCH initiatives can help inform the implementation of these initiatives.
The Improvement Analytics Unit
The Improvement Analytics Unit is an innovative partnership between NHS England and the Health Foundation that provides robust analysis to help health services improve care for patients. We use advanced statistical techniques to provide evidence of whether local change programmes are having an impact on improving the quality and efficiency of care. This is done by assessing whether the care outcomes for patients in a local change programme – for example, as part of a new care model or a sustainability and transformation partnership – are different in any significant way from the outcomes of patients who have not experienced a similar initiative.
Our aim is that our analysis helps NHS providers, their partners and commissioners to identify whether change has happened following implementation of a new initiative, in order to identify whether the initiative is working well or needs to change to succeed.
For more information see: www.health.org.uk/IAU
Background and summary of local intervention
NHS-commissioned initiatives to improve health outcomes and the quality of care for care home residents covered by the Nottingham City Clinical Commissioning Group (CCG) have steadily grown in number since they were first introduced in 2007. In September 2014, this package of care consisted of the Dementia Outreach Team, the Care Home Nursing Team, Age UK Nottingham & Nottinghamshire Advocacy, and GP Local Enhanced Support.
The analysis presented in this briefing evaluated the impact of Nottingham City CCG’s existing enhanced package of care up to April 2017, when, as part of the new care models programme, a Clinical Pharmacy intervention and Telemedicine facility were established on top of the existing enhanced package of care.
In March 2015 Nottingham City CCG, in partnership with local health and social care providers, formed an Enhanced Health in Care Homes (EHCH) vanguard to transform and integrate health and social care in care homes within Nottingham City. This was one of the new care models that was announced in the Five year forward view for the NHS in England.1 The funding from the vanguard allowed Nottingham City CCG to add services to their existing enhanced package: the Clinical Pharmacy intervention and a Telemedicine service. These changes were gradually introduced from December 2016 and were established by May 2017.
Table 1 summarises the support offered through the existing enhanced package of care prior to May 2017. The additional Clinical Pharmacy and Telemedicine services are out of scope for this evaluation.
How were the existing enhanced support services for people living in care homes implemented?
In theory, all vanguard care homes had access to the four services in the existing package of care. However, the Dementia Outreach Team (DOT), the Care Homes Nursing Team (CHNT), Age UK Nottingham & Nottinghamshire Advocacy, and GP Local Enhanced Support (LES) were not all implemented in the same way across the CCG. For example, the CHNT did not cover the whole CCG until 2017. Also, not all GPs and residents engaged in the changes to GP support: some GPs did not want to take on all residents in a care home and some residents did not wish to switch their GP. Nottingham City CCG reports that 62 out of 82 care homes (this includes both vanguard and non-vanguard homes) were aligned to a GP during the study period. Within these 82 care homes just under 50% of the beds were occupied by patients registered with the aligned GP.
Table 1: Summary of the support offered through the existing enhanced package of care
|
Service |
Summary |
|
Dementia Outreach Team |
Providing specialist input and support and training to care homes and people with dementia. Provides case management to care home residents with dementia. Aims to improve quality of life and mental wellbeing. |
|
Care Homes Nursing Team |
Comprising a team of community nurses, advanced nurse practitioners and support workers who work closely with geriatricians. Providing support to and reviews of the needs of residents in residential care homes. Teams also provide advice and support to nursing care homes if necessary. Aims to improve quality of care. |
|
Age UK Nottingham & Nottinghamshire Advocacy |
Residents’ representatives and Worry Catchers offering independent support to residents living in care homes and their families/carers. Aims to reduce social isolation among residents, and empower residents, their families and carers. |
|
GP Local Enhanced Support |
Contractually aligning Nottingham City CCG care homes to one GP practice per care home, providing an enhanced level of care to residents beyond the standard General Medical Services contract, including: fortnightly ward rounds for nursing care homes; monthly ward rounds for residential care homes. Not all care home residents benefited from this service. Aims to ensure consistency of primary care support to care home residents. |
What impact did Nottingham City CCG expect the existing enhanced support to have?
The enhanced package of care in care homes was expected to provide better care coordination and to lead to urgent and emergency care only being utilised by those who need it. In addition, the package would also build better relationships between care homes and professionals (including GPs), reduce isolation among residents and empower residents, their families and carers.
It might be reasonable to expect that the utilisation and implementation of the enhanced support services would vary between care homes due to the differing levels of engagement by care homes, GPs, individual residents and their families and carers.
About this evaluation and analysis
This evaluation was conducted by the Improvement Analytics Unit – a partnership between the Health Foundation and NHS England that aims to provide local teams and national policymakers with robust and timely information on the impact of initiatives to improve care, in order to inform ongoing improvement efforts. The analysis was conducted according to a statistical analysis protocol, which was subjected to independent academic peer review and finalised before the analysis began.
We examined the effect of the existing enhanced package of care predating the new, vanguard-funded services (established by May 2017) on new residents in the nursing and residential care homes considered part of the Nottingham City CCG vanguard that were open during the time. The analysis focused on people aged 65 years or over who moved into one of these care homes between September 2014 and April 2017, referred to hereafter as ‘Nottingham City residents in the study’.
We examined whether the existing enhanced package of support affected care home residents’ hospital use, including the number of A&E attendances and emergency hospital admissions for clinical conditions that were considered to be potentially avoidable. The use of hospital care by Nottingham City residents in the study was compared with a ‘control’ group of individuals, matched on a range of factors as outlined in the ‘Selecting the matched comparison group’ section below. Both groups were followed up for as long as possible after admission to a care home. This analysis is based on data from September 2014 to April 2017, so the follow-up period varied between a minimum of two months and maximum of 31 months, depending on when a patient moved into a care home and for how long they were resident in a care home.
Subgroup analyses were also carried out to ascertain whether the effect on hospital use by care home residents differed based on:
• care home type – nursing or residential (due to known differences in services available between these two care home types)
• patients with a primary or secondary diagnosis of dementia prior to moving into a care home (due to the expectation that the Dementia Outreach Team, which was available to care home residents before the formation of the vanguard, would improve care for residents with a diagnosis of dementia in need of extra support).
Data used in the analysis
The Improvement Analytics Unit has access to pseudonymised data from the Secondary Uses Service (SUS) – a national, person-level database that is closely related to the widely used Hospital Episode Statistics (HES). SUS data contains information on A&E attendances, inpatient admissions and outpatient appointments that are funded by the NHS in England, but unfortunately it does not record accurately whether an individual resides in a care home. Therefore, the unit needed a data set containing information on the residents of care homes, and a method of linking that data to SUS data.
This was assembled by the Arden & Greater East Midlands Data Services for Commissioners Regional Office (Arden & GEM DSCRO), the National Commissioning Data Repository in NHS England and the Improvement Analytics Unit. Care home residents were identified using a combination of monthly care home registry data published by the Care Quality Commission (CQC) and monthly extracts from the National Health Applications and Infrastructure Services (NHAIS) database, which contains a list of individuals registered at each general practice in England, including their residential address and NHS number.
The linked care home and hospital data were analysed by the Improvement Analytics Unit within an accredited secure data environment based at the Health Foundation. At no point did we have access to identifiable data. Throughout, the minimum amount of data necessary for the analysis was used.
Identifying the Nottingham City CCG residents
The study focused on individuals residing in a nursing or residential care home who fulfilled the following criteria:
• registered with a Nottingham City CCG general practice (GP) and moved into care home focusing on care for older residents between September 2014 and April 2017
• not previously resident in a care home in the two years prior to their move in date (as far as could be detected in the data)
• resided in the care home for at least two months
• aged 65 years and over
• experienced a hospital admission within the three years preceding entry to the care home (to ensure information on health conditions was available to inform the selection of an appropriate comparison group).
In addition, where a resident moved from one care home to another during the study period, only the first care home stay was included.
The evaluation only included nursing and residential care homes within Nottingham City CCG’s vanguard that were open for at least a year between September 2014 and April 2017. As a number of the care homes covered by the vanguard were geographically located in neighbouring CCGs, residents of these care homes where less than two-thirds of residents were registered with a Nottingham City CCG GP were excluded from the intervention group.
This study was designed to exclude care homes likely to be genuine specialist care homes while including care homes for older people that are able to accommodate residents with more complex needs or who are younger than 65 years.
Therefore, care homes were excluded from the evaluation if they met both of the following criteria:
• care homes where at least one of the recorded specialities listed in the CQC registry data is: learning disabilities or autistic spectrum disorder; people who misuse drugs and alcohol; people with eating disorders; people detained under the Mental Health Act; people with sensory impairment; and
• care homes that are recorded as catering to additional age groups, other than only those aged 65 and over.
The final sample comprised 782 residents from 15 nursing and 24 residential care homes falling under the remit of Nottingham City CCG, thus participating in the existing enhanced package of care programme.
Selecting the matched comparison group
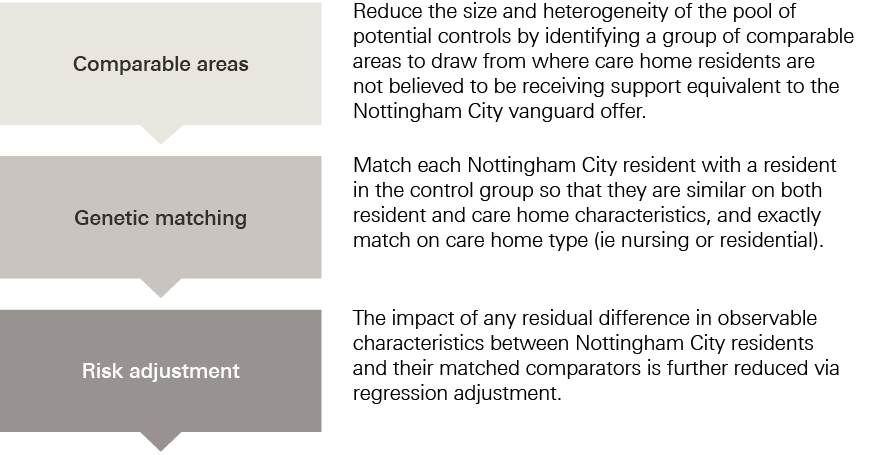
To evaluate the impact of the vanguard's existing enhanced package of care, it was necessary to form a comparison group of care home residents who were as similar as possible to the Nottingham City residents in the study on a range of characteristics observed prior to moving into a care home. The process of forming the control group of care home residents as part of the key stages of the evaluation is illustrated in Figure 1.2
Control group residents were selected from areas that, before the vanguard enhanced support was introduced in Nottingham City, had similar demographic and socioeconomic characteristics and emergency admission rates to Nottingham City.
Figure 1: Diagram of key stages of the evaluation
Annual rates of hospital admission in the Nottingham City CCG before the enhanced support was introduced were slightly below the national average (1,016 emergency admissions for every 10,000 Nottingham City residents vs 1,025 for England as a whole in 2014/15). The nine areas ultimately found to be most similar to Nottingham City CCG according to the above criteria were: Southampton CCG, Portsmouth CCG, Birmingham South and Central CCG, Leicester City CCG, Wolverhampton CCG, Hillingdon CCG, Hull CCG, Greenwich CCG and Waltham Forest CCG. The average emergency admission rate in 2014/15 across these control areas was 1,068/10,000 residents.
While some of these areas may have been implementing changes to improve care for people living in care homes, to the best of our knowledge none were offering area-wide interventions targeted at care home residents of a scale and scope similar to Nottingham City’s existing enhanced package of care during the period concerned. Furthermore, since the control group comprised care home residents from multiple areas, the potential of each selected area to introduce significant bias was reduced.
The same inclusion and exclusion criteria used to select Nottingham City residents in the study were also applied to care home residents in the selected comparable areas, giving a pool of potential controls consisting of 5,421 people from 252 care homes in the nine comparable areas. From these 5,421 residents, a matched control group was identified that was similar to the Nottingham City residents in the study on the following characteristics:
• at care home level: the number of beds in the care home; whether the care home was registered with the CQC as a nursing or residential home; whether the care home was registered as caring for additional population groups in addition to older people; whether the care home was in a rural or urban setting; and the socioeconomic deprivation level of the local area
• at residents’ level: age; gender (male or other); ethnicity (white, non-white, unknown); number and type of health conditions associated with frailty; diagnoses in the three years before moving into a care home predictive of hospital admission (eg myocardial infarction, complicated diabetes and chronic obstructive pulmonary disorder) or of mortality (Charlson Index); and hospital utilisation including numbers of emergency admissions, potentially avoidable admissions, nights in hospital, A&E attendances, elective admissions and outpatient admissions prior to moving into a care home.
When selecting controls, we did not use data on events that occurred following the admission to the care home, since this could have biased our findings. We assessed whether the matched control residents had similar mortality rates to control residents as a check for unmeasured differences between the groups. As we did not expect the existing enhanced package of care to affect death rates, a difference in death rates might suggest unmeasured differences between the groups. We also verified that residents in the two groups spent a similar amount of time in our study.
We paired residents in nursing homes in Nottingham City with control individuals living in nursing homes in the comparable areas, and likewise residents in residential homes with controls living in residential homes. One matched control group resident was selected for each Nottingham City resident, yielding a sample of 782 residents from 230 care homes in the control group.
Comparisons of secondary care outcomes between the Nottingham City residents and the matched comparison group were made using multivariable regression. The regression models adjusted for the differences that remained after matching between the two groups in prior hospital use and other observed baseline characteristics such as age distribution, seasonality and number and type of comorbidities. Matching and regression generally perform better in combination than separately.3 The regression models produced a ‘best estimate’ of the relative difference in the examined hospital utilisation outcome between the Nottingham City residents and the matched comparison group, together with a 95% confidence interval.
The same procedure was followed in subgroup analyses, for which the total population was divided into groups according to care home type (residential or nursing) and patients with a diagnosis of dementia prior to moving into a care home.
Outcome measures
Once a matched group of control care home residents was satisfactorily formed, the Improvement Analytics Unit proceeded with comparing hospital activity between the two groups. For this purpose, the following nine primary and secondary outcomes were analysed:
Primary outcomes:
• number of A&E attendances
• number of emergency admissions.
Secondary outcomes:
• number of A&E attendances not resulting in admission
• number of ‘potentially avoidable’ emergency admissions, based on a list of conditions considered to be manageable in community settings or preventable through good quality care (see Box 1)
• number of total hospital bed days, excluding same-day admissions
• number of total bed days following emergency admissions (ie total number of bed days across all emergency admissions), excluding same-day admissions
• number of elective admissions
• number of outpatient attendances (ie excluding appointments that the patient did not attend)
• proportion of deaths that took place outside hospital (as a proxy for dying in preferred place of death).
|
Box 1: Conditions for which we considered emergency admissions to be potentially avoidable |
|
The analysis included potentially avoidable emergency admissions, which are customarily attributed to conditions that are often manageable, treatable or preventable in community settings without the need to go to hospital, as well as those that may be caused by poor care or neglect. These were: • acute lower respiratory tract infections, such as acute bronchitis • chronic lower respiratory tract infections, such as emphysema • diabetes • food and drink issues, such as abnormal weight loss and poor intake of food and water, possibly due to neglect • fractures and sprains • intestinal infections • pneumonia • pneumonitis (inflammation of lung tissue) caused by inhaled food or liquid • pressure sores • urinary tract infections. To calculate the number of potentially avoidable emergency admissions, we counted hospital admissions with one of these conditions listed as the primary diagnosis for an admission to hospital. Note, however, that this list of conditions was originally intended to be applied to the general population aged 65 or over, rather than to care home residents.4 Note also that sometimes individuals will still need to be admitted to hospital for these conditions independently of the availability of suitable out-of-hospital care (as is perhaps the case with individuals suffering from multiple co-morbidities) and regardless of the quality of the care offered in the care home. The metric is therefore not perfect, but we would expect the enhanced package of support to show greater impact on reducing the risk of hospital admission for these conditions than for others. |
Hospital activity was measured for the period during which individuals were resident in care homes, counted from the month they moved into the care home to the month that they died or left the care home (or April 2017, if sooner). This analysis is based on data from September 2014, which is when we assumed that initiatives making up the enhanced package of care offered by Nottingham City CCG (see Table 1) became operational, to April 2017. Individuals were followed up for their whole duration of stay in the care home since their admission, with a minimum follow-up period of two months and maximum of 31 months.
* Pseudonymised data sets have been stripped of identifiable fields, such as name, full date of birth and address. However, a unique person identifier (such as an NHS number) has been replaced with a random identifier. For this analysis, the random identifier was used to link together hospital records for the same individual over time.
† In total across 2016–17 and 2017–18, there were 53 separate care homes in the vanguard. Originally there were 51 care homes in the target population but during the period three care homes closed and two new care homes opened. This means that at any one time in the period there were no more than 53 care homes in the target population.2 Using Care Quality Commission care home data we identified 53 care homes after applying exclusion criteria. Of these, seven care homes were excluded as they were not open for at least a year during the study period and we were unable to identify residents in a further seven of the care homes due to limitations to the data linkage methodology.
‡ Rural Urban Classification (2011) based on the Lower Layer Super Output Area of the care home.
§ English Index of Multiple Deprivation (2015) based on the Lower Layer Super Output Area of the care home.
¶ Same-day admissions are when the patient is admitted and discharged on the same day and therefore have a zero length of stay.
** Elective admissions are defined as those that are ‘ordinary’ (requiring the use of a hospital bed overnight) or day case (no use of a hospital bed overnight) admissions but exclude maternity and regular, scheduled day/night cases (eg regular dialysis appointments).
†† Primary diagnosis for a hospital admission was taken from the first consultant episode of the hospital spell.
Results
Residents in the matched control group had broadly similar characteristics to Nottingham City residents in the study
After matching, the control group was found to be broadly similar to the Nottingham City residents in the study across the range of individual and care home characteristics considered (see Figure 2). In particular:
• Mean follow-up time of a resident in the study was similar across the groups: 333 days (standard deviation 245 days) for Nottingham City residents; 336 days (standard deviation 236 days) for matched control residents.
• Mortality rates (how many residents died in each group) were similar: 309 (39.5%) Nottingham City residents died during the study period, compared to 298 (38%) of matched control residents.
• Average age was 86 years for Nottingham City residents (range 80–90 years) compared to 85 years for the matched control residents (range 79–90 years).
• Average number of health conditions linked to frailty was 2.17 (standard deviation 1.40) for Nottingham City residents compared to 2.14 (1.31) for matched control residents.
• Average number of emergency admissions in prior year was 1.68 (standard deviation 1.62) for Nottingham City residents compared to 1.62 (1.38) for matched control residents.
Table 2 compares the Nottingham City residents in the study, the matched control group and the full pool of potential controls at baseline. The broad profile of conditions is similar between the groups. Some residual difference remained between groups, notably on outpatient and missed outpatient appointments in prior year and some frailty diagnoses (dementia, cognitive impairment, anxiety/depression, dependence, pressure ulcers) and other morbidities (cognitive dysfunction, peripheral vascular disease). However, the differences were not significant enough to undermine the results and any outstanding dissimilarities at least on observable characteristics were subsequently addressed via the risk-adjusted analysis outlined in Figure 1.
Figure 2: Percentage of Nottingham City residents and matched control residents with certain health conditions
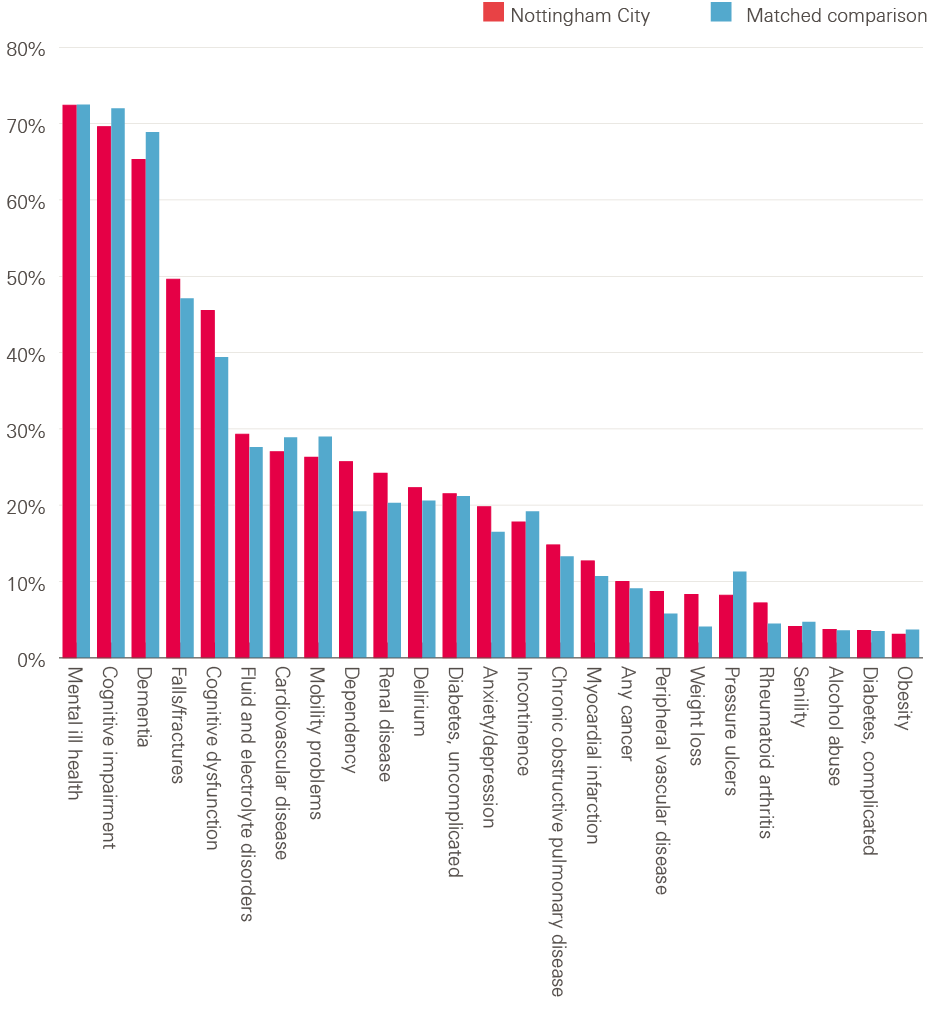
Note: the figure is based on the diagnoses recorded on the inpatient record during the three years prior to moving to the care home.
Source: analysis by the Improvement Analytics Unit
Table 2: Baseline characteristics before and after matching
|
Variable |
Potential controls |
Matched comparison |
Nottingham City |
|
Total number of unique records |
5421 |
782 |
782 |
|
Total number of records |
5421 |
782 |
782 |
|
Age |
85.00 [80.00, 90.00] |
85.00 [80.00, 90.00] |
86.00 [79.00, 90.00] |
|
Male |
37.2 |
36.6 |
38 |
|
Ethnicity – White |
86.5 |
86.8 |
85.3 |
|
Ethnicity – Other |
6.3 |
6.4 |
5.2 |
|
Hospital utilisation |
|||
|
Emergency admissions in prior year |
2.06 (1.81) |
1.62 (1.38) |
1.68 (1.62) |
|
Emergency admissions in year before prior year |
0.78 (1.43) |
0.68 (1.22) |
0.67 (1.20) |
|
A&E attendances in prior year |
2.41 (2.28) |
1.89 (2.21) |
2.06 (3.27) |
|
A&E attendances in year before prior year |
1.08 (2.18) |
1.02 (3.34) |
0.90 (3.20) |
|
Emergency bed days in prior year |
36.38 (40.22) |
27.42 (34.27) |
29.35 (35.90) |
|
A&E attendances that did not result in admission in prior year |
0.78 (1.32) |
0.57 (1.57) |
0.66 (2.54) |
|
Potentially avoidable emergency admissions in prior year |
0.62 (0.97) |
0.48 (0.72) |
0.49 (0.85) |
|
Ordinary elective admissions in prior year |
0.27 (0.88) |
0.23 (0.97) |
0.31 (1.18) |
|
Outpatient appointments in prior year |
3.15 (5.44) |
2.53 (4.21) |
3.02 (4.63) |
|
Missed outpatient appointments in prior year |
0.56 (1.20) |
0.31 (0.72) |
0.42 (0.93) |
|
Average length of stay following emergency admissions in prior year |
19.56 (23.14) |
16.13 (18.96) |
15.98 (18.94) |
|
Table 2 continued |
|||
|
Variable |
Potential controls |
Matched comparison |
Nottingham City |
|
Dementia (analysis specific) |
54.3 |
60.5 |
53.8 |
|
Charlson Index |
2.44 (1.84) |
2.40 (1.69) |
2.41 (1.83) |
|
Number of frailty co-morbidities |
2.26 (1.41) |
2.14 (1.31) |
2.17 (1.40) |
|
Frailty co-morbidities |
|||
|
Anxiety/depression |
18 |
16.5 |
19.8 |
|
Cognitive impairment |
69.3 |
72 |
69.6 |
|
Delirium |
20.5 |
20.6 |
22.3 |
|
Dementia (frailty definition) |
63.9 |
68.9 |
65.3 |
|
Dependency |
19.9 |
19.2 |
25.7 |
|
Falls/fractures |
51.4 |
47.1 |
49.6 |
|
Incontinence |
19.8 |
19.2 |
17.8 |
|
Mobility problems |
33.1 |
29 |
26.3 |
|
Pressure ulcers |
13.9 |
11.3 |
8.2 |
|
Senility |
4.5 |
4.7 |
4.1 |
|
Other co-morbidities |
|||
|
Alcohol abuse |
3.7 |
3.6 |
3.7 |
|
Any cancer |
10.7 |
9.1 |
10 |
|
Cardiovascular disease |
33.2 |
28.9 |
27 |
|
Chronic obstructive pulmonary disease |
15 |
13.3 |
14.8 |
|
Dementia (Charlson definition) |
53.6 |
59.8 |
53.2 |
|
Diabetes, complicated |
3.4 |
3.5 |
3.6 |
|
Diabetes, uncomplicated |
21.8 |
21.2 |
21.5 |
|
Fluid and electrolyte disorders |
29.3 |
27.6 |
29.3 |
|
Mental ill health |
70.3 |
72.5 |
72.4 |
|
Cognitive dysfunction |
42.1 |
39.4 |
45.5 |
|
Myocardial infarction |
13.7 |
10.7 |
12.7 |
|
Obesity |
3.8 |
3.7 |
3.1 |
|
Peripheral vascular disease |
8.1 |
5.8 |
8.7 |
|
Renal disease |
20.3 |
20.3 |
24.2 |
|
Rheumatoid arthritis |
5.7 |
4.5 |
7.2 |
|
Weight loss |
6.2 |
4.1 |
8.3 |
Source: analysis by the Improvement Analytics Unit
Statistically significant reductions in some measures of emergency hospital use were detected for Nottingham City care home residents
Figure 3 shows trends in hospital utilisation over time. For each chart, the horizontal axis represents time in the study (with quarterly increments), and entry into a care home is set at time zero. The vertical axis shows the mean rate of a given outcome for each corresponding quarter for Nottingham City residents in the study and matched control group residents before and after moving to a care home.
As would be expected, given the matching process, both Nottingham City and matched control residents in the study experienced broadly similar (possibly with the exception of elective admissions and outpatient attendances) rates of emergency hospital activity before moving into care homes (the left-hand panel within each chart). The right-hand side shows that, following moving to the care home, the Nottingham City residents in the study appeared to use generally less hospital care than the matched comparison group for certain types of emergency hospital activity. The regression modelling aimed to quantify how different these patterns were, when adjusting for the residual differences between the two groups in prior hospital use, as well as other baseline characteristics.
Figure 3: Rates of emergency hospital use over time.
Numbers alongside the horizontal axis indicate the number of Nottingham City care home residents who remain in the study each study quarter. The dotted line denotes entry into a care home.
 Nottingham City Matched comparison
Nottingham City Matched comparison
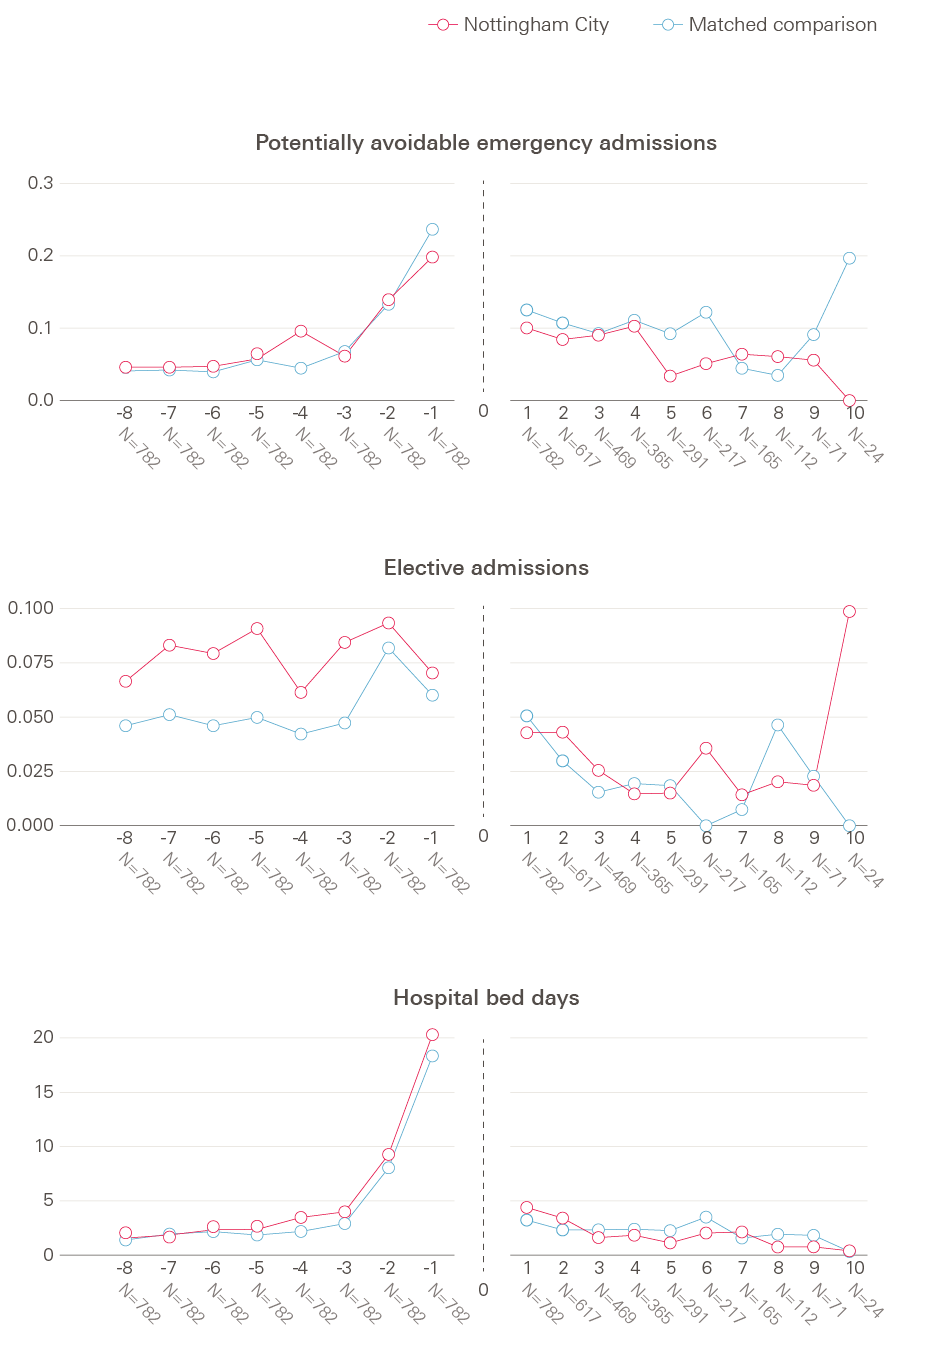
Source: analysis by the Improvement Analytics Unit
Table 3 compares the relative rate estimates for emergency hospital use between the intervention and matched control groups. After moving into a care home, Nottingham City residents in the study experienced 0.85 emergency admissions each year on average, compared with 0.97 for the matched control residents. After regression adjustment, Nottingham City residents experienced 18% fewer emergency admissions than the matched control group. The 95% confidence interval spanned 30% lower to 5% lower so it seemed that there were statistically significantly fewer emergency admissions for Nottingham City residents than the matched control group.
Table 3: Comparison of the rate of emergency hospital use between groups
|
Measure |
Crude rate (number per person per year) |
Relative difference (adjusted rate ratio) |
95% confidence interval |
p-value |
|
|
Nottingham City residents |
Matched comparison residents |
||||
|
Emergency admissions |
0.85 |
0.97 |
18% lower |
30% lower to 5% lower |
0.007 |
|
Potentially avoidable emergency admissions |
0.33 |
0.42 |
27% lower |
41% lower to 11% lower |
0.002 |
|
A&E attendances |
1.43 |
1.38 |
5% lower |
17% lower to 8% higher |
0.397 |
|
A&E attendances that did not result in admission |
0.57 |
0.58 |
20% lower |
34% lower to 3% lower |
0.024 |
|
Hospital bed days following admission |
9.8 (21.9) |
9.5 (26) |
22% higher |
14% lower to 54% higher |
* |
|
Hospital bed days following an emergency admission |
8.0 (17.1) |
9.0 (25.1) |
6% higher |
26% lower to 33% higher |
* |
Note: * = no p-values are available for these outcomes, as the confidence interval for the intervention effect was calculated using bootstrap methodology.
Source: analysis by the Improvement Analytics Unit
Nottingham City residents in the study experienced 0.33 potentially avoidable admissions per person per year, compared with 0.42 for matched control residents. After adjustment, there were 27% fewer potentially avoidable admissions among the Nottingham City group compared to the matched control residents. The 95% confidence interval spanned 41% lower to 11% lower so, again, it seemed that there were statistically significantly fewer potentially avoidable emergency admissions for Nottingham City residents than the matched control group.
Nottingham City residents in the study experienced an average of 1.43 A&E attendances per year after moving into a care home compared with 1.38 attendances for matched control residents. After adjustment, there were 5% fewer A&E attendances among the Nottingham City residents. However, the 95% confidence interval indicates the true value is likely to be between 17% lower to 8% higher, so this finding is not statistically significant at a 95% confidence level.
A statistically significant reduction (20% lower) was detected, after adjustment, for A&E attendances that did not result in an emergency admission (unadjusted averages of 0.57 and 0.58 for Nottingham City and matched control residents respectively). The 95% confidence interval indicates the true value is likely to be between 34% lower to 3% lower.
Examined Nottingham City residents spent on average 9.8 days in hospital during the study follow-up compared to the 9.5 days observed among matched control residents (standard deviation of 21.9 and 26 respectively). After adjustment, 22% more days were estimated to be spent in hospital by Nottingham City residents compared to matched control residents; however, this increase appeared not to be statistically significant as its 95% confidence interval ranged from 14% fewer to 54% more bed days. The same conclusion was reached about hospital bed days prompted by an emergency admission. On average Nottingham City residents spent eight days in hospital during the study period compared to the nine days among matched control residents (standard deviation of 17.1 and 25.1 respectively). After adjustment Nottingham City residents were found to spend 6% more days in hospital following an emergency admission but with a 95% confidence interval ranging from 26% fewer to 33% more bed days, compared to matched control residents.
Nottingham City residents might have been less likely to die in hospital than matched control residents but evidence was inconclusive
Of the residents who died, a smaller percentage of Nottingham City residents died in hospital (29.4%) than matched control residents (35.9%). After adjustment, Nottingham City residents were 27% less likely to die in hospital (95% confidence interval: 49% lower to 4% higher). Although this finding might indicate that Nottingham City residents were better supported in dying in their preferred place of death, the confidence interval shows this result was not conclusive, as the proportion of patients who died in hospital could have been up to 4% higher than the matched comparison patients.
A statistically significant difference in elective admissions and outpatient appointments for Nottingham City residents was not detected
Nottingham City residents in the study experienced 0.13 ordinary elective admissions per person per year on average, compared with 0.11 for matched control residents. After adjustment, there were 13% more ordinary elective admissions among the Nottingham City group compared to the matched control residents. However, this finding is not statistically significant at a 95% confidence interval as the true value is likely to be between 24% lower to 67% higher.
There was no evidence that the number of acute outpatient attendances differed between Nottingham City and matched control residents (2.06 attendances for Nottingham City residents, 1.65 attendances for matched control residents, rate ratio 1.02, 95% CI 0.86, 1.21).
Statistically significant reductions in emergency hospital use were detected for Nottingham City residents living in residential care homes
We conducted subgroup analyses to determine the impact of the intervention on hospital use for residents of care homes where nursing care was provided (‘nursing care homes’) and, separately, assessed the impact on residents of care homes where no nursing care is provided by the home (‘residential care homes’).
Nottingham City residents living in residential care homes had statistically significantly lower numbers than matched control group residents living in residential care homes of emergency admissions (34% fewer), potentially avoidable emergency admissions (39% fewer), A&E attendances (20% fewer) and A&E attendances that did not result in an emergency admission (35% fewer). See Table 4 for crude rates, adjusted rates and confidence intervals. No statistically significant differences were observed in the number of hospital bed days, whether total (estimated as 12% more among Nottingham City residents but with a 95% confidence interval of 49% lower to 35% higher) or following an emergency admission only (estimated as 5% more among Nottingham City residents but with a 95% confidence interval of 54% lower to 24% higher), between nursing and residential care homes when comparing Nottingham City and matched control residents.
Table 4: Comparison of the rate of emergency hospital use between groups for residents living in residential homesNote: * = no p-values are available for these outcomes, as the confidence interval for the intervention effect was calculated using bootstrap methodology.
|
Measure |
Crude rate (number per person per year) |
Relative difference (adjusted rate ratio) |
95% confidence interval |
p-value |
|
|
Nottingham City residents |
Matched comparison residents |
||||
|
Emergency admissions |
0.74 |
1.02 |
34% lower |
47% lower to 18% lower |
<0.001 |
|
Potentially avoidable emergency admissions |
0.27 |
0.41 |
39% lower |
54% lower to 18% lower |
<0.001 |
|
A&E attendances |
1.42 |
1.51 |
20% lower |
33% lower to 4% lower |
0.012 |
|
A&E attendances that did not result in admission |
0.65 |
0.71 |
35% lower |
50% lower to 16% lower |
<0.001 |
|
Hospital bed days |
8.5 (19.3) |
9.1 (18.8) |
12% higher |
49% lower to 35% higher |
* |
|
Hospital bed days following an emergency admission |
7.5 (17.5) |
8.4 (17) |
5% higher |
54% lower to 24% higher |
* |
Source: analysis by the Improvement Analytics Unit
There was no statistically significant evidence of any difference between Nottingham City and matched control residents of nursing care homes in terms of emergency hospital use. See Table 5 for crude rates, adjusted rates and confidence intervals.
Table 5: Comparison of the rate of emergency hospital use between groups for residents living in nursing homes
|
Measure |
Crude rate (number per person per year) |
Relative difference (adjusted rate ratio) |
95% confidence interval |
p-value |
|
|
Nottingham City residents |
Matched comparison residents |
||||
|
Emergency admissions |
0.97 |
0.92 |
1% lower |
20% lower to 23% higher |
0.955 |
|
Potentially avoidable emergency admissions |
0.39 |
0.43 |
15% lower |
37% lower to 14% higher |
0.258 |
|
A&E attendances |
1.45 |
1.24 |
11% higher |
9% lower to 34% higher |
0.294 |
|
A&E attendances that did not result in admission |
0.49 |
0.43 |
8% higher |
20% lower to 46% higher |
0.592 |
|
Hospital bed days |
11.1 (24.4) |
9.9 (31.9) |
47% higher |
3% lower to 109% higher |
* |
|
Hospital bed days following an emergency admission |
8.6 (16.8) |
9.5 (31.5) |
21% higher |
19% lower to 85% higher |
* |
Note: * = no p-values are available for these outcomes, as the confidence interval for the intervention effect was calculated using bootstrap methodology.
Source: analysis by the Improvement Analytics Unit
A statistically significant lower proportion of Nottingham City residents living in residential care homes died in hospital
Of the residential care home residents who died, a smaller percentage of Nottingham City residential care home residents died in hospital (26.6%) than matched control people living in residential homes (42.8%). After adjustment, people in Nottingham City residential care homes were 51% less likely to die in hospital (95% confidence interval: 72% lower to 17% lower).
There was no statistically significant evidence of any difference between Nottingham City and matched control residents of nursing care homes in terms of the proportion of residents who died in hospital. 21.8% of Nottingham City nursing home residents died in hospital compared to 30% of control nursing home residents. After adjustment, there was no overall effect with a 95% confidence interval between 39% lower to 66% higher.
Nottingham City residents living in residential care homes had a statistically significant higher rate of outpatient attendances
People living in Nottingham City residential care homes in the study experienced 2.03 outpatient attendances per person per year, compared with 1.40 for matched control residents. After adjustment, there were 30% more estimated outpatient attendances among the Nottingham City residential care home group compared to people in the matched control group living in a residential care home. The 95% confidence interval indicates a range of 4% higher to 63% higher.
People living in Nottingham City nursing homes in the study experienced 2.09 outpatient attendances per person per year, compared with 1.94 for matched control residents. After adjustment, there were 17% fewer estimated outpatient attendances among the Nottingham City nursing care home group compared to people in the matched control group living in a nursing home. However, the 95% confidence interval indicates a range of 36% lower to 6% higher indicating that the result was not significant at a 95% confidence interval.
There was no statistically significant difference between people in Nottingham City and matched control group residential care homes in terms of numbers of ordinary elective admissions. Nor was there any statistically significant difference between people in Nottingham City and matched control group nursing homes in terms of numbers of ordinary elective admissions.
Statistically significant reductions in some measures of emergency hospital use were detected for Nottingham City care home residents with a diagnosis of dementia
We conducted a subgroup analysis to determine the impact of the intervention on hospital use for care home residents who had previously been diagnosed with dementia in hospital. We found no evidence to suggest that the impact of the enhanced package of care differs between dementia and non-dementia patients. Findings for care home residents with dementia are very similar to those for all care home residents (results not shown).
Interpretation of the findings
Older people living in care homes covered by the Nottingham City existing enhanced package of support, when compared to a matched control group, were admitted to hospital as an emergency 18% less frequently and for potentially avoidable emergency admissions 27% less frequently. In addition, there is an indication that Nottingham City care home residents also attended A&E departments less often than the matched control group, although we cannot rule out that this is not due to chance.
The findings in this analysis are similar to those of the evaluation of the impact of providing enhanced support for care home residents in Rushcliffe.5 This was not surprising, as both models of care have some broadly similar characteristics, namely improved support from community nurses, independent advocacy and support from the third sector and regular visits from named GPs. Indeed, the results of this evaluation appear to confirm Nottingham City CCG’s expected outcomes and support the view that a robust enhanced care package was in place in Nottingham City prior to the Clinical Pharmacy intervention and Telemedicine service being fully implemented in May 2017 as part of the EHCH vanguard.
Nottingham City CCG reported that across the whole of the Greater Nottingham area the establishment of CCGs resulted in a more active interaction between commissioners and health services than had previously been the case, through a greater emphasis on joint working and integration of services. The findings from the evaluations of Rushcliffe (a mixed rural and urban area) and Nottingham City (an urban area) suggest that the two similar interventions applied in different contexts are producing similar impact. Since it is unlikely that the local hospital is doing anything different for patients who are residents of care homes, it would also be unlikely that the intervention impact is driven by the care offered by the provider.
We conducted subgroup analysis based on care home type (nursing or residential). Statistically significant differences in hospital activity for Nottingham City nursing home residents were not detected, whereas residents living in residential care homes had statistically significantly lower numbers of emergency admissions (34% fewer), potentially avoidable emergency admissions (39% fewer), A&E attendances (20% fewer) and A&E attendances that did not result in an emergency admission (35% fewer).
We conducted interaction tests to ascertain if the differences in outcomes for Nottingham City residents of nursing homes were significantly different compared to Nottingham City residents in residential care homes. When comparing the two groups, nursing home residents had 49% more emergency admissions (95% confidence interval between 10% higher and 102% higher) and 35% more A&E attendances (95% confidence interval between 4% higher and 76% higher). There was also an indication that nursing home residents in Nottingham City had higher rates of avoidable emergency admissions (36% higher) and higher rates of A&E attendances that did not result in admission (46% higher). The confidence intervals (between 1% lower and 117% higher and between 10% lower and 105% higher respectively) mean that we cannot be confident that these estimates are significant at a 95% level. Additionally, neither of the examined length of hospital stay outcomes showed a statistically significant difference by care home type between Nottingham City and matched control residents. Taking the subgroup analysis and interaction test findings as a whole it appears that the effect for patients in residential care homes is driving the overall effect.
Nottingham City CCG reported that the enhanced package of care that existed before May 2017 had a clear focus on residential homes. The clinical care provided by the CHNTs is predominantly supporting residents in residential homes. It should be noted that some nursing homes provide residential care with extra support but are classified as nursing homes within our analysis. Many nursing care homes in Nottingham City have both residential and nursing residents. However, the nursing care teams did not focus on residents in these homes occupying a nursing bed. There is no ability within the CQC data to differentiate between nursing and care home beds and therefore this was not something we were able to address in the analysis, nor did we try to establish which elements of the overall package of care were specifically contributing to the improved outcomes.
It could be that the clinical aspect of the intervention going into the residential care homes has helped drive the results, whereas there is no effect in nursing homes because the clinical expertise there is already in place. However, it could also be that nursing home residents are benefiting less from the existing enhanced package of care than residents in residential homes due to the complexities of residents’ health in the former facilities. A possible explanation for the reduction in A&E attendances in residential care homes could be that the intervention increased the confidence of residential care home staff to manage problems with the residents’ health and/or gave staff additional resources they could draw on, such as speaking to a GP or community nurse for assurance. The reduction in A&E rates for residential care home residents is an important finding as a trip to A&E can be a big strain for residents who tend to be frail and their families.
We conducted a subgroup analysis to determine the impact of the intervention on hospital use for care home residents who had previously been diagnosed with dementia in hospital. We found no evidence to suggest that the impact of the enhanced package of care differs between dementia and non-dementia patients. Findings for care home residents with dementia are very similar to those for all care home residents.
We found that a statistically significantly lower proportion of Nottingham City residents living in residential care homes died in hospital (51% lower). This may be due to the access to nurses. There were also strong indications of lower proportions of deaths in hospital for residents with dementia (37% lower, 95% confidence interval 61% lower to 2% higher) and all residents (27% lower, 95% confidence interval 49% lower to 4% higher). Deaths out of hospital can be indicative of better end-of-life quality and planning. Residents often prefer to die out of hospital. End-of-life care is a long-established part of the community services provided to care homes in Nottingham City.
These findings require careful interpretation, informed by a discussion of the strengths and limitations of the analysis. By linking data sets together, we were able to study the hospital records for a large number of care home residents, without the problems with non-response that can occur with other data collection methods such as surveys. However, we restricted our attention to new care residents, and it is possible that the evaluation is missing a different effect from those who have lived in a care home for a longer period. We might also have missed some new residents due to limitations of the method used to identify residents and link the data sets together, though there are no indications that this would have systematically affected the results.
In the absence of randomisation, as is typically the case with observational studies like this evaluation, residents of the participating care homes were compared with a retrospectively matched control group. These two groups had similar age, gender, health care conditions and previous hospital utilisation profiles, and they lived in care homes that were similar in terms of size and provision of nursing care. Moreover, the matched control residents lived in local authority areas that were comparable to Nottingham City in terms of demographic and socioeconomic characteristics and historic per capita rates of emergency hospital admission. Notwithstanding these similarities, unmeasured differences may have existed between the Nottingham City residents and the matched control group, for example, in the availability of informal care support or local authority funding. These unmeasured differences might explain some or all of the differences we observed in the utilisation of emergency care. However, although we cannot be definitive, some reassurance is available. For example, the Nottingham City and matched control groups had similar mortality rates, suggesting neither group had more severe pre-existing health conditions than the other; the two groups appeared rather similar even before matching, which might mean there was limited scope for bias through unobserved variables.
If the lower use of emergency care among Nottingham City care home residents does not reflect differences in the characteristics of individuals, care homes or areas, then the most likely explanation is that it reflects the care provided to care home residents. We could not determine definitively whether the existing enhanced package of support produced the lower levels of emergency care utilisation we observed, or if this was due to some other innovation in care delivery, because of limitations of the data which prevent the identification of residents moving into care homes before the existing enhanced package of support was introduced. A ‘difference-in-difference’ style analysis would reveal whether the reductions in emergency care utilisation occurred at the same time as the introduction of the enhanced package of support, potentially leading to stronger evidence about attribution.6 However, a difference-in-difference analysis could not be conducted in this study because it would rely on the verification of parallel trends in outcome levels over time in the pre-intervention period, which was not possible due to the unavailability of data on care home residents prior to the introduction of the enhanced package of support. We were only able to ascertain which care home residents were new residents from September 2014 onwards, well after elements of the existing enhanced package of care were introduced.
Implications and priorities for future work
A single evaluation can only provide so much information, and the findings presented in this briefing need to be seen in light of other evidence locally, and the broader literature. However, assuming that the Nottingham City care home residents and the control group were comparable, the most likely explanation of the findings is that they reflect higher quality of care for residents of care homes in Nottingham City. This is particularly the case for residents of residential care homes, as the observed reduction in hospital activity is driven by this subgroup. These findings are similar to those found for other initiatives aimed at providing enhanced care in care homes.7
These findings relate to the enhanced package of care that was already in place when Nottingham City CCG became a EHCH vanguard in May 2015. Additional services were gradually introduced from December 2016, including a Clinical Pharmacy intervention and Telemedicine service, which are out of scope for this evaluation.
The evidence in this briefing indicates that there is potential to reduce emergency admissions to hospital and A&E attendances for care home residents, and reduce pressure on NHS hospitals. Roll-out of the EHCH framework announced in the NHS Long term plan can play an important role in this, and future evaluation of EHCH initiatives can help inform the implementation of these initiatives.