Key points
- GP practices serving more socioeconomically deprived patient populations receive similar funding per registered patient to those serving less deprived patient populations. Once these populations are adjusted to account for increased workload associated with greater health needs in poorer areas, practices serving more deprived populations receive around 7% less funding per need adjusted registered patient than those serving less deprived populations.
- There are fewer GPs per head of need adjusted population in deprived areas than in affluent areas, but more practice nurses. This suggests a lower supply of doctors in deprived areas and a possible substitution of nurses for doctors in these areas. After accounting for different levels of need, a GP working in a practice serving the most deprived patients will on average be responsible for the care of almost 10% more patients than a GP serving patients in more affluent areas.
- GP practices serving patients who live in more deprived areas tend to be smaller (have fewer GPs) than those serving patients living in less deprived areas – with single-handed practices particularly over-represented among practices serving patients living in the most deprived fifth of neighbourhoods.
- Regardless of the level of deprivation in their area, patients have a similar probability of having an appointment at their GP practice. Patients attending practices serving more deprived populations are less likely to have an appointment with a GP and more likely to have an appointment with a nurse than those visiting practices serving less deprived populations. Practices serving more deprived populations also deliver fewer telephone appointments than those serving less deprived populations.
- GP practices serving more deprived patient populations on average earn fewer quality and outcomes framework (QOF) points, have worse Care Quality Commission (CQC) ratings and lower patient satisfaction scores than practices serving less deprived populations. These measures of assessing quality may themselves be affected by deprivation (for example increased patient deprivation may make it harder to achieve high QOF scores). Further research is needed across other aspects of quality to explore whether patients living in more deprived areas receive a systematically lower quality of care.
* Measuring health need directly is not possible. In our analysis we use workload as a proxy for need. This has limitations, but is consistent with the methodology used in the Carr-Hill resource allocation formula for general practice.
Introduction
‘The availability of good medical care tends to vary inversely with the need for it in the population served. This inverse care law operates more completely where medical care is most exposed to market forces, and less so where such exposure is reduced.’ Julian Tudor Hart, 1971.
This briefing seeks to explore the extent to which the inverse care law, as defined by the British GP Julian Tudor Hart, still applies to general practice in England nearly 50 years on from its first description.
Ensuring equal access for equal need is a fundamental principle of the NHS, but need for health care is not equally distributed across the country. People living in socioeconomically deprived areas are at greater risk of having multiple health conditions, and are likely to have multiple conditions at younger ages. Life expectancy and healthy life expectancy (the number of years lived in self-assessed good health) are also lower in areas of high deprivation. In 2017, healthy life expectancy at birth was on average 12 years lower for people living in the most deprived local authority areas in England as compared to the least.
These health inequalities are likely to have been magnified by the coronavirus (COVID-19) pandemic., Morbidity and mortality from COVID-19 in England have followed a socioeconomic gradient, with highest illness and highest death rates in the most deprived areas. Deprived communities will also bear the brunt of wider impacts of the pandemic – financial hardship, job losses, food poverty, and a widening educational attainment gap – all of which in turn impact on health.
General practice plays a vital role in the NHS. For the majority of the population it is the main source of health care services, providing over 1.2 million appointments in England every weekday. General practice plays a key part in promoting health, preventing disease, and managing chronic illness. It helps to keep people well and out of hospital, and acts as a gatekeeper for access to other parts of the health care system.
The NHS Long term plan explicitly aims to tackle health inequalities, with action to be taken across the NHS including in general practice. One of the requirements of the recently formed primary care networks (PCNs) will be to address health inequalities, in return for additional funding for an expanded workforce of allied health professionals (funding has been pledged for an additional 26,000 by 2024). The NHS Long term plan also recognises the longstanding shortage of GPs, and pledged to boost the GP workforce by an extra 5,000 (by 2024). This promise was taken up and expanded to 6,000 GPs by the Conservative government in 2019.
This briefing does not attempt to evaluate the successes or failures of these recent plans, or the myriad of other policies that have attempted to address the inverse care law in general practice over many years. Instead we use publicly available data to explore the current relationship between population need and supply in general practice, seeking to answer the question: how does general practice compare in areas of higher and lower socioeconomic deprivation in England? Our analysis contributes to an understanding of the extent to which the inverse care law persists in general practice today.
Approach and methods
Previous studies of inequalities in general practice,,,, have looked at the relationship between primary care supply (often in terms of the number of GPs), access (eg the number and type of appointment), and quality of care. In order to form a rounded view of general practice we look across the following areas:
- First, we consider the variation in funding between different providers.
- This impacts on supply: the number and skills mix of the staff employed in a practice, the infrastructure and equipment available, and information systems used – this also includes the location of the practice.
- These elements influence access: the number and type of appointments that can be offered, and the staff that provide them.
- And in turn the quality of services provided to patients, as well as the practice’s ability to coordinate care for their patients.
Due to the limited availability of data, in this briefing we focus on key indicators within each area: funding, workforce numbers, appointments, and quality. For quality, this means focusing on broad composite measures: performance against the quality and outcomes framework (which in turn affects levels of funding), patient satisfaction, and CQC ratings. These are broad measures and hide variation in more narrow domains of quality (such as condition-specific health outcomes). But these measures are consistent, comparable and should include these narrower areas.
Methods
We analysed the provision of general practice between 2015/16 and 2018/19 by combining publicly available data on funding, workforce, appointments and quality from GP practices and clinical commissioning groups (CCG) with demographic and deprivation data at a neighbourhood level. These neighbourhoods are lower layer super output areas (LSOAs) – 32,844 geographical units each with an average of approximately 1,500 residents.
Health need varies a lot between different areas, and we therefore reflect this in our analysis. We applied weights that reflect GP workload to the population of each neighbourhood to produce a ‘need adjusted population’. We acknowledge that workload does not equate to need, however, workload is the proxy for need used in the Carr-Hill allocation formula, therefore meaning it is consistent for use in this analysis. The weights we use are those suggested by the workload adjustment estimates produced by the 2007 Review of the General Medical Services global sum formula published by the British Medical Association and NHS Employers (except for financing indicators, where we use the weighting applied in the funding formula by NHS England, in order to more accurately reflect funding flows). This means that neighbourhoods with characteristics that imply higher health needs (for example those with very young patients, older patients, and worse health indicators) had their populations ‘inflated’ to be larger than their actual population, as each patient requires a higher workload than average. The opposite is true for those with characteristics that predict lower health needs.
We separate these neighbourhoods into quintiles (five groups) from the most to the least deprived, using the index of multiple deprivation (IMD) to rank each neighbourhood in England. The IMD measures deprivation using a weighted average of seven dimensions – income, employment, education, health, crime, barriers to housing and services, and living environment. Each dimension is constructed from a range of indicators that together provide a rich picture of life in the area. Our analysis focuses on these small geographical units, with the size of their adjusted populations reflecting health need, grouped into five by their overall level of deprivation.
The idea of need weighting populations is a standard approach that has been used in allocating health care funding in the NHS for the past 50 years. The weights we chose – the latest GP workload adjustments – are not the only weights for estimating need. But the patterns we describe in this briefing still hold when we apply different methods of weighting.
As a robustness check we repeated our analysis of each aspect of primary care across the country excluding London and found that the results did not change. This was to ensure that our findings were not being skewed by any resource allocation peculiarities associated with London.
For a more detailed description of our methods, data sources and need weights used, see the Appendix.
Box 1: GP funding and contracting in England
Responsibility for commissioning primary care services, including general practice, falls officially to NHS England. In practice, this role has increasingly been delegated to CCGs in a process known as ‘co-commissioning’. Total annual budgets for CCG primary care medical spend are allocated by NHS England, according to a CCG allocation formula.
All NHS GP practices must hold an NHS contract to run NHS-commissioned GP services. The three contracting options used to commission primary medical care services (GP services) are the General Medical Services contract (GMS), the Personal Medical Services contract (PMS) and the Alternative Provider Medical Services contract (APMS). This box briefly introduces each, together with the other major income streams for general practice in England.
Capitated resource allocation
GMS contracts and the Carr-Hill formula
The GMS contract is negotiated annually between NHS England and the British Medical Association’s General Practitioners Committee. In 2018/19 approximately 70% of practices operated under it. The global sum allocation formula (also known as Carr-Hill) forms the basis of core funding for GMS practices. Global sum income typically accounts for over half of the income of practices using the GMS contract.
The Carr-Hill formula attempts to account for variation in practice workload and the relative costs of delivering services between practices, and to divide funding more fairly to reflect local populations. Payments are based on a practice’s population, adjusted for a set of patient factors (age, sex, turnover of patients and additional needs, which includes a measure of mortality and morbidity) and contextual factors (rurality and a ‘staff market forces factor’ to reflect geographical variation in staff costs). Each adjustment generates a practice index, which are applied to the practice list to produce a practice weighted population.
PMS contracts
The key difference between GMS and PMS contracts is that while GMS contracts are agreed nationally, PMS contracts are negotiated locally between NHS England or a CCG and the provider. This is intended to give commissioners and providers greater flexibility to tailor provision to local need, while maintaining a core set of services. As PMS contracts are usually negotiated based on the GMS global sum, Carr-Hill still applies. In 2018/19, around 26% of practices used PMS contracts.
APMS contracts
In 2018/19 just 2.5% of practices in England were on APMS contracts. These are locally negotiated, more flexible and are open to a much wider range of providers, including the independent sector and voluntary and community sector organisations. APMS contracts can be used to provide essential, enhanced, out of hours and/or additional services that GMS or PMS practices have opted out of providing.
Quality payments
The quality and outcomes framework (QOF)
The QOF is a voluntary annual reward and incentive scheme for practices within the GMS contract. Typically accounting for less than 10% of practice income, QOF offers incentive payments to practices based on performance against a range of indicators. These indicators cover three broad domains – clinical, public health and quality improvement. Practices on PMS contracts may opt-in to the QOF.
Extra services
Enhanced services
Enhanced services are commissioned at either a national level by NHS England, or locally by CCGs, and can be contracted from any GP provider (though some only apply to GMS practices).
Directed Enhanced Services (DESs) are nationally negotiated and commissioners are obliged to offer them to practices within their contract. Local Enhanced Services (LESs) are locally negotiated and therefore vary by area.
These are not the only sources of income for general practice. Smaller income streams for practices include fees for specific services such as vaccinations, as well as payments to cover rent or mortgage on premises, to cover IT costs, locum allowances and some training costs.
Analysis
In this section of the briefing, we report our main findings in order of the four areas of general practice set out in the approaches and methods section. We prefix this with a brief explanation of population need.
Population need
Data from the ONS show that the total population in England has been growing by almost 1% a year, and the number of registered patients has been increasing at a similar rate across all levels of deprivation. As set out in the Appendix, need adjusting patient populations increases the effective population in more deprived neighbourhoods and decreases the effective population in more affluent neighbourhoods. This is because patients in more deprived areas have higher needs, and so each patient is ‘equivalent to’ more than one patient in an affluent area when it comes to GP workload.
Funding
The total amount of money available to practices to invest in staff and equipment to meet this population need is largely determined by the practice’s funding per patient.
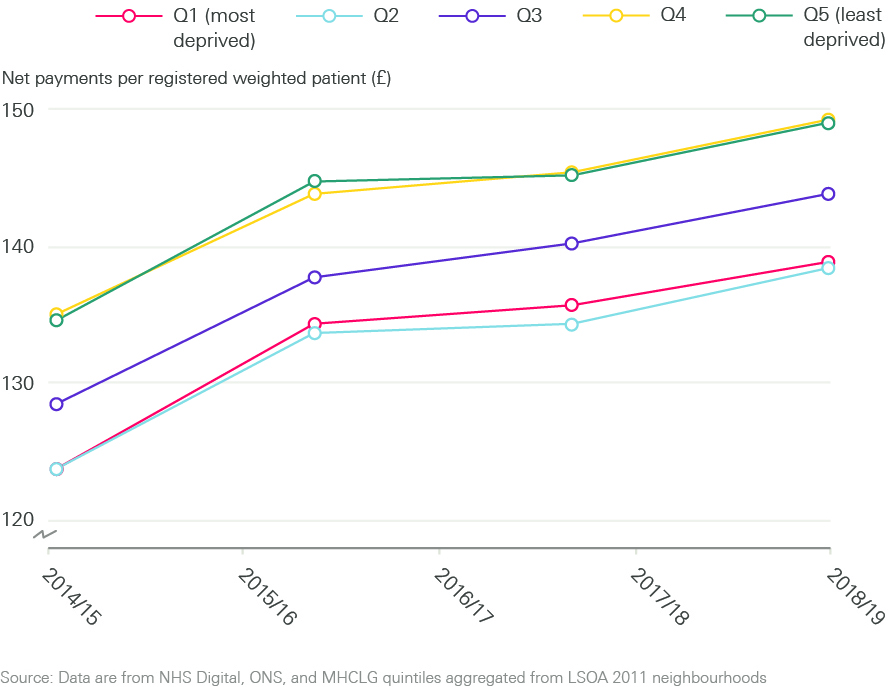
Before need adjusting the population, payments per registered patient are very similar for practices serving populations across the deprivation gradient. Once weighted for need (GP workload), we found that in 2018/19 practices serving more deprived populations – who on average have greater need for primary care – received around 7% less funding per weighted registered patient than those serving more affluent patient populations. This is shown in Figure 1.
Figure 1: Trends in GP practice payments per patient by neighbourhood deprivation
Supply
Practice characteristics
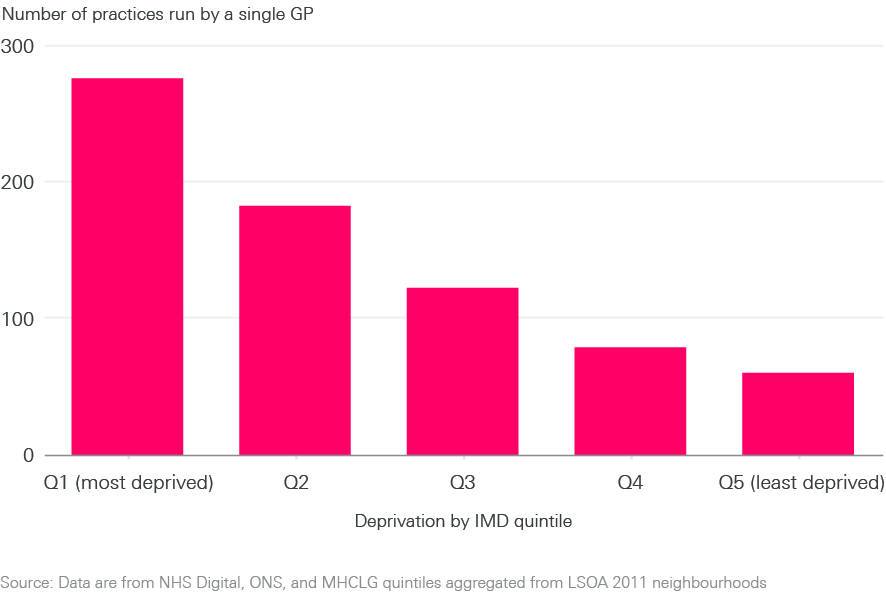
In recent years, a view from policymakers that in general practice bigger may be better, more efficient and more sustainable, has driven practices towards agglomeration and mergers., However, our analysis shows that this has not happened equally, and practices serving patients living in the most deprived areas are typically smaller, employing fewer GPs than practices serving less deprived populations (see Figure 2).
Small practices, and particularly single-handed practices (those run by a single GP), are over-represented in the most deprived areas, while large practices are over-represented in the least deprived areas.
Figure 2: Practices run by single GPs by neighbourhood deprivation
Staff numbers
Increasing the number of GPs is seen as an important way to improve the amount and quality of care that can be provided in general practice, and remains a focus of policy. However, our analysis shows that more deprived neighbourhoods have fewer GPs and more practice nurses per patient than less deprived neighbourhoods (see Figure 3).
This means that after accounting for different levels of need, a GP working in a practice serving the most deprived patients will on average be responsible for the care of almost 10% more patients than a GP serving patients in more affluent areas. Conversely, a practice nurse working in a practice serving more deprived patients will on average be responsible for the care of fewer patients than a nurse working in a practice serving more affluent patients (although their workload may be higher due to there being fewer GPs, or because of increased complexity of patient need). This may imply a substitution of nurses for doctors in practices serving more deprived populations, which may or may not be consistent with patient needs. These differences are not narrowing during the period covered by the data examined.
Figure 3: Trends in general practice workforce supply per 100,000 population by neighbourhood deprivation
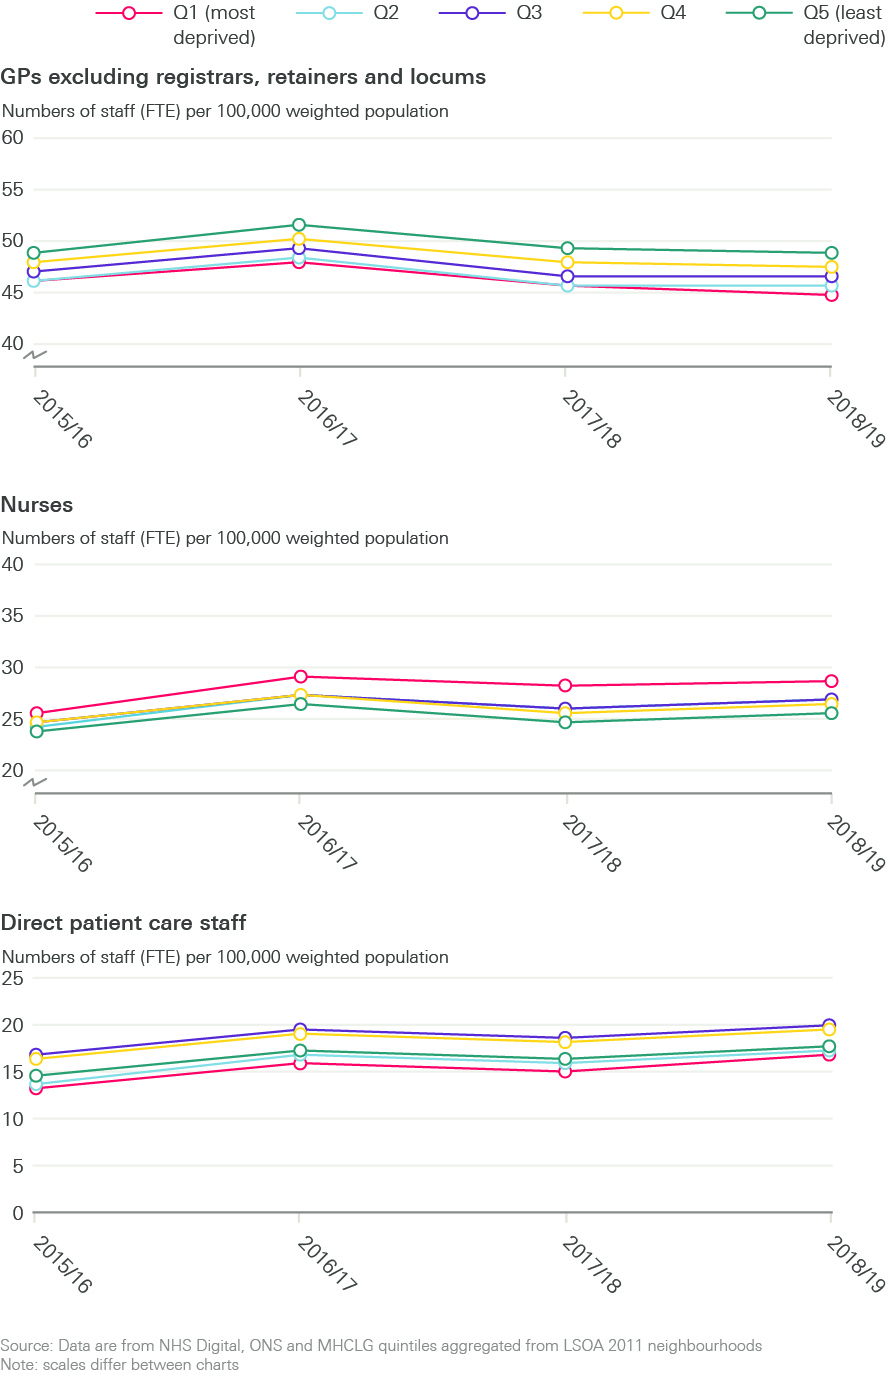
Trends for administrative staff seem to closely track those for nurses, with proportionately more administrative staff in more deprived areas. This may reflect the typically smaller size of practices in more deprived areas, with each practice – however small – needing an administrative function to be fulfilled. Direct patient care (DPC) staff, such as health care assistants and pharmacists, appear to be concentrated in practices serving more deprived populations, while others such as dispensers (who perform administrative duties, and dispense prescription medication under direction of a pharmacist) are concentrated in the more affluent areas. Taking the overall total clinical general practice workforce (GPs, nurses and DPC) we found that even taking into account differences in skills mix, more deprived populations appear to be underserved as compared to more affluent populations.
Table 1: Workforce full time equivalent per 100,000 need adjusted population in 2018/19
|
IMD group |
GP |
Nurse |
Admin |
Direct Patient Care |
Health Care Assistants |
Pharmacists |
Dispensers |
Physiotherapists |
Phlebotomists |
Physician Associates |
Other |
|
Most deprived |
45.07 |
28.81 |
114.48 |
16.9 |
11.98 |
1.62 |
0.58 |
0.04 |
0.89 |
0.18 |
0.76 |
|
2 |
45.78 |
27.04 |
106.69 |
17.57 |
10.62 |
1.4 |
2.52 |
0.02 |
1.02 |
0.18 |
0.66 |
|
3 |
46.76 |
26.83 |
102.68 |
20.21 |
10.08 |
1.28 |
5.38 |
0.03 |
1.2 |
0.13 |
0.7 |
|
4 |
47.83 |
26.62 |
101.27 |
19.83 |
9.89 |
1.26 |
5.34 |
0.04 |
1.16 |
0.1 |
0.62 |
|
Least deprived |
48.81 |
25.62 |
99.18 |
17.74 |
9.02 |
1.09 |
4.24 |
0.03 |
1.09 |
0.08 |
0.56 |
Source: General Practice Workforce data – 31 March 2020
Breaking down the GP workforce further by age and sex (shown in Figure 4), there are a disproportionate number of older GPs, particularly those aged 65 and older, working in the most deprived areas. Younger GPs tend to be working in the most affluent areas. If left unaddressed, this trend risks further exacerbating existing inequalities in GP supply as these older GPs working in areas of high deprivation eventually leave the workforce.
Figure 4: GP supply per 100,000 need adjusted population by neighbourhood deprivation

Access
Access to general practice, and patients’ experience of how they access it, depends not only on the absolute number of staff working in a practice but on how many appointments are available, which varies across practices. Practices also vary in the proportion of different types of appointment offered (the ratio of telephone versus face-to-face consultations, for example), and the duration of those appointments. Since March 2020, GPs in England have changed the ratio of face-to-face and telephone consultations in response to the COVID-19 pandemic. Sufficient data are not yet available to enable us to factor the effects of COVID-19 on consulting patterns into our analysis.
Our analysis of appointment data predating the COVID-19 pandemic shows that there are very similar numbers of appointments overall (per 100 patients), regardless of the level of neighbourhood deprivation. Patients who live in more deprived neighbourhoods are more likely to be seen by a practice nurse (two extra appointments per 100 people) and are less likely to be seen by a GP (one fewer appointments per 100 people) than those who live in more affluent neighbourhoods (see Figure 5). This mirrors the workforce supply figures, which show that more deprived neighbourhoods tend to have more practice nurses and fewer GPs.
Figure 5: Trends in primary care appointments carried out by GPs or other practice staff by neighbourhood deprivation
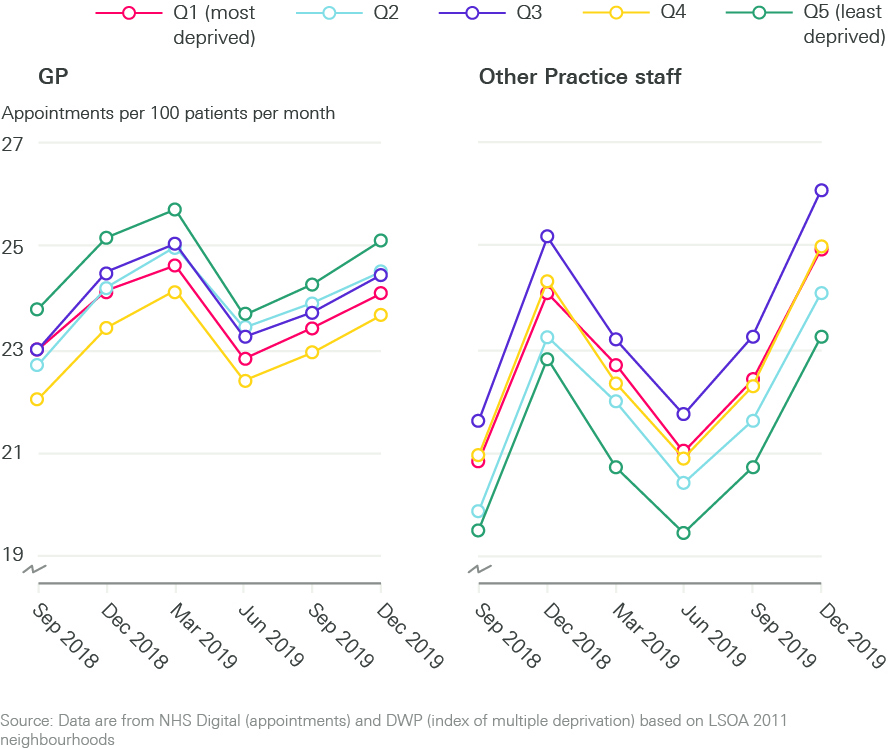
We know that people in more deprived areas generally experience worse health, and we might therefore expect to observe higher numbers of appointments for people living in more deprived neighbourhoods. The fact we do not may indicate a supply constraint (as the number of appointments is limited by the number of staff available, or the time by practice staff allocated to direct patient care). Alternatively, this may be due to a difference in health-seeking behaviour, with people living in more deprived neighbourhoods being less inclined to visit a GP for any given ailment than those living in more affluent neighbourhoods.
The COVID-19 pandemic has required general practice to shift to a ‘remote by default’ consultation approach. Pre-pandemic, practices serving the most deprived populations were doing more face-to-face consultations per 100 patients per month than practices in more affluent areas (see Figure 6). This is reversed for telephone appointments, which occur at greater frequency per head of population in more affluent areas. It is too early to know whether changes in appointment type made by practices in response to COVID-19 will follow the same patterns as face-to-face and telephone consultations pre-COVID-19.
Figure 6: Trends in face-to-face and telephone appointments by neighbourhood deprivation
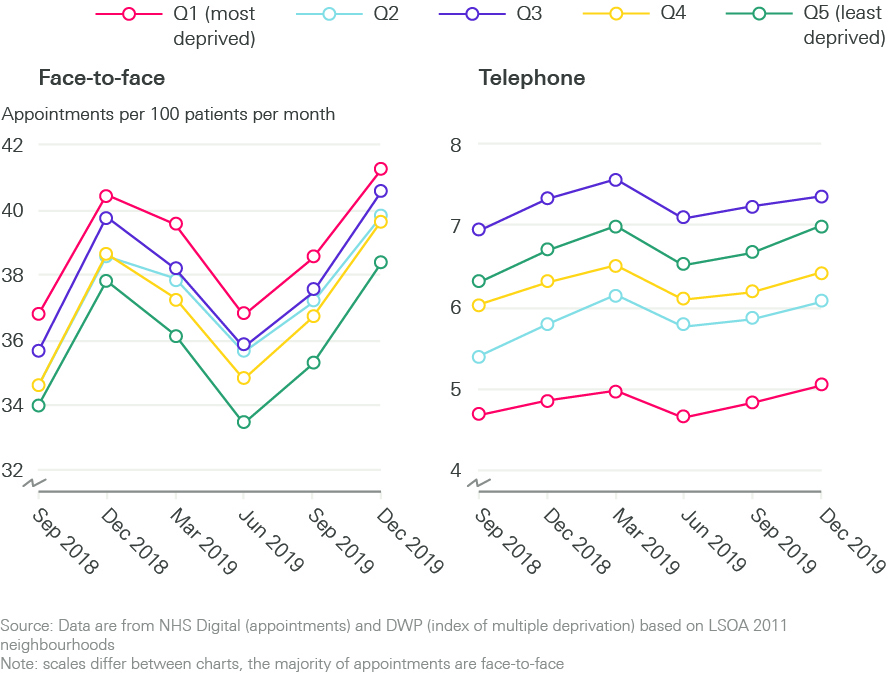
There are higher rates of patients not attending their appointments (‘did not attends’ or DNAs) in more deprived areas, where around 6.5% of appointments are not attended compared to 4.5% in the least deprived quintile.
Quality
In addition to assessing the relationship between population deprivation and the amount of care provided by general practice, we assess the relationship between quality of care and population deprivation. We use three publicly available measures to do so: performance on the QOF, overall CQC practice ratings, and satisfaction scores from the GP patient survey.
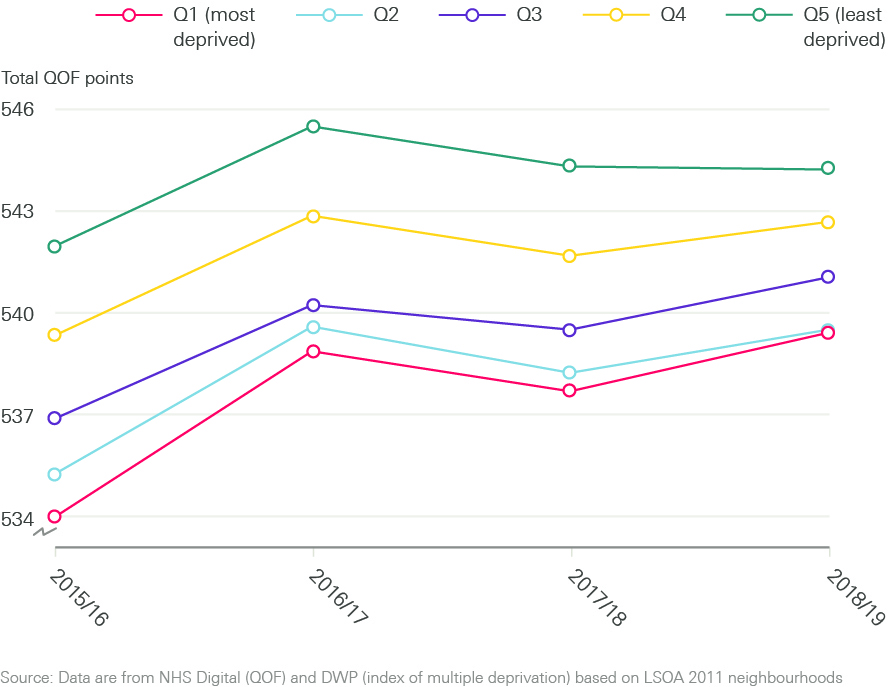
The QOF is a voluntary incentive scheme for practices (see Box 1). It awards points, and subsequently payments, to GP practices for performance based on a number of indicators. QOF scores follow deprivation scores linearly (see Figure 7). Practices serving patients in the most deprived areas have the lowest QOF scores and those serving patients living in the most affluent areas achieve the highest QOF scores (five more points on average), and therefore larger payments.
Figure 7: Trends in QOF points by neighbourhood deprivation
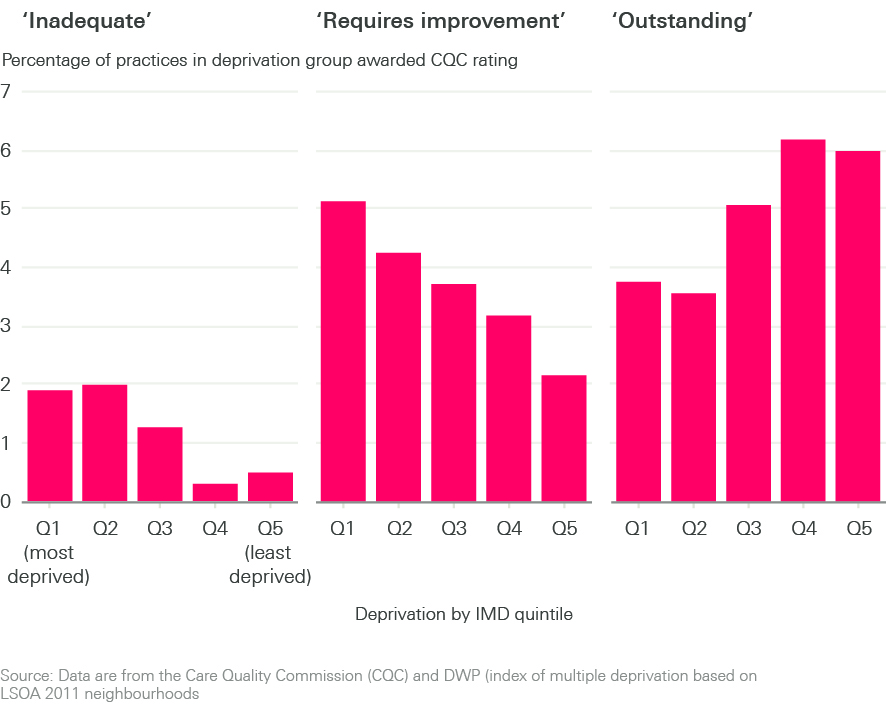
Assessments of GP practices by the CQC, which result in a rating from ‘inadequate’ to ‘outstanding’, provide another measure of quality. We found that practices serving patients living in the two most deprived quintiles are more likely to receive CQC ratings of ‘inadequate’ and ‘requires improvement’ than those serving patients who live in the most affluent areas (which are more likely to receive ratings of ‘good’ and ‘outstanding’ – see Figure 8). It is important to note that the vast majority of practices – more than 75% – are rated as good, regardless of deprivation level. Practices rated as good are not represented in Figure 8.
Figure 8: Trends in CQC rating by neighbourhood deprivation
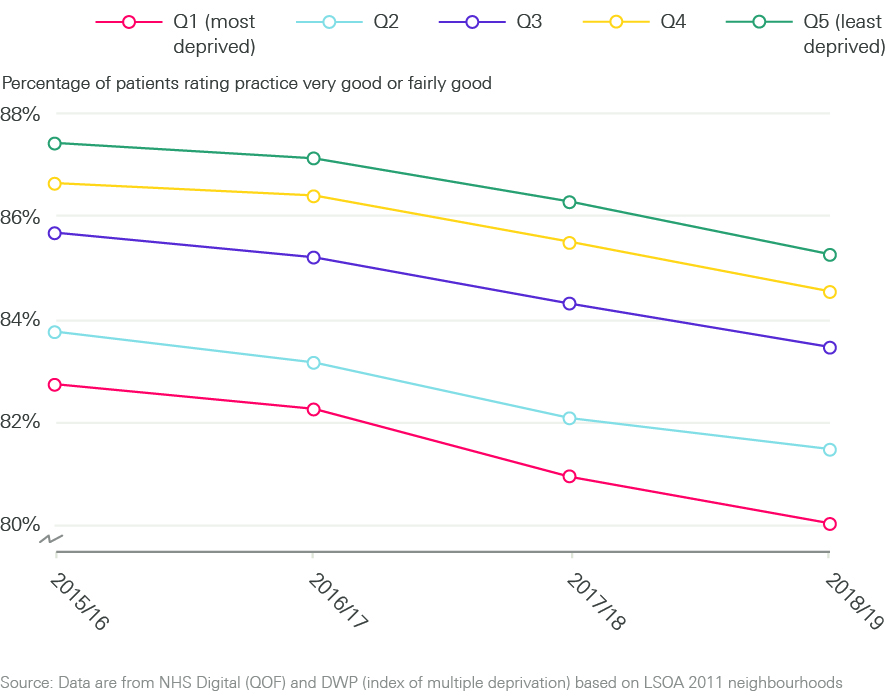
The GP patient survey provides an insight into patients’ experience of general practice. Approximately 2 million questionnaires are sent out every year, with a response rate of around 35% (740,000 responses).
Overall patient satisfaction is high, above 75% in all quintiles. But Figure 9 shows that practices serving patient populations living in the most deprived areas have the lowest overall patient satisfaction scores and that practices serving patients living in the most affluent areas have the highest patient satisfaction scores. Patient satisfaction scores appear to be falling over time (2015/16 – 2018/19) in all areas, and the observed deprivation gradient in patient scoring appears to be consistent over time.
Figure 9: Trends in patient satisfaction score by neighbourhood deprivation
Across all three measures of quality analysed, our analysis suggests that more deprived patient populations seem to receive a lower quality of care.
† In 2018/19 the value of a QOF point was £179.26 and the total number of points available was 559.
Discussion
Ensuring there is equal access for equal need is a fundamental principle of the NHS, and reducing inequalities in access and outcomes is highlighted in the General practice forward view and the NHS Long term plan., But our analysis suggests that general practices in areas of higher deprivation may be ‘under-doctored’ and underfunded relative to need.
People who live in more socioeconomically deprived areas of England are less likely to see a GP when they have an appointment compared to people living in more affluent areas. They are also less likely to report being very satisfied with the overall standard of care at their practice, and on some measures, the care they do receive is likely to be of a lower quality. This impacts individuals (whose health needs may go unmet) and the wider health care system – with rates of emergency hospital admissions higher among both children and adults living in areas of high deprivation. The COVID-19 pandemic is likely to have increased these inequities further.
How do our findings relate to existing evidence?
Our findings broadly align with existing research examining the relationship between socioeconomic deprivation and practice characteristics, funding and quality. The literature review conducted for this briefing was not a systematic review, but helps to contextualise our findings.
The shortcomings of the Carr-Hill formula (see Box 1) to adequately adjust for population need related to deprivation is well recognised.,, At practice level, an analysis of payments over time has found that for each 10% increase in deprivation score, practice payments increased by 0.06%. Analysis of consultation rates from the London borough of Tower Hamlets estimated that a formula that allowed for additional workload in deprived areas would equate to 33% more funding for these practices. Our analysis, which was not limited to practices funded via the Carr-Hill formula, suggests that underfunding relative to need may be a pervasive problem across all major funding flows into general practice.
We observe a higher number of practice nurses per patient, but a lower supply of GPs in deprived areas of England. This pattern in relation to GPs is replicated in Scotland where practices in more deprived areas also have fewer GPs, a higher proportion of older GPs and more patients per GP. This has not always been the case in England. Between 2004/5 and 2013/14, the problem of low supply of GPs in deprived areas appeared to resolve as numbers of GPs working in practices serving highly deprived areas rose. This improvement – likely linked to several government initiatives to improve general practice in deprived areas, and to improve GP workload resulting from the 2004 GP contract – has now been reversed.
Our analysis suggests that there is a similar trend in relation to selected measures of quality in general practice. A study that explored quality (using QOF scores), alongside supply and outcomes, found a narrowing gap in quality between the most and least deprived neighbourhoods in England between 2004/5 and 2011/12. Subsequent studies and our analysis suggest that this gap may have widened again. A study that looked at CQC ratings found a strong association between higher funding per patient and higher quality ratings. We did not analyse other measures of quality, such as continuity of care or patients’ confidence in their GP, but note that analysis of survey data suggests that both may be lower in practices in areas of high deprivation.,
Limitations of our analysis
Some caution should be taken when interpreting the results presented in this briefing. First, our analysis is based on a limited range of indicators designed to capture the headline characteristics of general practice. A full review of the quality and quantity of the provision of general practice would need to consider which of more than 500 indicators would best capture the full range of activities within general practice. We have instead taken a more deliberate approach, focusing on important areas and known policy priorities. We are also limited by data availability, as there are no nationally available good, consistent datasets on practice closures, staff vacancies, the quality of premises, or waiting times.
While the data we use are drawn from official national datasets, there are nonetheless issues with quality and completeness, particularly in the workforce data (see Appendix). The biggest of these is caused by methodological changes in the data collection, which means we do not have consistent data going back further than 2015/16 for workforce or before 2018/19 for appointments. This limits our ability to see trends over time. There are also completeness issues – around 1% of practices had missing workforce data in each time period, which we needed to estimate. Similarly, as the data are self-reported, there may be variations in how data are recorded on staff not directly or wholly employed by practices, or due to differing interpretations of role definitions by practices. We acknowledge the measures we have included that assess quality may in themselves be affected by deprivation (for example increased patient deprivation may make it harder to get high QOF scores).
Second, our analysis can only show descriptive relationships, rather than make causal claims. We cannot know why areas with higher levels of deprivation have a fewer GPs per head of population. A range of factors may influence where GPs choose to work – where they trained, the quality of local health services, the rurality of the practice (including known issues in coastal areas), and opportunities for their partners or children in the local area, among others.
Considerations for policy
This briefing suggests that the inverse care law, observed by Julian Tudor Hart in 1971, still persists in general practice today. This raises several challenges in relation to the current policies to improve general practice.
First, it suggests that additional effort will be needed to ensure that some of the intended additional GPs (to be recruited following government pledges) are distributed to areas of high deprivation. Rectifying the declining numbers of GPs is rightly a prominent policy goal: 6,000 additional GPs are promised by 2024. Some targeting is being attempted, both nationally (the Targeted Enhanced Recruitment Scheme offers GP trainees financial incentives to train in under-doctored areas in England) and at a local level (such as Yorkshire-based Trailblazer Fellowships for early career GPs in areas of high socioeconomic deprivation). But ‘levelling up’ the supply of GPs may require broader and more sustained policies to reverse the under-doctoring in deprived areas.
Similarly, there will need to be careful monitoring of where the additional 26,000 allied health professionals are located, as they are hired by PCNs over the coming years. There are no mechanisms (such as additional funds to offer financial or professional development incentives) to ensure that PCNs in areas of high deprivation are as able to recruit staff as PCNs in more affluent areas. Particular attention may need to be given to the distribution of social prescribing link workers, which are a key mechanism for PCNs to address unmet social needs (such as loneliness, social isolation and housing concerns). Like health care needs, social needs are not evenly distributed, and unmet social needs may be higher or more complex among patients in more deprived areas.
Secondly, with much of the policy focus in general practice on boosting workforce numbers, a key question for policymakers is whether this is sufficient in the absence of a review of funding allocations. We suggest that a review is needed, and should consider funding for PCNs (PCNs in deprived areas currently do not get extra funding to account for the likely increased needs of their populations) and also the underlying resource allocation formula (Carr-Hill). Previous research suggests that the Carr-Hill formula may under-weight for the increased health needs associated with deprivation,,, and there is a case for further analysis of the impact of the formula across general practice in England.
Thirdly, any future assessment of the relationship between deprivation and GP supply and funding mechanisms will need to take into account the likely impact of COVID-19 on patients and communities, from the direct impacts on access to primary care to the indirect shocks to jobs and livelihoods that will affect health needs. The results of our analysis strongly suggest that levelling up needs to include general practice.
‡ As a robustness check we repeated our analysis of each aspect of primary care across the country excluding London and found qualitatively identical results. This indicates that our findings are not being skewed by any resource allocation peculiarities associated with London.
Appendix: Methods
Practice level data
- We took our data on primary care workforce from NHS digital General Practice Workforce data series. This data series is published monthly and includes practice level workforce headcount and full-time equivalent numbers by staff group. We used workforce data from September each year to capture the state of the workforce in the middle of each financial year.
- The NHS Digital General Practice Workforce data series also includes attribution data, mapping which neighbourhoods the patients registered with each practice live in.
- Appointments data were taken from the NHS Digital Appointments in General Practice data series. These data are provided daily at CCG level. We aggregated these data into quarters to reduce noise in the data, and report quarterly average appointment rates per 100 of population.
- QOF data were taken from the NHS Digital Quality and Outcomes Framework Achievement data.
- CQC overall ratings were taken from the most recent rating given to each practice.
- General practice patient satisfaction scores were taken from the GP patient survey, an independent survey run by Ipsos MORI on behalf of NHS England.
- Data on the finances of GP practices were taken from the NHS Digital NHS Payments to General Practice data series.
Our workforce data cover the financial years 2015/16 through 2018/19 – during this period there were a small number of GP practices that had workforce data missing for one or more years. For these practices we imputed workforce numbers from years where data were reported to estimate the workforce numbers for years where these data were missing using simple linear interpolation.
Neighbourhood level data
Our analysis examines how the primary care supply variables listed vary across different types of neighbourhood. The measure of neighbourhood we used is the lower-layer super output area (LSOA). This is a standard geographical measure defined in the 2011 census, which divided England into 32,844 LSOAs each with an average of approximately 1,500 residents or 650 households. We combined our primary care supply variables with the following data characterising neighbourhoods.
- We used neighbourhood level population data from ONS LSOA population estimates. These provide mid-year population estimates for each neighbourhood in the country broken down by age and sex.
- We used the 2019 version of the index of multiple deprivation (IMD 2019) from the Ministry of Housing, Communities and Local Government to attribute deprivation rankings to each neighbourhood in England. The IMD 2019 measure deprivation using a weighted average of seven dimensions – income (22.5%), employment (22.5%), education (13.5%), health (13.5%), crime (9.3%), barriers to housing and services (9.3%), and living environment (9.3%). Each dimension is constructed from a range of sub-indicators that together provide a rich picture of life in the neighbourhood. We rank neighbourhoods by their overall IMD score calculated by combining the seven dimensions and group neighbourhoods into groups of roughly equal populations representing deprivation quintile groups.
Population need adjustment
Populations in different neighbourhoods have different needs for primary care due to the different demographic structures of the neighbourhood, as well as the general level of ill health in the neighbourhood. In order to capture these different needs we applied weights to the population of each neighbourhood to construct a need adjusted population. The weights we use are those suggested by the most recent workload adjustment estimates produced by the 2007 Review of the General Medical Services global sum formula published by the British Medical Association and NHS Employers. These weight older patients and those living in neighbourhoods with worse health indicators (as captured by the health indicators that comprise the IMD health domain) and those who recently registered with a practice as having higher health care needs than younger patients and those living in neighbourhoods with better health indicators. We were unable to apply the registration status weights suggested by the report in our analysis as we did not have access to individual patient level data. The weights used are given in the table that follows.
|
Age-sex weight |
Registration status weight |
IMD health domain |
||
|
Band |
Weight |
Band |
Weight |
Weight |
|
Male 0–4 years |
2.354 |
Registered with practice for 12 months+ |
1.000 |
The weight is calculated as: 1.054 to the power of the IMD health domain score associated with the patient’s postcode |
|
Male 5–14 years |
1.000 |
|||
|
Male 15–44 years |
0.913 |
|||
|
Male 45–64 years |
1.373 |
|||
|
Male 65–74 years |
2.531 |
|||
|
Male 75–84 years |
3.254 |
|||
|
Male 85+ years |
3.193 |
|||
|
Female 0–4 years |
2.241 |
Registered with practice in the past 12 months |
1.689 |
|
|
Female 5–14 years |
1.030 |
|||
|
Female 15–44 years |
1.885 |
|||
|
Female 45–64 years |
2.115 |
|||
|
Female 65–74 years |
2.820 |
|||
|
Female 75–84 years |
3.301 |
|||
|
Female 85+ years |
3.090 |
|||
Having applied these weights, we derived need adjusted populations for each neighbourhood. Where neighbourhoods had characteristics that predict higher health needs, we inflated their populations to be larger than their actual population. Those with characteristics that predict lower health needs had their populations deflated to be smaller than their actual population. The total need adjusted population across all neighbourhoods is normalised to equal the pre-adjusted total population.
Analysis
Indicators were constructed either at neighbourhood (workforce, QOF and GPPS), GP practice (finance, practice size and CQC ratings) or CCG (appointments) level depending on data availability.
For neighbourhood level indicators we attributed each of the datasets from practice level to neighbourhood level in accordance with the proportions of patients served by each practice in each neighbourhood, as given in the attribution dataset. For example, if we had a practice with five GPs serving equal numbers of patients from 50 different neighbourhoods, we allocated 0.1 GPs from this practice to each neighbourhood. We did this for all practices and neighbourhoods allocating GPs in accordance with the proportion of the practice population of each practice living in each neighbourhood to get an estimate of how many GPs from across the different practices served the population in each neighbourhood overall. We then aggregated each of our primary care variables attributed to neighbourhood level into their respective neighbourhood deprivation quintile groups – these form the numerators for the indicators that we report in our analysis. We also attribute need adjusted neighbourhood populations into their respective neighbourhood deprivation quintile groups – these form the denominators of the indicators that we report in our analysis.
For practice and CCG level indicators, we instead attribute IMD scores and need adjusted population data from neighbourhoods to practices and CCGs in accordance with the proportion of each neighbourhood served by a practice or CCG respectively.
Our financing indicators are a little different from others as we use populations as reported by the practices in their registered lists of patients and weighted populations calculated by NHS England based on these lists of registered patients. We do this because these numbers form the basis of the actual funding allocation. We do not use these population numbers as the basis of our other indicators as they are not an entirely accurate reflection of the actual population – with people who have died or migrated from areas often remaining on GP practice registration lists.
Our analysis then compares how the different aspects of primary care supply, adjusted for differing population needs for primary care, are allocated across the deprivation quintile groups. If the need adjustment appropriately predicts differences in need between neighbourhoods, then once we adjust for need, we can test to see if the NHS meets its core objective of allocating health care according to need. Any disparities observed between the deprivation quintile groups suggests a systematic patterning of access to primary care by deprivation – this breaches the core NHS objective of equal access to health care for equal need.
References
- Tudor Hart, J. The inverse care law. The Lancet. 1971; 29(7696): 405-412.
- Stafford M, Steventon A, Thorlby R, Fisher R, Turton C, Deeny S. Briefing: Understanding the health care needs of people with multiple health conditions. Health Foundation; 2018 (https://www.health.org.uk/publications/understanding-the-health-care-needs-of-people-with-multiple-health-conditions).
- Marmot M, Allen J, Boyce T, Goldblatt P, Morrison J. Health equity in England: The Marmot Review 10 years on. Institute of Health Equity; 2020 (https://www.health.org.uk/publications/reports/the-marmot-review-10-years-on).
- Office for National Statistics. Deaths involving COVID-19 by local area and socioeconomic deprivation: deaths occurring between 1 March and 31 May 2020 2020. ONS; 2020 (https://www.ons.gov.uk/peoplepopulationandcommunity/birthsdeathsandmarriages/deaths/bulletins/deathsinvolvingcovid19bylocalareasanddeprivation/deathsoccurringbetween1marchand31may2020).
- Gustafsson M, McCurdy C. Risky business: Economic impacts of the coronavirus crisis on different groups of workers. Resolution Foundation; 2020 (https://www.resolutionfoundation.org/publications/risky-business/).
- Office for National Statistics. Deaths involving COVID-19 by local area and socioeconomic deprivation: deaths occurring between 1 March and 30 June 2020. ONS; 2020 (https://www.ons.gov.uk/peoplepopulationandcommunity/birthsdeathsandmarriages/deaths/bulletins/deathsinvolvingcovid19bylocalareasanddeprivation/deathsoccurringbetween1marchand30june2020).
- Davenport A, Farquharson C, Rasul I, Sibieta L, Stoye G. The geography of the COVID-19 crisis in England. The Institute for Fiscal Studies; 2020 (https://www.ifs.org.uk/uploads/The-Geography-of-the-COVID19-crisis-in-England-final.pdf).
- NHS Digital. Appointments in General Practice December 2019 [webpage]. NHS Digital; 2020 (https://digital.nhs.uk/data-and-information/publications/statistical/appointments-in-general-practice/december-2019/page1).
- NHS England. The NHS Long Term Plan. NHS England; 2019 (https://www.longtermplan.nhs.uk/publication/nhs-long-term-plan/).
- The Conservative Party. The Conservative and Unionist Party Manifesto 2019. Conservatives; 2019 (https://www.conservatives.com/our-plan).
- Vallejo-Torres L, Morris S. Primary care supply and quality of care in England. The European Journal of Health Economics. 2018; 19(4): 499-519.
- Gravelle H, Morris S, Sutton M. Are Family Physicians Good for You? Endogenous Doctor Supply and Individual Health. Health Services Research. 2008; 43(4): 1128-44
- Jürges H, Pohl V. Medical guidelines, physician density, and quality of care: evidence from German SHARE data. The European Journal of Health Economics. 2012; 13(5): 635-49.
- Macinko J, Starfield B, Shi L. Quantifying the Health Benefits of Primary Care Physician Supply in the United States. International Journal of Health Services. 2007; 37(1): 111-26.
- Starfield B, Shi L, Macinko J. Contribution of Primary Care to Health Systems and Health. The Milbank Quarterly. 2005; 83(3): 457-502.
- NHS Employers. Review of the general medical services global sum formula. 2007; NHS Employers and BMA.
- Sharing Resources for Health in England: Report of the Resource Allocation Working Party. 1976; DHSS.
- NHS England. About primary care co-commissioning [webpage]. NHS England; n.d. (https://www.england.nhs.uk/commissioning/pc-co-comms/pc-comms/).
- NHS Digital. NHS Payments to General Practice - England, 2018/19. NHS Digital; 2019 (https://digital.nhs.uk/data-and-information/publications/statistical/nhs-payments-to-general-practice/england-2018-19).
- Parkin, E. General practice in England. 2018; House of Commons Library (https://commonslibrary.parliament.uk/research-briefings/cbp-7194/).
- British Medical Association. Global sum allocation formula [webpage]. 2020; BMA (https://www.bma.org.uk/advice-and-support/gp-practices/funding-and-contracts/global-sum-allocation-formula).
- Moberly T, Stahl-Timmins W. QOF now accounts for less than 10% of GP practice income. BMJ; 2019: 365:l1489.
- NHS England. 2019/20 General Medical Services (GMS) contract: Quality and Outcomes Framework (QOF). NHS England; 2019 (https://www.england.nhs.uk/publication/2019-20-general-medical-services-gms-contract-quality-and-outcomes-framework-qof/).
- Office for National Statistics. England population mid-year estimate. ONS; 2020 (https://www.ons.gov.uk/peoplepopulationandcommunity/populationandmigration/populationestimates/timeseries/enpop/pop).
- Fisher R, Thorlby R, Alderwick H. Understanding primary care networks: Context, benefits and risks. Health Foundation; 2019 (https://www.health.org.uk/publications/reports/understanding-primary-care-networks).
- Rosen R, Kumpunen S, Curry N, Davies A, Pettigrew L, Kossarova L. Is bigger better? Lessons for large-scale general practice. Nuffield Trust; 2016 (https://www.nuffieldtrust.org.uk/research/is-bigger-better-lessons-for-large-scale-general-practice).
- Iacobucci G. Tories promise 6000 extra GPs by 2024. BMJ; 2019: 367:l6463.
- Health Foundation. COVID-19 chart series: How might COVID-19 have affected people’s ability to see their GP? [webpage] Health Foundation; 2020 (https://www.health.org.uk/news-and-comment/charts-and-infographics/how-might-covid-19-have-affected-peoples-ability-to-see-GP).
- NHS Digital. Quality and Outcomes Framework, Achievement, prevalence and exceptions data 2018-19 [PAS]. NHS Digital. October 2019 (https://digital.nhs.uk/data-and-information/publications/statistical/quality-and-outcomes-framework-achievement-prevalence-and-exceptions-data/2018-19-pas).
- NHS England. General Practice Forward View (GPFV). NHS England; 2016 (https://www.england.nhs.uk/publication/general-practice-forward-view-gpfv/).
- Kossarova L, Cheung R, Hargreaves D, Keeble E. Admissions of inequality: emergency hospital use for children and young people. Nuffield Trust; 2017 (https://www.nuffieldtrust.org.uk/files/2017-12/nt-admissions-of-inequality-web.pdf).
- Asaria M, Cookson R, Fleetcroft R, Ali S. Unequal socioeconomic distribution of the primary care workforce: whole-population small area longitudinal study. BMJ open. 2016; 6(1) :e008783-e.
- Levene LS, Baker R, Wilson A, Walker N, Boomla K, Bankart MJG. Population health needs as predictors of variations in NHS practice payments: a cross-sectional study of English general practices in 2013-2014 and 2014-2015. Br J Gen Pract. 2017; 67(654):e10-e19.
- Kontopantelis E, Mamas MA, van Marwijk H, Ryan AM, Bower P, Guthrie B, et al. Chronic morbidity, deprivation and primary medical care spending in England in 2015-16: a cross-sectional spatial analysis. BMC Medicine. 2018; 16(1): 19.
- Levene LS, Baker R, Bankart J, Walker N, Wilson A. Socioeconomic deprivation scores as predictors of variations in NHS practice payments: a longitudinal study of English general practices 2013–2017. British Journal of General Practice. 2019; bjgp19X704549.
- Boomla K, Hull S. GP funding formula masks major inequalities for practices in deprived areas. The BMJ – Letters; 2014.
- Blane DN, McLean G, Watt G. Distribution of GPs in Scotland by age, gender and deprivation. Scott Med J. 2015; 60(4): 214-9.
- Asaria M, Ali S, Doran T, Ferguson B, Fleetcroft R, Goddard M, Goldblatt P, Laudicella M, Raine R, Cookson R. How a universal health system reduces inequalities: lessons from England. Journal of epidemiology and community health. 2016; 70(7): 637-43.
- L’Esperance V, Gravelle H, Schofield P, Santos R, Ashworth M. Relationship between general practice capitation funding and the quality of primary care in England: a cross-sectional, 3-year study. BMJ Open. 2019; 9(11): e030624.
- Emergency Care. In: Curtice J, Clery E, Perry J, Phillips M., Rahim N (ed.) British Social Attitudes: The 36th Report. The National Centre for Social Research; 2019.
- Levene LS, Baker R, Walker N, Williams C, Wilson A, Bankart J. Predicting declines in perceived relationship continuity using practice deprivation scores: a longitudinal study in primary care. British Journal of General Practice. 2018; 68(671): e420-e6.
- Dixon J, Spencelayh E, Howells A, Mandel A, Gille F. Indicators of quality of care in general practices in England: An independent review for the Secretary of State for Health. The Health Foundation; 2015.
- Spooner S, Gibson J, Checkland K, McBride A, Hodgson DE, Hann M, et al. Regional variation in practitioner employment in general practices in England: a comparative analysis. British Journal of General Practice. 2020; 70(692): e164-e71.
- Marmot M, Allen J, Goldblatt P, Boyce T, McNeish D, Grady M, Geddes I. Fair society, healthy lives. The Marmot Review. Strategic review of health inequalities in England post-2010. The Marmot Review; 2010 (http://www.instituteofhealthequity.org/resources-reports/fair-society-healthy-lives-the-marmot-review/fair-society-healthy-lives-full-report-pdf.pdf).
- NHS Digital. Series/collection: General Practice Workforce. NHS Digital; (https://digital.nhs.uk/data-and-information/publications/statistical/general-and-personal-medical-services).
- NHS Digital. Series/collection: Appointments in General Practice. NHS Digital; (https://digital.nhs.uk/data-and-information/publications/statistical/appointments-in-general-practice).
- NHS Digital. Series/collection: Quality and Outcomes Framework, achievement, prevalence and exceptions data. NHS Digital; (https://digital.nhs.uk/data-and-information/publications/statistical/quality-andoutcomes-framework-achievement-prevalence-and-exceptions-data).
- Care Quality Commission. Using CQC data: data sheets: care directory with ratings. CQC; (https://www.cqc.org.uk/about-us/transparency/using-cqc-data).
- GP Patient Survey. Surveys and reports: GPPS; (https://www.gp-patient.co.uk/SurveysAndReports).
- NHS Digital. Series/collection: NHS Payments to General Practice – England. NHS Digital; (https://digital.nhs.uk/data-and-information/publications/statistical/nhs-payments-to-general-practice).
- Office for National Statistics. Dataset: Lower layer Super Output Area population estimates (supporting information). ONS; (https://www.ons.gov.uk/peoplepopulationandcommunity/populationandmigration/populationestimates/datasets/lowersuperoutputareamidyearpopulationestimates).
- Ministry of Housing, Communities and Local Government. National statistics: English indices of deprivation 2019. Gov.uk; 2019 (https://www.gov.uk/government/statistics/english-indices-of-deprivation-2019).
Acknowledgements
The authors are grateful to external reviewers, and to the many Health Foundation staff who contributed to this work. In particular, we’d like to thank Nihar Shembavnekar, Sean Agass and our former Health Foundation colleague Ben Gershlick. Errors and omissions remain the responsibility of the authors alone.
When referencing this publication please use the following URL: https://doi.org/10.37829/HF-2020-RC13