Acknowledgements
A number of people contributed to the development of this report and we would like to thank them for their comments and advice.
Executive summary
Key points
- The total budget for the Department of Health and Social Care (DHSC) rose by just 0.6% to £122.8bn in 2016/17. This followed an increase in spending of 2.8% in 2015/16. On average, since the NHS’s inception the budget has increased at 3.7% a year.
- New funding announced in the 2017 Autumn Budget means that 2016/17 will represent one of the lowest annual growth rates in the DHSC budget between 2015/16 and 2020/21 – the period covered by the 2015 comprehensive spending review.
- The rate of increase in 2016/17 was lower than population growth, so total health care spending in England per person fell in 2016/17.
- Despite the low funding growth, the DHSC underspent its budget by £635m. This is a small underspend in the context of the total budget – just 0.5% – but is an improvement on 2015/16 when the departmental budget was overspent by £155m.
- To achieve this, funding was targeted at front-line, day-to-day spending at the expense of longer-term investment. While the total budget for the DHSC rose by £772m (0.6%), NHS England’s budget rose by £2.4bn (2.3%) in 2016/17. As a result, funding for other areas fell by £1.6bn (9.0%) – this included a transfer of £1.2bn from the capital budget (defined as the capital department expenditure limit (CDEL)) to the revenue budget (defined as the revenue department expenditure limit (RDEL)).
- 2016/17 saw the introduction of a new Sustainability and Transformation Fund (STF), provided to NHS trusts by NHS England, subject to agreeing and meeting financial and performance control totals.
- The NHS is committed to ensuring equal access to care based on need. Historically the distribution of NHS resources across the country did not match the pattern of need. The health service has been gradually shifting money towards areas of higher need.
- The allocation of sustainability and transformation funds in 2016/17 has increased funding in areas which are already above their assessed relative need. This meant London and the North received a greater share of the STF than their relative need, while the Midlands and East, and the South received a lower share. Ensuring that NHS hospitals are financially sustainable is important but this must be balanced against the equally important goal of ensuring that areas of high need receive their fair share of funding.
- The NHS could not continue with a trend of rising deficits among trusts and commissioners. Actions have been taken to relieve some of the pressure, but this has come at the expense of long-term investment and fair funding.
- Forgoing long-term investment to protect day-to-day services may be an appropriate tactic for a short period of austerity; however, the NHS is now in its seventh year of very low funding growth. Without significant investment above current plans, this is likely to continue until at least 2020/21. Continuing to forgo long-term investment will therefore make the challenge of meeting demand pressures through improvements in efficiency increasingly difficult.
Commissioners are diverging: overall financial position has improved, but more commissioners were in deficit in 2016/17
- Commissioners, comprised of NHS England and clinical commissioning groups (CCGs), posted a surplus of £918m in 2016/17, compared with a surplus of £624m in 2015/16. The surplus for NHS England increased from £639m to £765m, while CCGs improved from a £16m deficit to a £153m surplus.
- Commissioners were required to withhold 1% of their budget for non-recurrent spending in case the provider sector faced significant deficits in the next year. At 2016/17 year-end, this covered the negative position of the provider sector. Had the reserve been spent on non-recurrent expenditure as originally planned, CCGs would have posted a net deficit of £567m. The total reserve was £814m, with £720m from CCGs and £94m from direct commissioning by NHS England.
- The vast majority of additional commissioner spend in 2016/17 went to NHS trusts , either via the sustainability and transformation fund (STF) (£1.8bn) or for directly commissioning services (£1.2bn).
- An additional £200m was spent on services from non-NHS providers (including private, local authority and third-sector organisations) – a much lower increase than the £934m in 2015/16.
- Spending on primary care prescribing costs fell by £215m, while spending on primary care, ophthalmic services, pharmaceutical services and dental services fell by £646m. Of this, the largest fall was £485m for dental services. Direct spending on GP services by commissioners was broadly flat in real terms between 2015/16 and 2016/17, but total spending on general practice rose by 3% from other investment, including IT and funding for GP forward view programmes.
- The net financial position of CCGs improved in 2016/17, but the proportion of CCGs in deficit increased from 15% to 29%. The National Audit Office (NAO) found this was due to a divergence in the financial position of CCGs: those with overspends had large overspends and those with underspends had large underspends.
- The pressure on commissioners has continued in 2017/18. By Q3, CCGs reported a net deficit of £471m, with an end-of-year deficit forecast of £291m.
- CCGs are again holding a risk reserve, with the money not to be spent if the provider sector is in deficit. In 2016/17, a similar situation meant that the forecast year-end deficit in Q3 of £377m was improved to a surplus of £153m.
NHS trusts: income rose faster than costs, but this is largely due to the introduction of a new sustainability and transformation fund (STF)
- NHS trusts posted a deficit of £806m in 2016/17, which was worse than the planned deficit of £591m. However, it was a 68% fall from the £2.5bn deficit posted in 2015/16. For 2017/18 the total deficit is forecast to rise again – to £931m.
- There was an improvement in the proportion of NHS trusts posting a deficit, which fell from 67% in 2015/16 to 44% in 2016/17. As at Q3 2017/18, 59% of NHS trusts are in deficit.
- 2016/17 was the first year since 2012/13 that total income for NHS trusts rose faster (3.9%) than costs (1.8%). This was in large part due to the introduction of the STF. It was also the first year since 2009/10 that the national tariff increased in cash terms.
- The biggest increase in costs for NHS trusts was for staff, which rose by 1.3%, largely driven by a 1% increase in whole-time equivalent (WTE) staff. Permanent staff costs rose by £1.1bn (2.5%), while there was a fall in agency spending of £760m (20%), following the introduction of the agency cap. Spending on other temporary staff increased by £331m (18%).
- Hospital drug costs rose by 4.2% in 2016/17 – lower than the 12% growth in 2015/16, but 2.1% higher than planned. Hospital drugs now account for 48% of total NHS drug costs in 2016/17, compared with 32% in 2010/11.
- Lack of capacity among NHS trusts means that a greater amount of pre-planned care was purchased by NHS trusts from non-NHS providers, with spending rising by £111m (11%) in 2016/17.
- Total activity in non-NHS providers increased, with a 6.8% rise in inpatient elective admissions in 2016/17, compared with 2.2% in NHS trusts. For outpatients, the number of appointments rose by 6% for non-NHS providers, compared with 5% for NHS trusts.
- NHS trusts were again over-reliant on one-off savings to improve their financial position. 25% of in-year savings were one-off, or non-recurrent, savings, compared with the plan of 8%.
- At Q3 2017/18, the total deficit for NHS trusts stood at £1.3bn, against a plan of £916m. By the end of 2017/18 the deficit is forecast to come down to £931m, including the STF, against a planned deficit of £496m. Without an improvement in this forecast in the last quarter, the provider-side deficit will increase again for 2017/18.
The sustainability and transformation fund: without it deficits may have grown, but funding did not match relative need
- 2016/17 saw the introduction of the STF, provided to NHS trusts by NHS England, subject to agreeing and meeting financial and performance control totals.
- The STF was provided on the condition that it was not spent on additional services, and therefore did not lead to any additional cost for NHS trusts
- NHS trusts’ income (excluding the STF) grew by 1.6%. Without the STF, costs would have risen faster than income meaning the deficit could have been as high as £2.6bn – larger than the deficit in 2015/16.
- However, the funding used for the STF would have been available as part of the overall budget, such as through increases in the tariff, which could have led to additional costs. Some of the funding could also have been provided to other areas such as primary care. Therefore, if the funding had gone through other means, the deficit would have been somewhere between £806m and £2.6bn.
- 21 NHS trusts received no STF. This was due to them not accepting control totals, not meeting control totals, or not meeting performance targets.
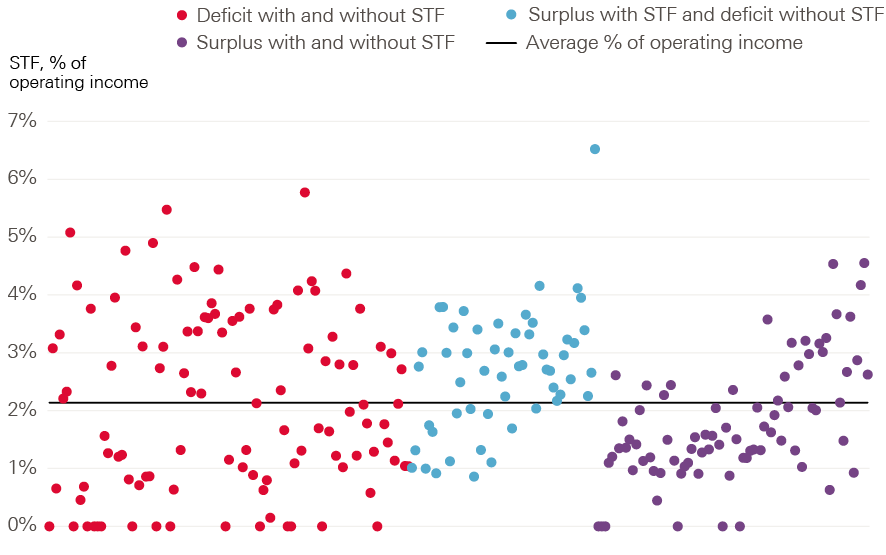
- For NHS trusts that did receive the STF, there was a wide disparity in the amount of STF, varying between 0.15% and 6.5% of operating income. There is no clear pattern between the final financial position of a provider and the allocation of the STF.
- The STF allocation varied by provider type. Funding was targeted at trusts providing emergency care – the acute sector received 84% of the total STF despite accounting for 75% of total operating income.
- The STF accounted for 2.2% of total income. By trust, it accounted for 2.5% of income for acute trusts, 2.3% for specialist trusts, 1.4% for mental trusts, 1.2% for community trusts, and 1.2% for ambulance trusts.
- Around 40% of the STF went to trusts that would have had a surplus without it.
Long-term investment: trend of transferring funds from the planned capital budget to resource budget continues, to fight short-term pressure
- NHS England’s budget increased by 2.3% in 2016/17, to provide funding for front-line services. However, with the total budget for the DHSC rising by only 0.6%, funding for other areas by the DHSC fell by 9% (£1.6bn).
- This included a 3% fall in spending on public health, a 4% fall in capital spending, and a 47% fall in spending on non-capital informatics. Funding for Health Education England (HEE), which delivers education and training for NHS staff, remained broadly flat in real terms.
- Capital spending fell by 4% in 2016/17, due to a transfer of £1.2bn from the planned capital budget (CDEL) to the resource budget (RDEL). This continues a trend of similar transfers every year since 2014/15, which has resulted in a fall of 19% in capital spending between 2013/14 and 2016/17 – an average of 7% a year.
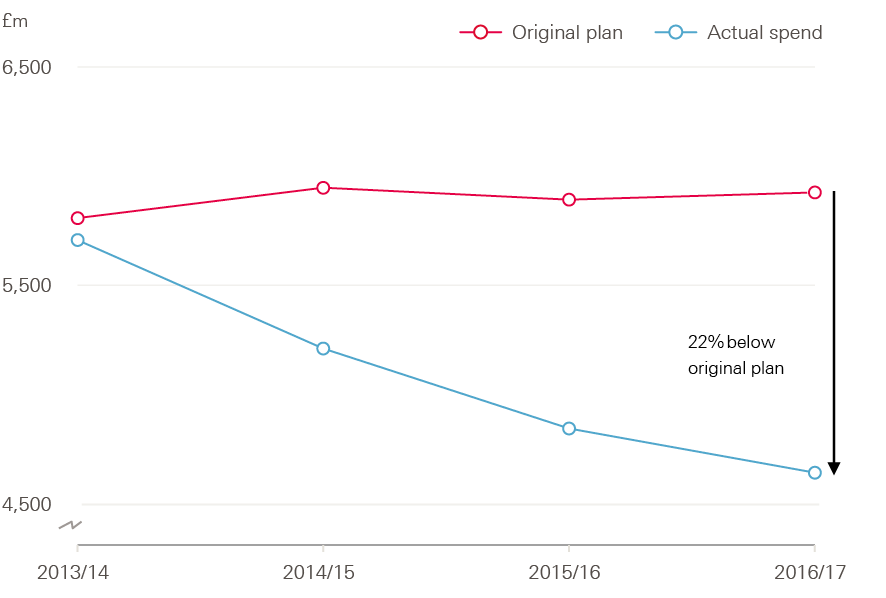
- Original plans were for capital spend to rise slightly over this period – as such actual capital spending was 22% lower in 2016/17 than originally planned.
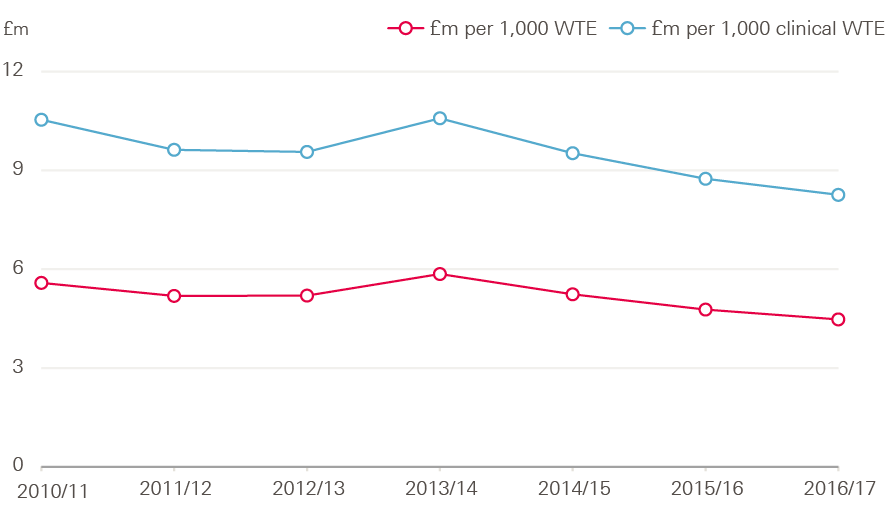
- An internationally recognised way of tracking capital spending is the spend per head of the workforce. This estimates the amount of additional resources that are available per worker, which may lead to a more productive workforce. With the number of WTE staff employed rising by 6% between 2013/14 and 2016/17, capital spending per WTE fell by 23% – an average of 9% a year.
- Data from the Organisation for Economic Co-operation and Development (OECD) show that capital spending for health care, such as for hospitals and equipment, in the UK is low compared with other OECD countries, at 0.3% of GDP compared with an average of 0.5%. Increasing spending to the OECD average would mean an additional £3bn would be available for investment in health capital across the UK.
- Falling capital spending impacts provider finances and service delivery. It limits the ability of NHS trusts to purchase new equipment, and to make repairs and maintenance to current facilities. In 2016/17, there was an estimated maintenance backlog of £5.6bn, up from £5.2bn in 2015/16. This was greater than the total capital budget.
- Of this amount, £2.8bn represented backlog that is a high or significant risk, up from £2.4bn in 2015/16.
- Investment in equipment has seen significant decline in spending between 2013/14 and 2016/17, falling by 54% at an average of 23% a year. Investment in new buildings fell by an average of 4.9% a year; investment in improving existing buildings fell by an average of 7.2%, and investment to reduce the backlog fell by 7.6%.
- In 2016/17, depreciation (reductions in the value of assets such as buildings and IT equipment) was planned to be 28% higher than in 2015/16, but was 14% lower . In total, depreciation was £447m lower than plan in 2016/17.
- The Naylor review of NHS property and estates highlighted the importance of capital investment to the productivity, transformation and long-term sustainability of the NHS. However, there is little evidence of how underinvestment in capital impacts on productivity. Future work by the Health Foundation will look to address this.
Mental health: spending has increased due to a new standard, but it’s not possible to identify where the additional funding is going
- The mental health investment standard (MHIS) formerly parity of esteem, was introduced in 2016/17. It requires all CCGs to increase spending on mental health services in line with their total allocation, to help protect vital mental health services.
- In 2016/17, 85% of CCGs met the MHIS. This resulted in mental health spending rising by £379m from £9.3bn in 2015/16 to £9.7bn in 2016/17.
- This is welcome news for mental health services in need of investment. Yet it has not been possible to account for how this additional investment was spent.
- Mental health trusts provide the majority of services in the sector, yet the income they received from NHS England and CCGs in 2016/17 rose by just £23m. This compares to an increase in CCG spending on Mental Health of £379m.
- It is likely that some of the additional funding was allocated to the Improving Access to Psychological Therapies (IAPT) programme, which was introduced to allow adults living with common mental health conditions to talk to a mental health professional to help them manage their conditions.
- In total, CCGs spent £430m on IAPT services in 2016/17. The cost of these varies widely across CCGs, from £0.03 to £17.56 per head – more than 500 times larger.
- IAPT spending by CCGs is planned to increase by 8.4% to £467m in 2017/18. Total spending on mental health services by CCGs is planned to increase by 1% over the same period, so IAPT services will take an increasing share of total spending on mental health.
- Mental health activity for services fell by 1.5% in 2016/17. When taking account of service mix, there was a 0.3% drop in cost-weighted activity for mental health services.
- As at Q2 2017/18, 85% of CCGs were planning to meet the MHIS by the end of 2017/18, the same proportion that met it in 2016/17. The 2018/19 updated planning guidance confirmed that 100% of CCGs are expected to meet the MHIS in that year.
* All financial data in this report have been adjusted to 2017/18 prices unless otherwise specified, using HM Treasury gross domestic product (GDP) deflators – a whole economy measure of inflation as of March 2018. 2017/18 prices have been used so numbers in this report reflect numbers currently being published by NHS bodies on 2017/18 data.
† We define the total budget for the DHSC as the total Department Expenditure Limit (TDEL), which is the budget allocated and spent by the department, excluding ring-fenced depreciation.
‡ The DHSC did not exceed the money voted in parliament due to an administrative error in the treatment of National Insurance receipts.
Section one – Introduction
Since 2010 the UK government has been committed to reducing the national deficit. While this has meant total government spending on public services in real terms has remained relatively flat since 2010/11, the NHS in England has been relatively protected, with real-terms increases in its budget every year. However, the budget has grown at a much lower rate than the historical average, or all independent estimates of growth in demand pressures.
The costs facing NHS trusts who deliver care have risen faster than the income they received in recent years. In the Health Foundation’s previous analysis of NHS finances, we have highlighted the resulting deterioration in the financial performance of NHS trusts; from an overall surplus of £600m in 2012/13 to a deficit of £2.5bn in 2015/16.
Previously in this series we have highlighted many factors contributing to the growth in deficits, including a large growth in spending on agency staff; emergency care accounting for a greater share of hospital activity; and falling consultant productivity. We have also established a clear correlation between financial distress and quality of care provided to patients, although it is important to recognise that this does not establish causality.
NHS commissioners have also come under rising pressures. In 2015/16 clinical commissioning groups (CCGs) posted a net deficit of £16m, for the first time since they were established in 2013. This was balanced by an underspend by NHS England centrally of £639m, resulting in a net commissioning surplus; however, this was not enough to fully offset trust deficits. As a result, the Department of Health and Social Care (DHSC) exceeded its budget (defined as the total department expenditure limit, or TDEL) by £155m.
2016/17 looked to be more challenging, with total spending per person falling in real terms. Yet the financial position for NHS trusts and commissioners improved, reversing a concerning long-term trend. Progress was also made towards improving funding for mental health services, through the introduction of the mental health investment standard (MHIS) to support the Five year forward view for mental health.
In this latest report in the Health Foundation’s annual series on NHS finances, we look at some of the ways this improvement was achieved. We explore:
- the financial performance of commissioners (Chapter 3)
- the financial performance of NHS trusts (Chapter 4)
- how the introduction of the sustainability and transformation fund (STF) directed funding to NHS trusts (Chapter 5)
- the results of focusing funding on front-line services at NHS trusts at the expense of spending on capital, public health, education and informatics (Chapter 6).
- the national priority for mental health services through the MHIS (Chapter 7).
§ This refers to total public sector expenditure on services, per Public Expenditure Statistical Analyses 2017.
¶ All financial data in this report have been adjusted to 2017/18 prices unless otherwise specified, using HM Treasury gross domestic product (GDP) deflators – a whole economy measure of inflation as of March 2018. 2017/18 prices have been used so numbers in this report reflect numbers currently being published by NHS bodies on 2017/18 data.
** Known as the Department of Health at the time – the department was renamed in January 2018.
†† Formerly known as parity of esteem.
Section two – The national picture
In 2016/17, the DHSC had a total budget of £122.8bn (see Figure 1). Of this, £118.2bn was available for day-to-day running of health and social care through the revenue budget. The remaining £4.6bn was available for long-term investment through the capital budget.
10.5% of the department’s revenue budget (£12.5bn) is used to provide funding:
- to various arm’s length bodies, including Health Education England (HEE) and Public Health England (PHE)
- to local authorities for the public health grants
- for administration costs within the DHSC.
The remaining majority (£106.8bn in 2016/17) is provided to NHS England for the commissioning of NHS services.
NHS England directly commissions some services, such as specialised services and some primary care. But most of its funding – £77.9bn in 2016/17 – is allocated to the 209 CCGs across the country to commission services for their local populations.
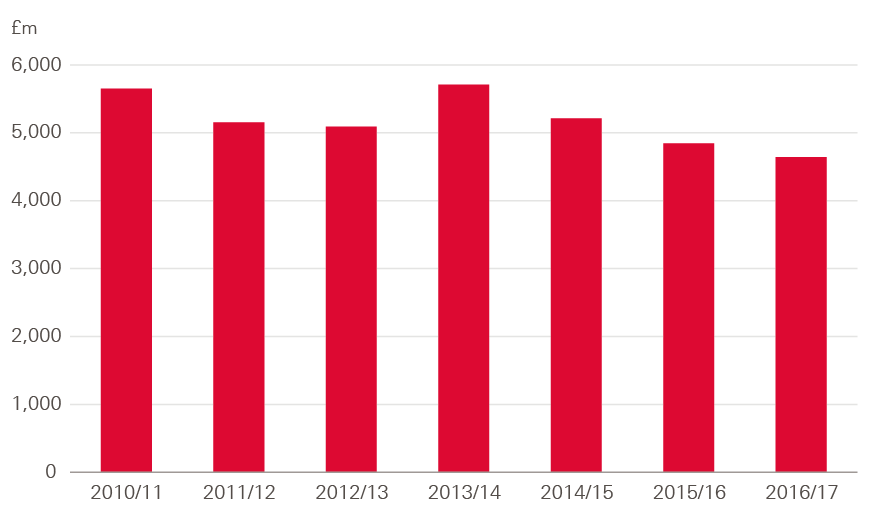
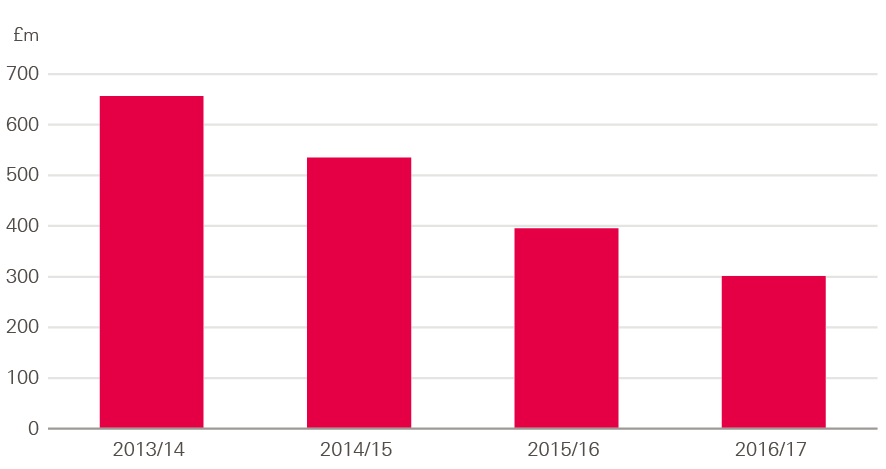
Funding for the DHSC has risen in real terms every year since 2010/11, although the rate of growth has fluctuated (see Figure 2). The highest rate of growth was in 2015/16 (2.8%), with the lowest in 2010/11 (0.2%). Even the rate for 2015/16 was below the long-run average for the NHS of 3.7% a year, and lagged behind all estimates of growth in demand pressures.
In 2016/17 DHSC funding grew by just 0.6% (£772m). Although this is lower than the previous 3 years, the DHSC underspent by £635m. This is a small underspend in the context of the total budget (at just 0.5%), but is an improvement on 2015/16 when the departmental budget was overspent by £155m.
As in recent years, immediate pressures crowded out long-term investment in 2016/17, with the DHSC transferring £1.2bn from the capital budget to the revenue budget. This was the third consecutive year the capital budget was used to fund immediate spending costs. As a result, DHSC capital spending was 22% below the original plan for 2016/17 (this is explored in more detail in Chapter 6).
Figure 1: National funding 2016/17
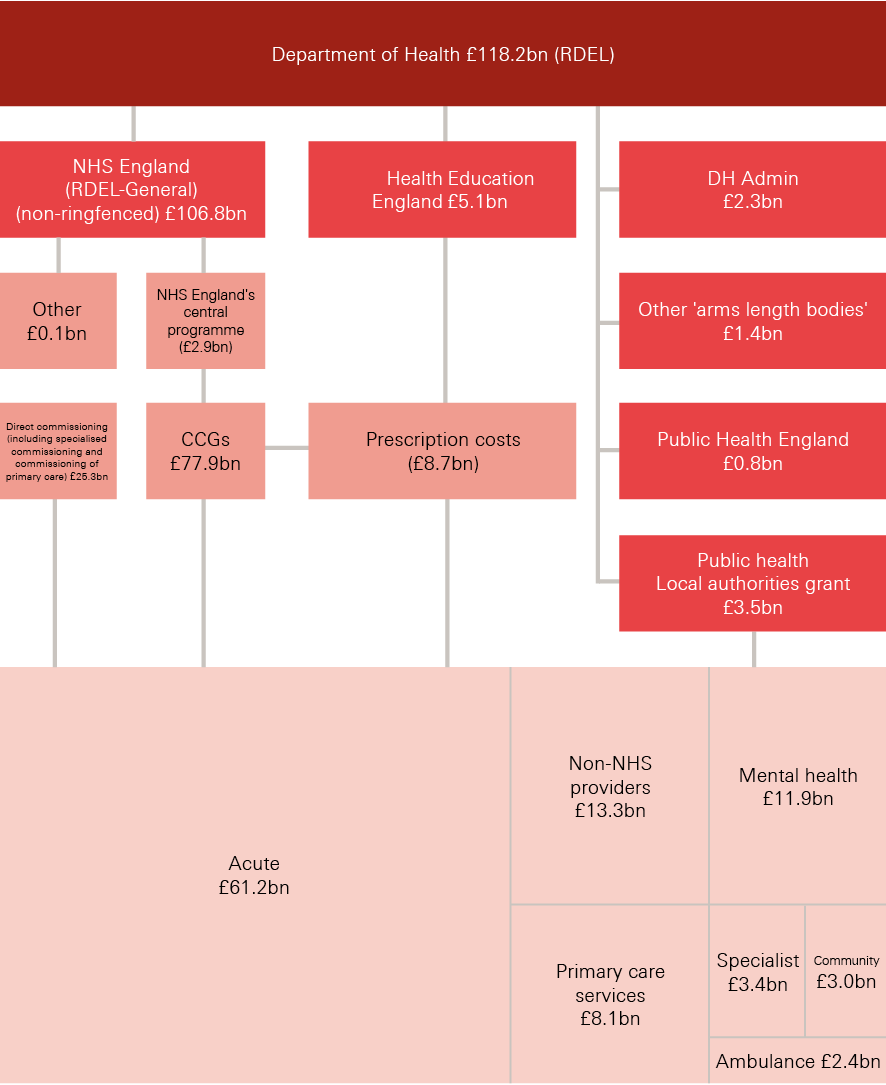
Note: RDEL excluded ring-fenced depreciation. Numbers for the acute, mental health, community, specialist and ambulance sectors refer to total operating income in each NHS provider sector.
Source: Department of Health Annual Report and accounts 2016/17; NHS England Annual Accounts 2016/17
Coming years
The budget set out in the 2015 comprehensive spending review would have seen spending per head falling in 2018/19 and 2019/20, counter to the commitment made in the 2017 Conservative Party manifesto. In recognition of the pressures facing the NHS, additional funding was announced in the 2017 Autumn Budget. £335m was made available in-year to support trusts facing challenges due to winter pressures, with a further £500m available for capital investment (although with £1bn transferred from capital to the resource budget, capital spending will once again be below the original plan).
An additional £2bn will be provided for 2018/19, of which £1.6bn has been allocated to the resource budget. In total, an additional £5.2bn is available between 2017/18 and 2020/21, including £3.5bn for capital funding. As a result, spend per head will rise in 2018/19, while relatively flat in 2019/20 and 2020/21 (see Figure 3). Overall, the growth in funding will still lag behind projected growth in demand and cost pressures, with all independent projections estimating these growing at over 4% a year above inflation. The additional funding eases the pressures, but they remain significant.
Figure 2: Annual change in TDEL by Parliament, 2010/11–2019/20 (17/18 prices)
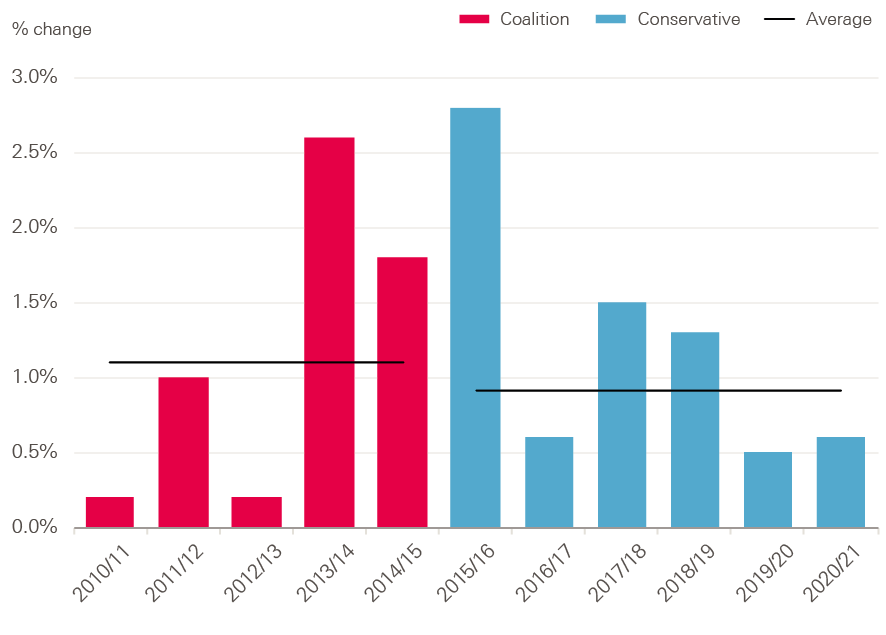
Source: Department of Health Annual Report and accounts 2016/17; Autumn Budget 2017
Figure 3: Annual change in spend per person by DHSC, TDEL, 2019/10–2020/21 (%, 17/18 prices)
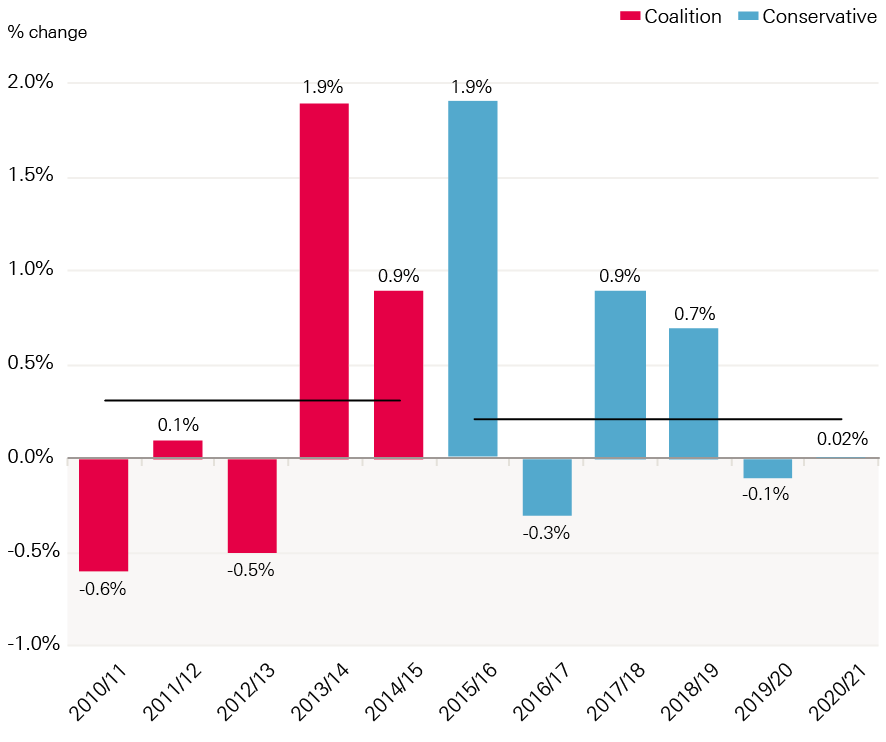
Source: Department of Health Annual Report and accounts 2016/17; Autumn Budget 2017, Office for National Statistics population estimates
Section three – Commissioning budget and finances
The vast majority of the DHSC budget is used to commission NHS services in England, whether at a national level by NHS England, or a local level by CCGs. In 2016/17, NHS England’s budget was £106.8bn – 88% of the total resource budget of the DHSC (RDEL). Of this, £77.9bn was provided to 209 CCGs for local commissioning – 73% of NHS England’s budget.
2016/17 saw the introduction of the Sustainability and Transformation Fund (STF), which provided £1.8bn directly from NHS England to NHS trusts rather than via CCGs (discussed in more detail in Chapter 5). Despite this, the proportion of NHS England’s budget provided to CCGs has risen slightly from 72% in 2015/16, due to a reduction of £2bn in direct commissioner spend from NHS England. This was partly driven by an increase in CCGs commissioning primary care.
This chapter looks first at the national combined commissioner budget, then focuses on the financial pressures facing local commissioners.
National commissioning
The total budget for NHS England rose by £2.4bn in 2016/17, from £104.4bn in 2015/16 to £106.8bn. This 2.3% increase was much greater than the 0.6% increase for the DHSC total budget. The vast majority of this increase was passed on to NHS trusts, via the STF (£1.8bn) or through the normal route of commissioning services (£1.2bn). This was partly offset by reductions in other areas (Figure 4).
Figure 4: Change in NHS England spending by sector, 2015/16–2016/17 (2017/18 prices)
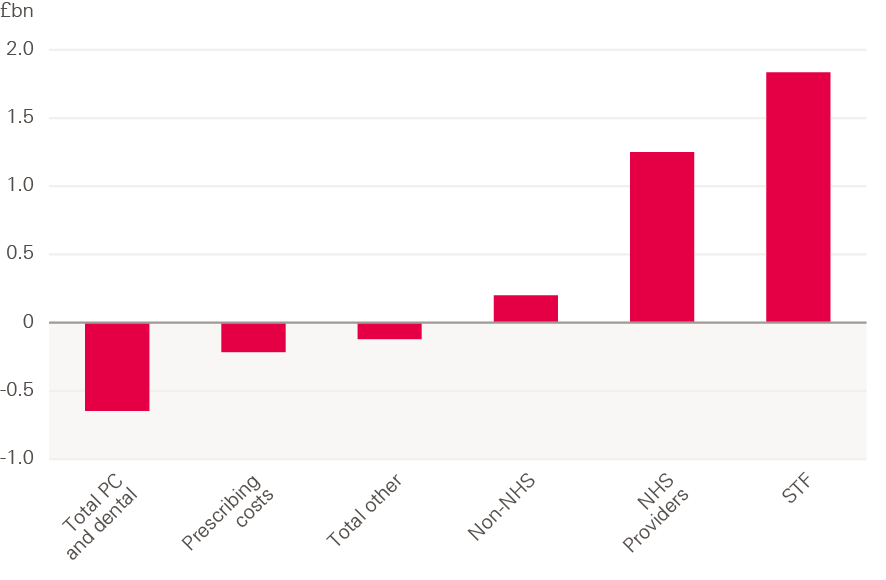
Note: 2016/17 accounts for DHSC show that spending on GP services were broadly flat in real terms between 2015/16 and 2016/17.
Source: NHS England Annual Accounts 2016/17
An additional £200m was spent on services from non-NHS providers in 2016/17 – an increase of 1.5% from the previous year. This is much lower than the year-on-year increase of £934m in 2015/16. In recent years, growth in funding for non-NHS providers has previously increased at a faster rate than for NHS trusts, with the share of NHS England’s spending accounted for by non-NHS providers rising from 11.9% in 2014/15 to 12.5% in 2015/16. This share fell slightly to 12.4% in 2016/17.
Approximately 70% of spending by commissioners on non-NHS providers went to independent service providers (ISPs), consistent with previous years.
Spending on prescribing costs fell by £215m in 2016/17, while spending on primary care (general practice), ophthalmic services, pharmaceutical services and dental services fell by £646m. Of this latter figure, the largest fall was £485m for dental services, while spending on GP services was broadly flat, with an increase of 0.02%. Spending on GP services refers to spending by commissioners through general and primary medical services, which make up approximately 78% of total spending and investment in general practice in England. In total, spending and investment in general practice increased by £300m (3.0%) in 2016/17, with large increases in IT expenditure (£158m) and training paid for by HEE (£65m). Dental services spending refers to primary care dental spending. There is also additional spending on dental care in secondary and community care. Total spending on dental care fell from £3.8bn in 2015/16 to £3.7bn in 2016/17.
NHS England had a total surplus of £918m in 2016/17, including a surplus for CCGs of £153m (Figure 5). A significant portion of this underspend relates to a ‘risk reserve’, whereby 1% (£814m) of the total commissioners’ budget was held back in case of a provider-side deficit, to improve the overall financial position of commissioners and trusts at year-end. This funding had been planned to fund priorities in-year that would not require future spending (so called non-recurrent expenditure). At year end the commissioners had not spent the money in the reserve, so this balanced the provider sector deficit, which was larger than planned (see Chapter 4 for more detail on providers).
Figure 5: Surplus/deficit of CCGs and NHS England, 2013/14–2017/18 (2017/18 prices)
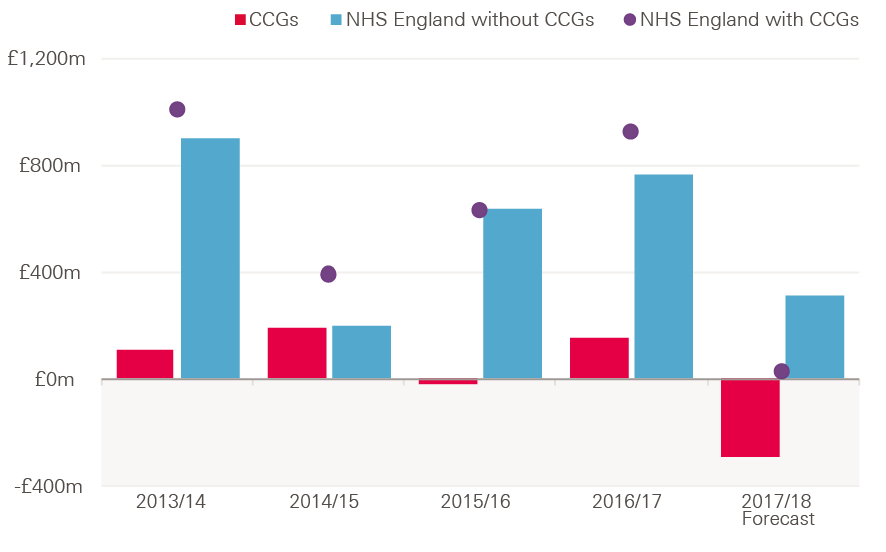
Note: 2017/18 forecast is at Q3 2017/18.
Source: NHS England Financial Performance Reports
Clinical commissioning groups and direct commissioning
The overall CCG surplus of £153m for 2016/17 is an improvement on 2015/16, when there was an overall deficit of £16m. However, a greater proportion of CCGs reported a deficit in 2016/17 – this rose to 29% from 15% in 2015/16 (see Figure 6). The increase reflects the divergence of the financial position of CCGs: some commissioners have been able to increase surpluses, while others have grown deficits. The National Audit Office (NAO) found this was due to large overspends among those with overspends, and large underspends among those with underspends.
The numbers in Figure 5 relate to the in-year financial performance of CCGs in 2016/17 – the spending of commissioners against plan. Another way to analyse the financial position of commissioners is to look at their cumulative position, by adding the in-year result to the cumulative position of previous years. In 2016/17, the cumulative surplus of all CCGs fell from £341m to £178m. As the NAO reported, this shows that CCGs are maximising their resources and drawing down on reserves where possible to continue to meet the funding needs of trusts.
NHS England (excluding CCGs) had a surplus of £765m in 2016/17 – larger than the previous two years. This included underspends of £302m in direct commissioning and £447m in administration and central programmes.
Pressures in 2017/18
The pressure on commissioners has continued in 2017/18. By Q3, NHS England was forecasting that it would end the year with an underspend of £18.5m – less than 0.01% of the budget. CCGs reported an overall deficit of £471m in Q3 2017/18, with an end of year forecast deficit of £291m.
Again, commissioners are holding a risk reserve, which is now set at 0.5% of CCG allocations. NHS England is holding £200m in a central reserve and providers are holding 0.5% of local clinical quality and innovation funds. NHS England has indicated that the risk reserve funding currently held by CCGs and NHS England is unlikely to be spent, to offset the position of the provider sector. In 2016/17, a similar situation meant that the forecast year-end deficit in Q3 of £377m was improved to an actual surplus of £153m, suggesting the final outturn for 2017/18 could be substantially improved.
Figure 6: Proportion of CCGs in deficit, 2013/14–2017/18
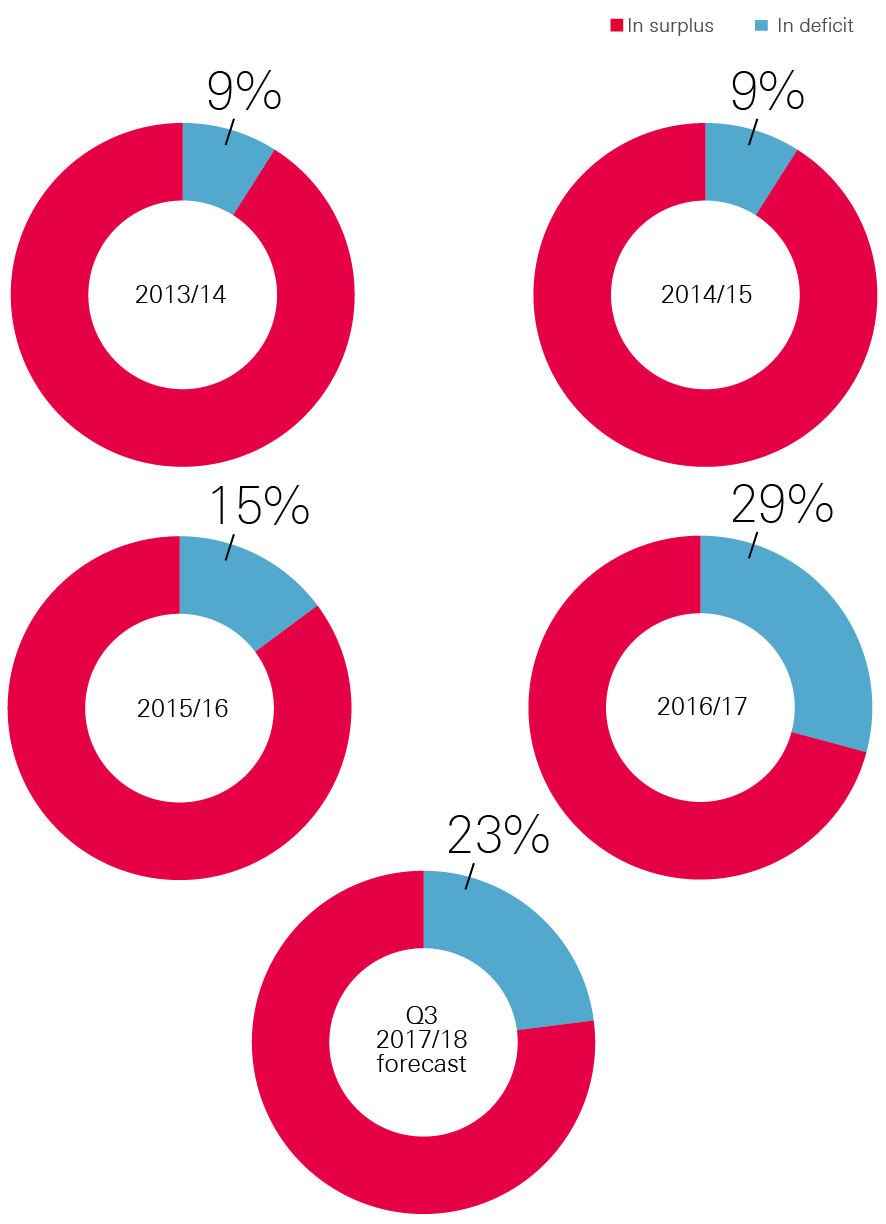
Note: Numbers refer to in-year position of CCGs.
Source: NHS England Financial Performance Reports
††† Per correspondence with NHS England.
Section four – NHS trust pressures
In recent years, NHS trusts have faced increasing pressures; the cost of providing services has risen faster than their income. This has resulted in a growing overall deficit since 2013/14. This trend was reversed in 2016/17. Although NHS trusts still posted an overall deficit of £806m, this was a large improvement on the deficit of £2.5bn in 2015/16 (Figure 7). However, it was higher than the planned deficit for the year of £591m.
The STF was a significant contributor to the reduced deficits with £1.8bn allocated as income to NHS trusts, directly from NHS England. Without the STF the overall provider deficit may have been higher than in 2015/16, at a potential £2.6bn. However, this figure may be misleading, as at least part of the funding that came from the STF would have been available to trusts if funding was allocated differently (see Chapter 5 for more detail).
Some figures in this section are presented with and without the STF for reference, as well as to provide a range of what may have happened without the STF. For example, Figure 7 shows that if the STF had been provided as regular income in 2016/17, the overall deficit would have been somewhere between £806m and £2.6bn.
Figure 7: Net financial position of NHS trusts, 2012/13–2017/18 (2017/18 prices)
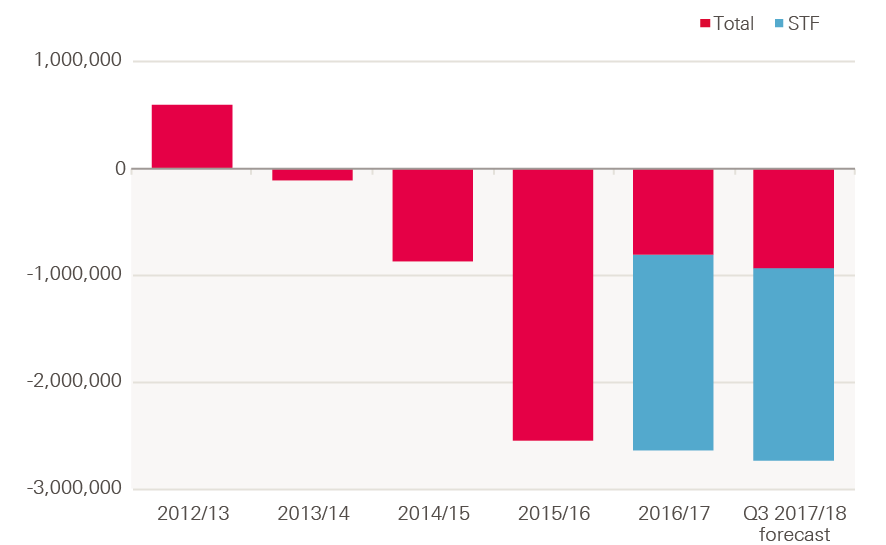
Note: 2017/18 figure is the year-end forecast figure for 2017/18 per NHS Improvement Q3 2017/18 performance report.
Source: NHS Improvement Quarterly Performance Reports, Health Foundation analysis
The STF improved the net position of trusts, as the funding could not be used in the current year. This means it directly reduced the deficit of those in the red, while increasing the surplus of those in the black.
There was also a reduction in the number of trusts posting a deficit, thus breaking the trend of growing numbers of trusts doing so since 2012/13. 44% of trusts posted a deficit in 2016/17 compared with 67% in 2015/16 – this was the lowest level since 2013/14 (Figure 8). With the STF excluded from the calculation, the proportion of trusts in deficit remained almost the same as in 2015/16, at 66%.
Figure 8: Percentage of trusts in deficit, 2012/13–2017/18
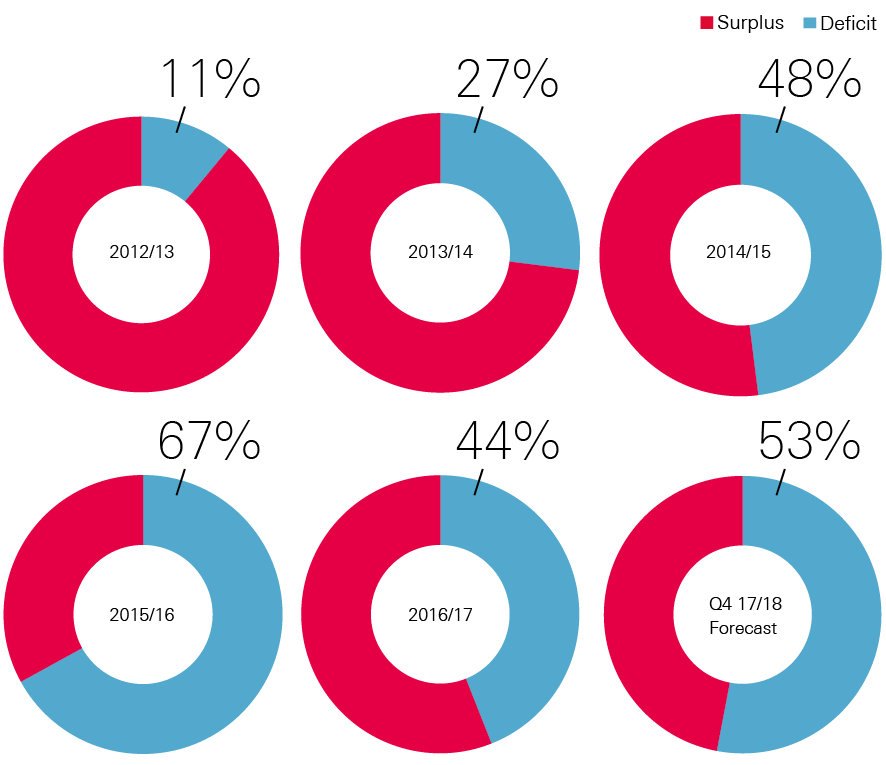
Source: NHS Improvement Quarterly Performance Reports, Health Foundation analysis
At Q3 2017/18, the in-year deficit was £1.3bn, against a plan of £916m. This was due in part to overspends of £701m on employee costs and £292m on non-staff costs. The deficit is forecast to fall by the end of 2017/18 to £931m, but this would still be an increase on the 2016/17 deficit, and would be much higher than the planned deficit of £496m.
Most of the change in trusts’ position was caused by a significant decline in the deficit position of acute trusts, which fell from £2.7bn in 2015/16 to £1.2bn in 2016/17. Mental health trusts ended the year in the largest surplus, at £165m, followed by specialist trusts, with an £81m surplus. The ambulance sector also ended the year in a deficit position, though this was smaller than in 2015/16.
Table 1: Trusts’ net adjusted surplus/deficit by sector, 2012/13–2016/17 (2017/18 prices)
|
2012/13 |
2013/14 |
2014/15 |
2015/16 |
2016/17 |
|
|
Acute |
£198m (17%) |
-£452m (76%) |
-£1,064m (65%) |
-£2,670m (88%) |
-£1,185m (61%) |
|
Ambulance |
£19m (9%) |
£16m (50%) |
£14m (20%) |
-£12m (40%) |
£0m (30%) |
|
Mental health |
£270m (18%) |
£191m (21%) |
£101m (28%) |
£56m (39%) |
£165m (21%) |
|
Community |
£32m (0%) |
£42m (16%) |
£15m (16%) |
£18m (26%) |
£11m (17%) |
|
Specialist |
£127m (0%) |
£118m (28%) |
£65m (50%) |
£70m (50%) |
£81m (24%) |
|
TOTAL |
£593m |
-£112m |
-£-868m |
£-2,538m |
-£806m† |
† – figure includes impact of adjustments by NHSI improvement of £121m, for changes in provider status, and change in discount rate provision.
Source: NHS Improvement quarterly performance reports and Health Foundation analysis
Growth in total income and costs
Over 90% of NHS trusts’ total income is received via CCGs and NHS England, predominantly in the form of payment for patient care activities. Although total costs were still higher than income in 2016/17, growth in total income (£3.1bn, 3.9%) was higher than growth in total costs (£1.5bn, 1.8%) for the first time (Figure 9). This meant that the provider deficit fell by 68% from £2.5bn in 2015/16.
Growth in income was largely due to the introduction of the £1.8bn STF. This funding was intended to improve the financial position of trusts, and as it could not be spent on additional services, it did not lead to any additional costs. This is discussed further in Chapter 5.
Figure 9: England NHS trusts’ total costs and total income, 2015/16 and 2016/17 (2017/18 prices)
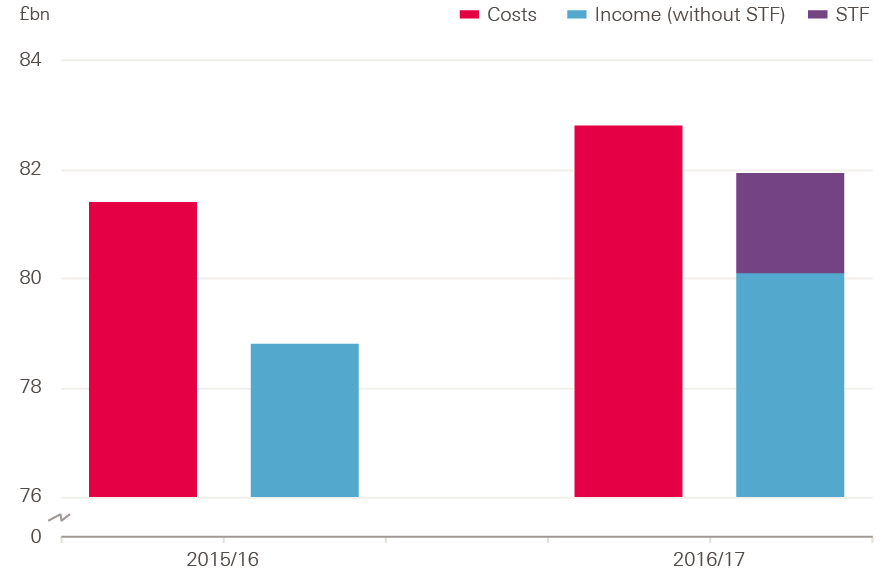
Note: Total costs and income refer to all costs and income per NHS Improvement quarterly performance reports. The difference between total costs and income does not exactly match the overall deficit due to adjustments made at a national level.
Source: NHS Improvement Quarterly Performance Reports
The amounts that trusts are paid for activity through the national payment by results (PbR) tariff increased in cash terms for the first time since 2010/11. Each year the tariff is uplifted to reflect increased costs due to costs of pay, drugs, capital, Clinical Negligence Scheme for Trusts (CNST), and other operating costs. In 2016/17 the total cost increase was estimated to be 3.1%. An efficiency factor is applied to this increase, to incentivise trusts to improve their cost effectiveness. In previous years the factor has been set higher than the estimated cost increase, resulting in a cash-terms fall in prices. In 2016/17 the efficiency factor was set at 2%, so prices rose by an average of 1.1% in cash terms.
Acute trusts saw the largest increase in operating income (4.9%) compared to operating costs (2.2%) in 2016/17. Operating income for community trusts fell by 3%, while their costs fell by 2.7%. Operating income for mental health trusts rose by 1.3%, while their costs increased by 0.3%.
Ambulance trusts saw the largest percentage increase in operating costs, at 3.5%, compared to an increase in income of 4%. Excluding the STF, operating income and costs rose by 2.2%. For all other provider types, operating costs rose by more – or decreased by less – than operating income, if the STF is excluded (Figure 10).
Figure 10: Percentage change in operating costs and income by NHS provider type in England, with and without the STF, 2015/16–2016/17 (2017/18 prices)
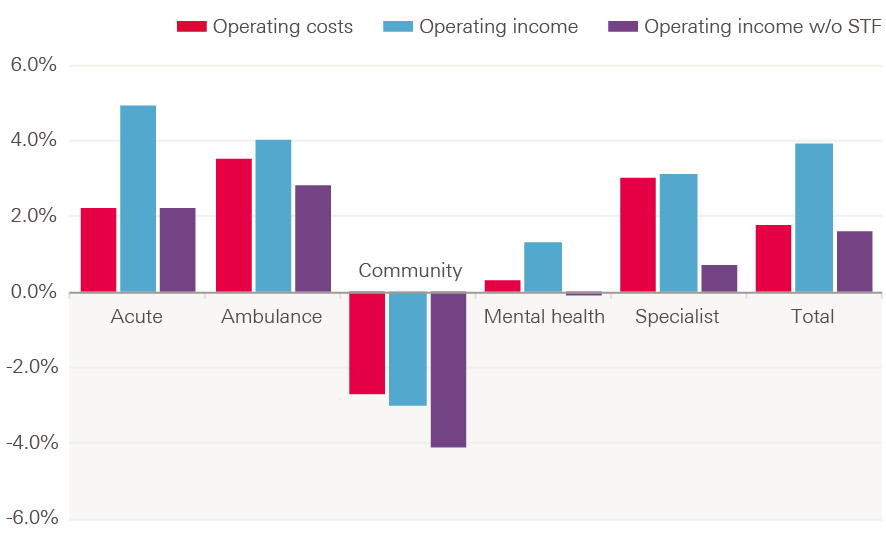
Source: NHS Improvement Quarterly Performance Reports, Health Foundation analysis
Cost pressures for NHS trusts
The increased operating costs of NHS trusts were predominantly driven by increases of £1.1bn in permanent staff costs, £330m in temporary staff and £290m drug costs (see Figure 11).
These were balanced by a 19.6% fall in agency costs (£760m). This is a reverse of the recent trend of rising agency costs, following the introduction of the control measures by NHS Improvement due to significant rising expenditures in prior years. As a result, agency costs accounted for 6% of total staff costs in 2016/17, compared to 7.6% in 2015/16.
Cost improvement programmes had a significant impact on current year costs in 2016/17 – there were £3.2bn of cost improvements, reflecting 3.7% of total spend by trusts. Of these, approximately 75% were recurrent savings, meaning they would result in savings in future years.
The remaining 25% were one-off, or non-recurrent, savings – this figure is much higher than the planned portion of 8%. This trend has continued in 2017/18, with a forecast at Q3 of 3.8% of total spend in efficiency savings, with 78% being recurrent and 22% non-recurrent. One-off savings are again forecast to be much higher (134%) than plan. This continues an ongoing trend of over-reliance on one-off savings to improve the financial position each year.
Figure 11: Changes in operating costs of NHS trusts, 2015/16–2016/17 (£bn, 2017/18 prices)

Note: Figures relate to operating costs, rather than total costs.
Source: Financial accounts of trusts and NHS Improvement data.
Staff costs
Staff costs continue to be the most significant cost for trusts, at more than 60% of overall operating costs. In 2016/17, total staff costs rose by £674m (1.3%), which was smaller than the increase of 3.5% in 2015/16. Permanently employed staff make up 90% of total staff costs (Figure 12).
Figure 12: Total staff costs in English NHS trusts by staff type, 2015/16 and 2016/17 (£bn, 2017/18 prices)
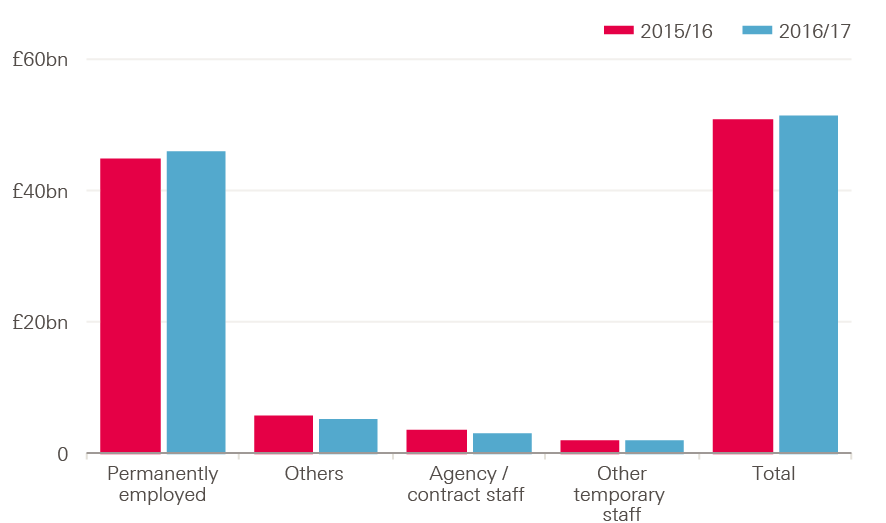
Source: Health Foundation analysis
Figure 13 shows the change in costs by staff type. The cost of permanent employees contributed most of the total change, at £1.1bn – an increase of 2.5%. The greatest relative increase was for other temporary staff, at 18.2% (£331m). Agency staff costs fell by 19.5% in 2016/17; however, spending was still 23.5% over the plan for the year.
Figure 13: Annual change in staff cost by staff type, 2015/16–2016/17 (£bn and %, 2017/18 prices)
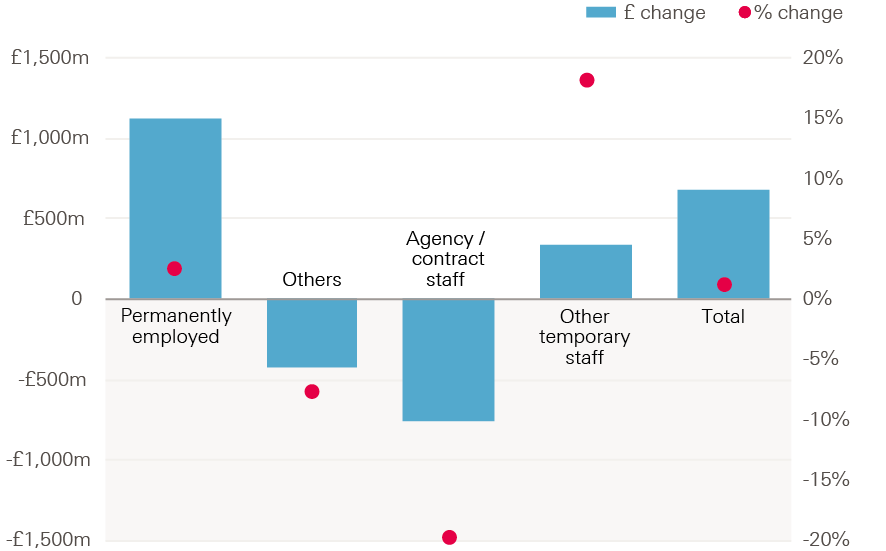
Source: Health Foundation analysis
In 2016/17, there was a 1% increase in staff numbers on a whole-time equivalent (WTE) basis, while total staff costs rose by 1.3%. Most of the rise in staff costs was therefore due to an increase in staff numbers, rather than an increase in average staff cost per worker. Since 2010, average NHS pay increases have been below that of the private sector. For nurses and health visitors, this means they are earning approximately 5% less than they would be had their wages risen at the same rate as the private sector. However, while trusts managed to keep pay costs growing at 1.3%, total pay costs were still £826m higher than plan, reflecting the tight cost controls in place for staff costs.
Drug costs
Drug costs rose by 4.2%, from £6.8bn in 2015/16 to £7.1bn in 2016/17 (see Figure 14). This growth rate is lower than that seen in 2015/16 (12%) and 2014/15 (6%). Spending on drugs in 2016/17 was 2.1% higher than planned.
Figure 14: Annual prescription drug spend in NHS Trusts, 2013/14–2016/17 (% and £bn, 2017/18 prices)
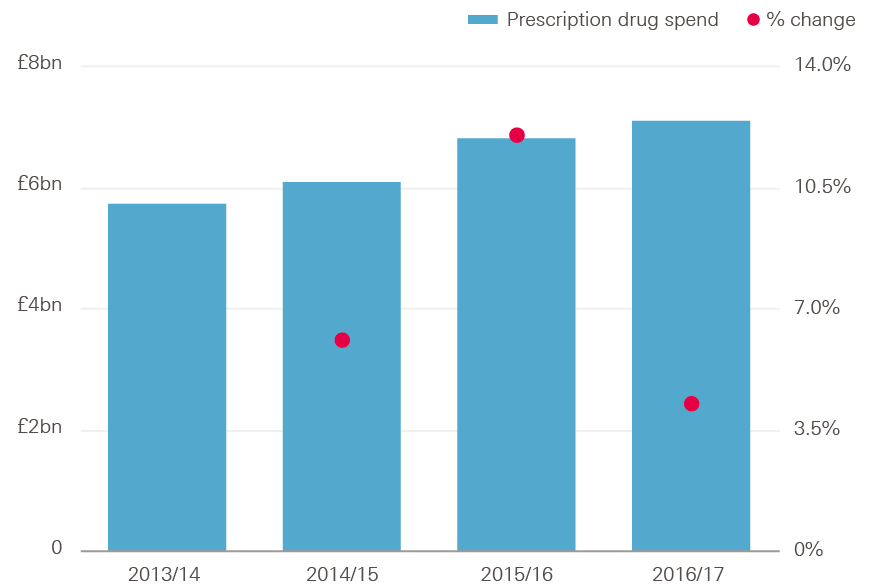
Source: Health Foundation analysis
Spending on drugs by sector has been changing, with hospitals accounting for 48% of total drug costs in 2016/17, compared to 32% in 2010/11 (see Figure 15). This was due to an average increase in hospital drug spend of 10.3% between 2010/11 and 2016/17, and an average fall in primary care prescribing spend of 1.0%. This was driven by newer and more expensive medicines being used more in hospitals than primary care, and a greater use of drugs in specialist hospitals.
Figure 15: Estimated share of total spending on drugs in hospital, primary care and community sectors, 2010/11–2016/17
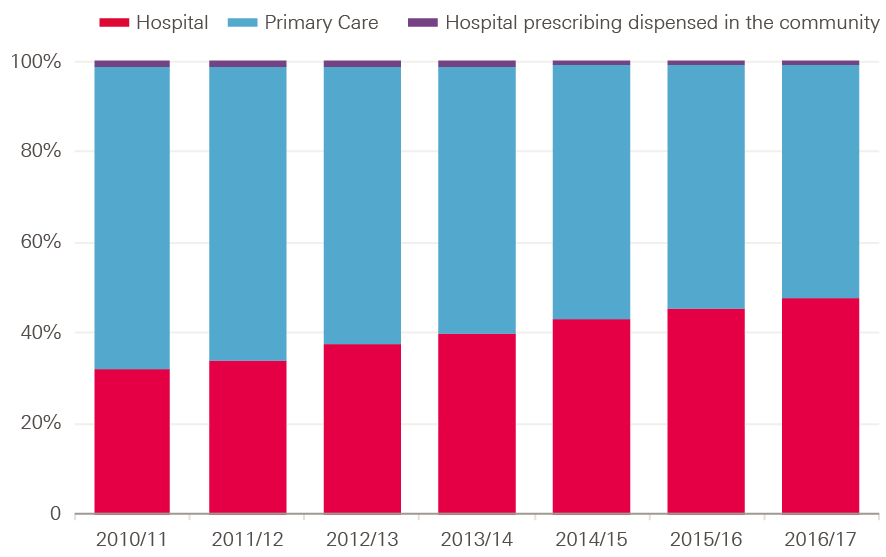
Note: Figures refer to ‘net ingredient costs’ of drugs excluding VAT. Hospital prescribing dispensed in the community refers to drug prescriptions written in hospital but dispensed in the community. Net Ingredient costs refers to the basic cost of a drug as used in primary care, but does not necessarily reflect the final price paid for drugs, as providers may individually negotiate different prices.
Source: NHS Digital 2017
‡‡‡ The efficiency factor is set by NHS Improvement to reflect the expected improvements made by NHS providers to deliver services at a lower cost.
§§§ These are estimated figures based on the net ingredient costs of drugs excluding VAT, and include high-cost drugs and drugs in the drug tariff. For hospitals, the figures do not necessarily represent what was paid by the hospitals, as NHS contracts provide discounts on many products.
Section five – Distribution of the sustainability and transformation fund
As discussed in earlier chapters, 2016/17 saw the introduction of the STF. NHS England provided the STF to NHS trusts based on an allocation determined by NHS Improvement, and agreed by NHS England. It was conditional on the trusts agreeing and meeting specified financial control totals.,,
The STF is provided directly from NHS England via a separate allocation method developed by NHS Improvement. The four principles for allocating the STF are that it should:
- support the provision of emergency services and address the financial and operational challenges of providers in connection with the provision of those services
- support the objectives set out in the planning guidance, including the requirement that during 2016/17 the NHS trust and foundation trust sector must, in aggregate, return to financial balance
- support the overall sustainability of the provider sector by incentivising greater efficiency savings in future without rewarding past poor- or under-performance compared to plan
- be explained to stakeholders as clearly and transparently as practicable.
Following these principles, NHS Improvement and NHS England agreed £1.6bn of the STF should be allocated to ‘providers of emergency care that have been under the greatest financial pressure’. The remaining £200m would then be targeted to support providers to achieve overall sustainability by driving maximum efficiencies, delivering a larger benefit than the funding due to the transformation of services. It therefore may not provide income to areas where the population has the highest need.
Distribution
The STF varied by region, which may have future implications for equity of access to care. Target allocations are estimated for CCGs to account for the needs of their population relative to other CCGs. This is used to apportion total available funding to each CCG, but due to historical differences in the funding received, the actual allocation for many CCGs is either above or below the target. This allocation is being improved over time to avoid any potentially negative impact of immediate changes in funding to commissioners.
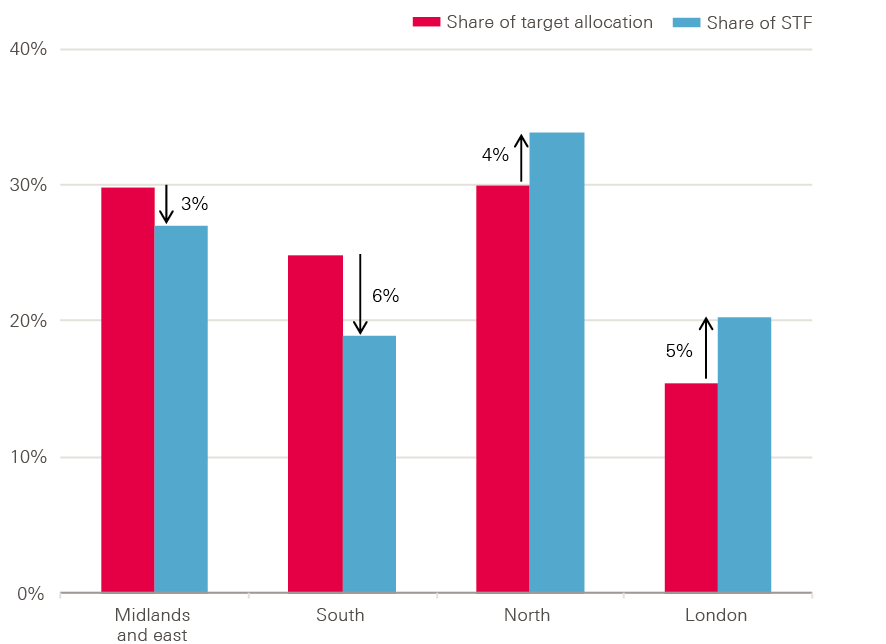
CCGs in London and the north of England were allocated more funding than they would have received if the STF was allocated according to relative population need, by 1.9% and 1.4% respectively. CCGs in the south of England, the Midlands and east of England received less funding than their target allocations, by 1.3% and 1.4% respectively (Table 2).
Table 2: Sustainability and transformation funding by region compared with CCG distance from target allocation, 2016/17
|
Region |
CCG final allocation (£bn) |
Target allocation (£bn) |
Share of target allocation |
Distance from target CCG allocation 2016/17 |
STF allocation (£m) |
Share of STF |
Gap between share of target allocation and share of STF |
|
Midlands and east |
£21.1 |
£21.4 |
30% |
-1.4% |
493 |
27% |
-3% |
|
South |
£17.7 |
£17.9 |
25% |
-1.3% |
345 |
19% |
-6% |
|
North |
£21.8 |
£21.5 |
30% |
1.4% |
619 |
34% |
4% |
|
London |
£11.3 |
£11.1 |
15% |
1.9% |
372 |
20% |
5% |
|
Total |
100% |
Source: Health Foundation analysis
Using the share of CCG target allocation for a region as a measure of population need, it is possible to identify whether STF funding was allocated relative to population need.
Figure 16: Share of sustainability and transformation funding by region compared to estimated population need
Source: Health Foundation analysis
The rationale for allocating the STF is different to the model for target allocations, so there is no reason that the pattern for STF should match that of CCG target allocations. However, the STF is intended to be temporary, with funding in the future reverting to the usual approach of being allocated based on relative need. This may be complicated. Moving solely to allocation based on relative need would potentially mean a loss of income in areas with higher funding, which could destabilise some trusts. Yet not doing so would increase the distance from target for many CCGs, and potentially have adverse effects on national equity of access to care.
Distribution to providers
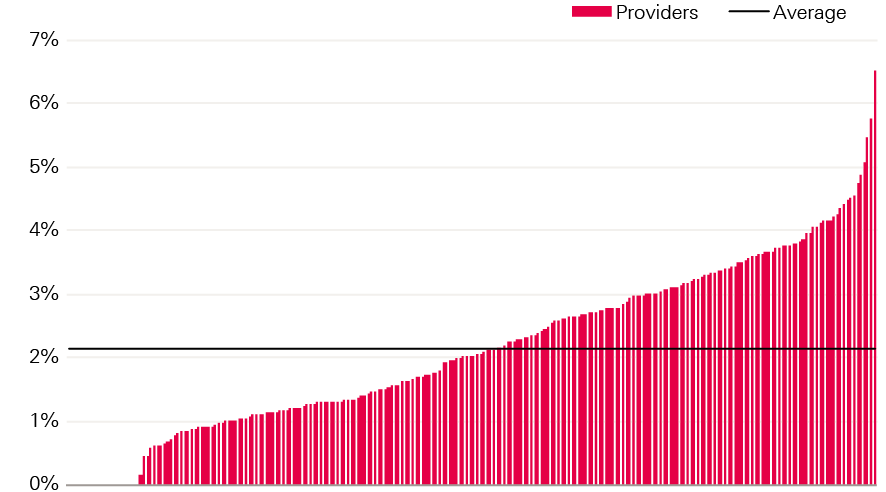
On average, the STF made up approximately 2.2% of total operating income for NHS trusts, but this varied significantly by trust. 21 trusts received no STF funding, and of those that did, it accounted for between 0.15% to 6.5% of total income (Figure 17). The STF accounted for 2.5% of income for acute trusts, 2.3% for specialist trusts, 1.4% for mental health trusts, 1.2% for community trusts and 1.2% for ambulance trusts.
Figure 17: STF as a percentage of operating income for NHS trusts in England, 2016/17
Source: Health Foundation analysis
STF funding was targeted at trusts providing emergency care services. However, there is no clear pattern between the amount of STF received as a percentage of operating income, and the net position of trusts (Figure 18). The STF is broadly distributed across trusts, meaning it reduces the deficits of those in deficit, but also increases the surplus for some trusts who would have had one without STF funding. A recent report from the NAO showed that 40% of total STF payments went to trusts with surpluses in 2016/17.
Figure 18: STF as a percentage of operating income for NHS trusts in England, sorted by net position (%)
Source: Health Foundation analysis
The STF was largely focused on trusts providing emergency care, so acute trusts received 84% of STF funding despite accounting for 75% of total operating revenue (Table 3).
Table 3: Share of sustainability and transformation funding by trust type compared to share of total income
|
Trust Type |
Proportion of operating revenue |
Proportion of STF |
|
Acute |
75% |
84% |
|
Ambulance |
3% |
2% |
|
Community |
4% |
2% |
|
Mental health |
15% |
9% |
|
Specialist |
4% |
4% |
Source: NHS Improvement quarterly performance reports
Impact on financial performance
While it is not possible to accurately estimate the true impact of the STF on financial performance, it is important to consider how the fund was distributed. This will have implications for future years, as the way funds are allocated may change due to the impacts of the STF.
Chapter 4 shows that, in total, income for NHS trusts (including the STF) grew faster than costs. If the STF is excluded then income would have risen at a slower rate than costs. This suggests that, without the STF, the total deficit may have been larger than in 2015/16.
However, this calculation can be misleading. If the £1.8bn had not been made available via the STF, it would have been available to commissioners through a different route. What the outturn for NHS trusts would have been in other circumstances would therefore depend on how the money was allocated.
For example, if it had been used by CCGs to commission additional services from NHS trusts, there would have been a corresponding cost to trusts of supplying these services, and the deficit would have been larger. Alternatively, if the funding had been allocated through increases to the national PbR tariff, without increasing activity, then the overall outcome for trusts may have been the same, although the distribution across trusts would be different: more funding would have gone to those trusts that were more dependent on the tariff. However, the STF funding was allocated based on agreed control totals for the planned surplus or deficit for each trust, providing a strong incentive to further reduce costs. Without this incentive, the total deficit may have been higher.
Another option is that funding may have been allocated to commissioners through normal routes. In this case, a portion of it is likely to have been spent on services from providers other than NHS trusts, such as GP services, or independent, local authorities or third sector providers, thus reducing income for NHS trusts. For example, 64% of CCG funding went to NHS trusts in 2016/17. Applying the same split of funding by CCGs to the STF would have seen £1.2bn going to NHS trusts instead of £1.8bn. If this came with no increase in costs, then the deficit would have been £600m higher, at £1.4bn.
It is therefore not possible to estimate the true impact of the STF on income, costs and the combined deficit, other than to say the deficit is likely to have been somewhere between the observed outcome of £806m and a maximum of £2.6bn.
¶¶¶ Although most of the funding is for financial controls, some of it is dependent on performance, including A&E, referral to treatment and cancer waiting standards.
Section six – Investment for the future
Improvements in the financial positions of trusts and commissioners were made possible by focusing additional funding on day-to-day services. Although the total budget for the DHSC rose by 0.6%, the budget for NHS England rose by 2.3%. This meant funding for all other areas of the DHSC budget fell by 9%, or £1.6bn (Table 4). This particularly impacted on long-term investment.
Table 4: DHSC and NHS England budgets, 2015/16 and 2016/17 (cash terms and 2017/18 prices)
|
Cash |
2017/18 prices |
|||||
|
2015/16 |
2016/17 |
2015/16 |
2016/17 |
Real-terms change |
Real-terms percentage change |
|
|
DHSC total budget |
£117.2bn |
£120.6bn |
£122.1bn |
£122.8bn |
£0.8bn |
0.6% |
|
NHS England budget |
£100.3bn |
£104.8bn |
£104.4bn |
£106.8bn |
£2.4bn |
2.3% |
|
DHSC excluding NHS England |
£17.0bn |
£15.8bn |
£17.7bn |
£16.1bn |
-£1.6bn |
-9.0% |
Note: The DHSC budget excluding NHS England, includes funding for public health, which fell by 3% in 2016/17 – this drop was a result of a 1% increase in the budget for PHE, but a 4% drop in grants to local authorities. Funding for HEE, which delivers education and training for NHS staff, remained broadly flat (Table 5).
Source: DH Annual report 2016/17, NHS England Annual report 2016/17
The capital budget was 4% lower in 2016/17 than in 2015/16. This budget includes funding for research and development, which also fell by 4%. There was a large fall in funding for informatics – which was 47% lower than in 2015/16 – and less money to cover depreciation, which is used to replace long-term assets, such as buildings and equipment, as they come to the end of their life.
Table 5: Change in spending for aspects of DHSC budget excluding NHS England
|
2015/16 |
2016/17 |
Change |
|
|
Public Health England |
£809m |
£819m |
1% |
|
Public health grants to local authorities |
£3,161m |
£3,451m |
-4% |
|
Health Education England |
£5,070m |
£5,072m |
0% |
|
Informatics† |
£318m |
£169m |
-47% |
|
Depreciation |
£1,161m |
£1,022m |
-12% |
|
Capital |
£4,843m |
£4,641m |
-4% |
|
Of which research and development |
£1,062m |
£1,017m |
-4% |
† – refers to expense component of DHSC informatics spend
Source: Department of Health Annual Report and accounts 2016/17
Capital spending
Investment in capital is essential for maintaining quality of care, achieving future transformation and improving efficiency. This includes a wide variety of items, ranging from buildings and land to machinery and IT, as well as depreciation, private finance initiative (PFI) costs, and research and development.
Prior to 2009/10 there was a 10-year period of significant increases in capital investment as a percentage of the total budget. However, spending on capital has declined in recent years; total capital spending was £1bn lower in 2016/17 than in 2010/11 (Figure 19). Since a rise in spend in 2013/14, capital spending has decreased by an average of 6.7% a year. This means capital spending is now less than 4% of the total spending, compared to approximately 6% in 2009/10. Research and development costs, which make up almost 20% capital spending, have fallen by 4% since 2013/14.
Figure 19: NHS capital spending in England, 2011/12–2016/17 (2017/18 prices)
Source: Department of Health Annual Report and accounts 2016/17
The fall in capital spending was largely due to repeated transfers from the capital budget to the revenue budget, in order to fund the day-to-day running of NHS trusts. In 2016/17, capital spending was 22% below the original planned level (Figure 20).
Figure 20: Plan and actual NHS capital spending in England, 2013/14–2016/17 (2017/2018 prices)
Source: Department of Health Annual Report and accounts 2016/17
An internationally recognised way of tracking capital spending is tracking the spend per head of the workforce. The number of WTE staff employed in the NHS in England increased by 6% between 2013/14 and 2016/17. As a result, capital spending per WTE fell by 23% – an average drop of 9% a year (Figure 21).
Figure 21: NHS capital spending per whole time equivalent staff, 2013/14–2016/17 (2017/18 prices)
Source: Department of Health Annual Report and accounts 2016/17, Health Foundation analysis
Decreasing capital expenditure has both financial and service impacts on providers. Trusts may not be able to purchase new equipment, and they may also face difficulties in making repairs and maintenance to existing facilities.
In 2016/17, there was an estimated maintenance backlog for hospital estates and facilities of £5.6bn, up from £5.2bn in 2015/16. Of this, £2.8bn represents backlog that is high or significant risk, up from £2.4bn in 2015/16. The ‘risk ratings for estates’ refers to risks related to clinical service and safety. High risk is where repairs/replacement must be addressed with urgent priority in order to prevent catastrophic failure, major disruption to clinical services or deficiencies in safety liable to cause serious injury and/or prosecution.
Both high and significant risk maintenance backlogs have been rising since 2012/13, while low risk backlogs have been decreasing. At 2016/17, the cost of high risk maintenance backlog is estimated at £965m. This is lower than the capital to revenue transfer of £1.2bn in 2016/17.
Investment in equipment has seen the biggest decline in spending between 2013/14 and 2016/17, falling by 54% at an average of 23% a year (Figure 22). Investment in new buildings fell by an average of 4.9% a year; investment in improving existing buildings fell by an average of 7.2%, and investment to reduce the backlog fell by 7.6%.
Figure 22: Investment in new equipment, 2013/14–2016/17 (2017/18 prices)
Source: Estates return information collection (ERIC), 2013/14–2016/17.
The DHSC’s total budget includes a ring-fenced portion of depreciation. Depreciation occurs from using the asset, leading to wear and tear which reduces its value. Apart from land, most of the assets (such as buildings and equipment) held by the DHSC are depreciated. These assets are depreciated on a straight-line basis over their estimated remaining useful lives. As a portion of funding for depreciation is ring-fenced, funding saved from these depreciation changes cannot be used for other non-ring-fenced expenditure.
Spending on depreciation by the DHSC was much lower in 2016/17 than in previous years. In 2016/17, depreciation was planned to be 28% higher than actual depreciation in 2015/16, but this was underspent by £447m. Outturn spending on depreciation was therefore 14% lower than in 2015/16.
The Naylor review highlighted the importance of capital investment to the productivity, transformation and long-term sustainability of the NHS.
**** The figure for grants to local authorities was restated for 2015/16 to account for the transfer of services for 0–5 year-olds from the NHS to local authorities: www.gov.uk/government/uploads/system/uploads/attachment_data/file/499614/PH_allocations_and_conditions_2016-17_A.pdf
†††† The DHSC TDEL contains a ring-fenced portion of depreciation, which was approximately £1bn in 2016/17.
‡‡‡‡ These figures refer to ring-fenced depreciation by DHSC.
Section seven – Investment in mental health services
Following growing concerns that funding for mental health services was lagging behind funding for acute care, the Mental Health Investment Standard (MHIS) – formally parity of esteem – was introduced in 2016/17. This requires all CCGs to increase investment in mental health services in line with their total allocation, so that mental health funding rises by at least as much as total CCG funding.
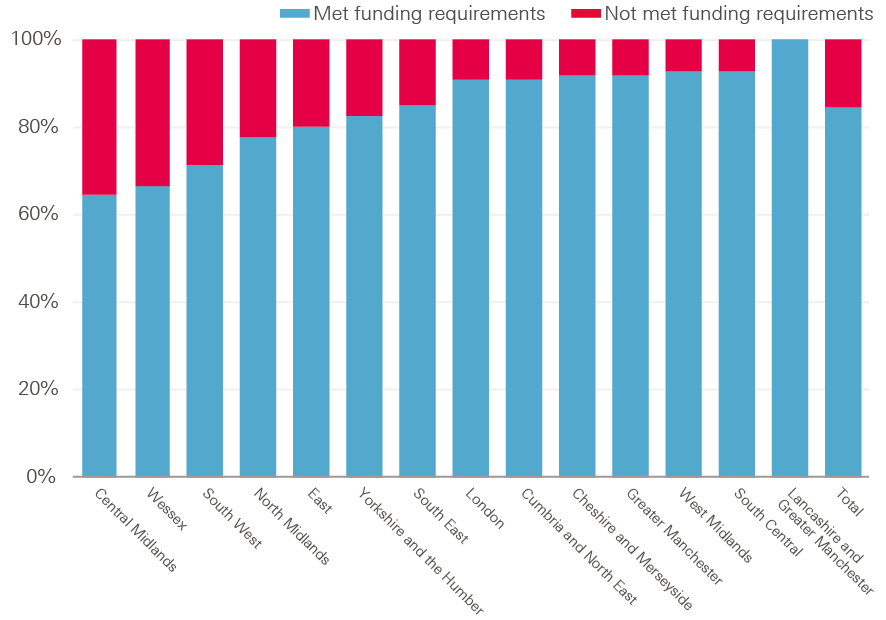
In 2016/17, 85% of CCGs met the MHIS; however, this varied by NHS ‘sub-region’. All CCGs in Lancashire and Greater Manchester met the standard, while only 64% of CCGs did so in Central Midlands (Figure 23).
Figure 23: Proportion of CCGs meeting the mental health investment standard by NHS sub-region, 2016/17
Source: Health Foundation analysis
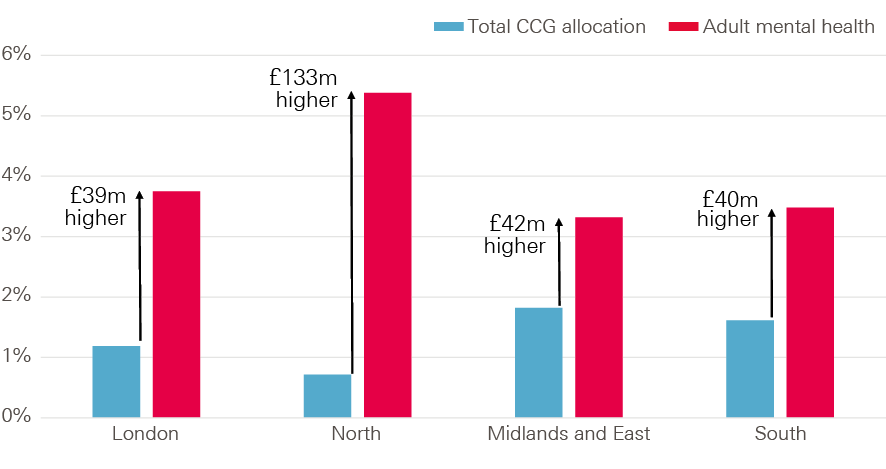
From 2015/16 to 2016/17 the amount CCGs spent on mental health rose from £9.3bn to £9.7bn, an increase of £379m (4.1%). In the same period CCG income (data provided by NHS England) rose by 1.3%. In order to meet the mental health investment standards, CCGs would have had to increase their spending on mental health by 1.3% (or £125m), in line with total CCG income increases. Mental health spending actually increased by £254m more than the minimum required to meet the standard. This was true in all parts of England, with London, the Midlands and East, and the South each spending £40m more than the minimum, and the North spending an additional £130m above the minimum.
Figure 24: Increase in investment for mental health services above the minimum required by the mental health investment standard, 2015/16–2016/17
Source: Health Foundation analysis
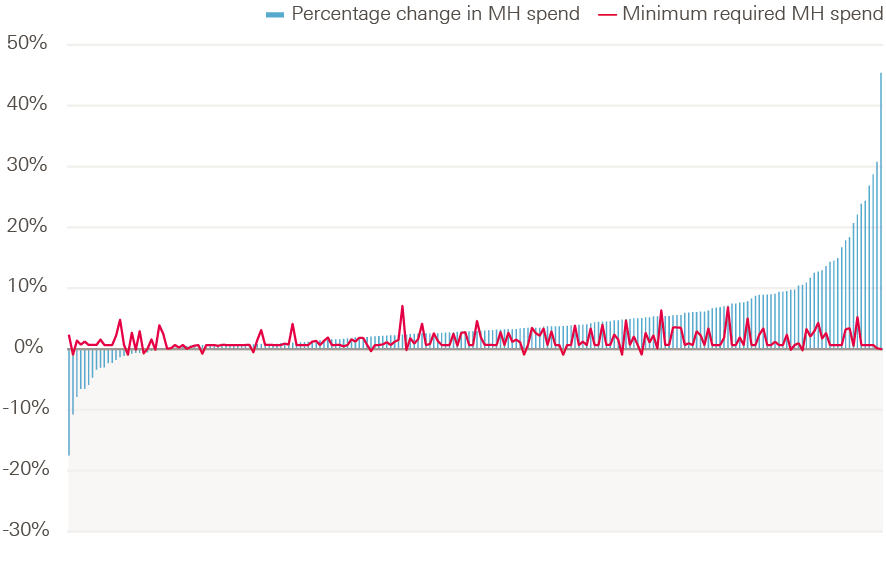
There was wide variation in the rate of change to mental health spending across CCGs from 2015/16 to 2016/17. This ranged from growth of 45% to a decrease of 17%. This trend did not follow the trend in growth of total CCG allocations (Figure 25). The Mental Health Investment Standard requires CCGs to raise their mental health spending in line with their overall allocations.
Figure 25: Growth in investment in mental health services by CCG from 2015/16 to 2016/17, compared to growth in adjusted CCG allocations from 2015/16 to 2016/17
Source: Health Foundation analysis
The additional £379m is welcome news for mental health services, which are in need of investment. However, it is not clear where this addition investment was spent at a national level. Mental health trusts provide the majority of services, but the income they received from NHS England and CCGs for patient care services only rose by £23m, leaving £356m to account for.
Additionally, mental health trusts received £158m of their total income from the STF. As this was provided directly from NHS England rather than CCGs, this is essentially separate to the MHIS investment.While this is received from NHS England, it is allocated separately from income for patient care, which is reported in Table 6.
Table 6: Change in CCG spend on mental health services and income received by mental health trusts, 2015/16–2016/17
|
|
2015/16 |
2016/17 |
Increase |
Difference between CCG increase and mental health trust income change |
|
CCG spend on mental health |
£9,347m |
£9,725m |
£379m |
– |
|
Mental health trusts income from NHS England and CCG |
£9,553m |
£9,575m |
£23m |
£356m |
|
STF received by mental health trusts from NHS E |
– |
£158m |
– |
– |
Note: Mental health trusts’ income from NHS England and CCG refers to income for patient care services, which does not include any STF. Figures do not sum due to rounding.
Source: DH annual report 2016/17
There are many possibilities for where this funding was invested; for example, mental health trusts provide other services such as community services but the breakdown of spend on these other services is not publicly provided. The Q3 performance report for 2017/18 shows that £6.3bn had been spent on mental health services, while income for mental health trusts was 29% higher at £8.1bn. So it may be that most of this additional funding did go to mental health trusts, but there was a fall in income for other services including community services.
Equally, some mental health services are provided by NHS trusts other than mental health trusts, so it may be that activity for these increased. However, activity for services included in the mental health care clusters fell by 1.5% in 2016/17., Within this, the mix of activity changed towards more expensive services, so cost-weighted activity fell by 0.3%. Total spending on these services fell by 0.8%.
Mental health care is also provided through primary care services and prescribing. Yet despite an increase in the number of prescriptions dispensed for anti-depressants, spending fell by 11% (£29m), suggesting there hasn’t been a big increase in medication costs (see Figure 26).
Figure 26: Change in number of prescriptions for antidepressants prescribed, and total spending on antidepressants between 2015/16 and 2016/17
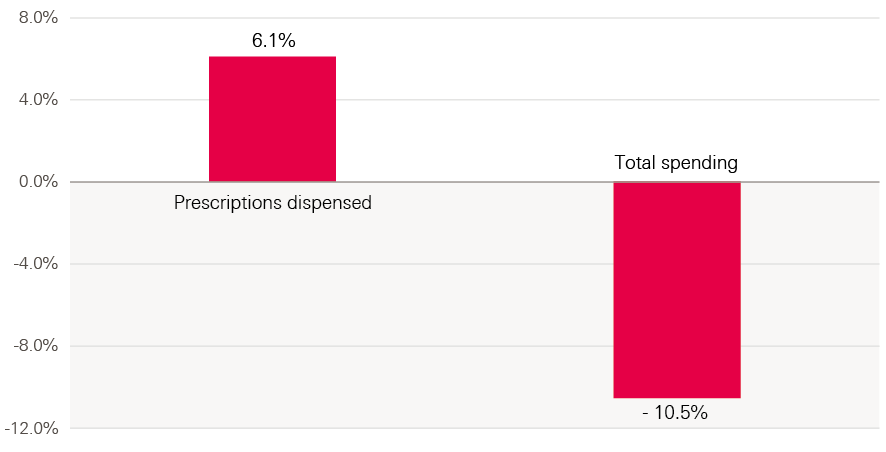
Source: Health Foundation analysis
Another explanation for the £356m of unaccounted-for funding (Table 6) is an increase in spending on mental health services provided by non-NHS providers. But total spending by commissioners on non-NHS providers rose by just £200m, so even in the unlikely event this was all for mental health services it would not fully explain the gap.
Ultimately, it has not been possible to identify where the additional investment for mental health services was spent.
Improving Access to Psychological Therapies programme
It is likely that some of the additional mental health funding for 2016/17 will have been allocated to the Improving Access to Psychological Therapies (IAPT) programme. This was introduced in 2008 to allow adults living with common mental health conditions to talk to a mental health professional to help them manage their conditions. There were 1.4 million new referrals to IAPT in 2016/17, of which 965,000 entered treatment and 567,000 finished a course of treatment. 87.5% waited less than six weeks to enter treatment, exceeding the target of 75%. 98.2% did so within 18 weeks, exceeding the target of 95%.
In total, CCGs spent £430m on IAPT services in 2016/17. Spend varied widely across CCGs, with some spending £0.03 per head of population, and others spending £17.56 – a figure more than 500 times larger (see Figure 27). Some of this variation will be explained by different patterns of demand and costs, but it is unlikely to fully explain the extent of variation.
When we include the figure of £38m, IAPT spending by CCGs is planned to increase by 8.5% to £467m in 2017/18. Total spending on mental health services by CCGs is currently planned to increase by 1%, so IAPT services will account for an increasing share of total spending on mental health.
Figure 27: Variation in spend per head on IAPT by CCG in 2016/17
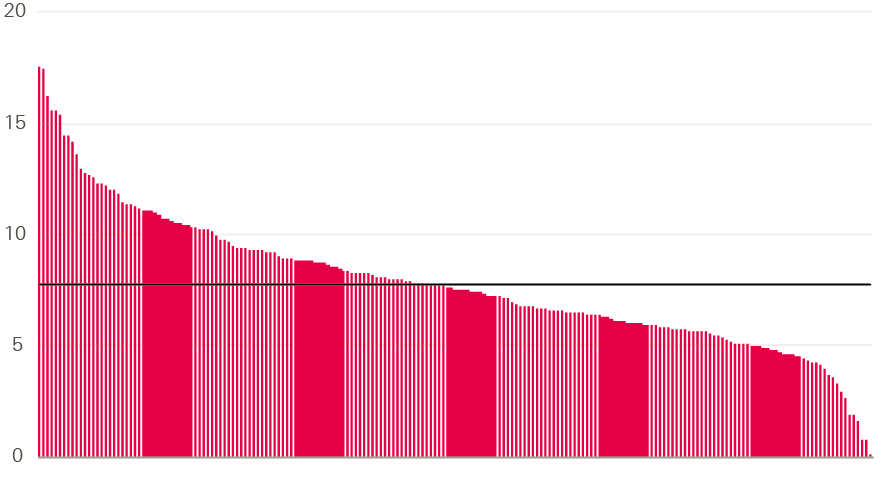
Source: Health Foundation analysis
Beyond 2016/17
In March 2018, NHS England released its mental health dashboard for Q1 and Q2 2017/18. Published figures include a 2017/18 planned CCG mental health spend of £10bn and a total planned mental health spend for 2017/18 (including CCG and specialised commissioning spend) of £11.9bn. 85% of CCGs were planning to meet the MHIS by the end of 2017/18, matching the proportion meeting it in 2016/17.
The updated planning guidance for 2018/19 states that 100% of CCGs are expected to meet the MHIS, with investment in mental health rising at a faster rate than overall programme funding. To make sure funding is allocated effectively, additional data on how this funding is spent should be collected and analysed.
§§§§ NHS areas in England are organised into 14 sub-regions, also known as ‘local offices’.
¶¶¶¶ CCG allocations were provided by NHS England and are adjusted for the additional children and young people mental health monies included in 2016/17 baselines and spend.
***** This is income only from NHS England and CCGs, so differs from the increase in total income described in Chapter 4.
‡‡‡‡‡ For example, at Q3 2017/18, income to mental health trusts for patient services was £8.1bn, while total income for mental health services in all providers (including mental health trusts), for patient services was only £6.3bn.
§§§§§ Mental health care clusters are groups of people with similar characteristics. They can be used in NHS Reference costs to categorise activity and cost data.
¶¶¶¶¶ Figure from correspondence with NHS England. £38m represents the IAPT share of the mental health five year forward view in year allocations for CCGs. This figure is not included in the mental health dashboard planned spend
Section eight – Discussion
Despite minimal growth in total health care funding and falling spending per head in 2016/17, investment was targeted at front-line services to halt and reverse a trend of rising deficits among NHS trusts. This was arguably essential, to provide some level of sustainability for trusts providing vital services to those in need. However, targeting investment in this way has limited the funding available for long-term investment and transformation.
The impact of the sustainability and transformation fund
The major vehicle for delivering funding for trusts was the newly created STF of £1.8bn. As the name suggests, the fund was intended to support the transformation of services, as well as sustainability. However, it is recognised by NHS England and NHS Improvement that the influence on transformation was minimal, and the updated planning guidance for 2018/19 indicates that the STF will be renamed the provider sustainability fund (PSF).
This raises concerns for the long-term transformation programme set out in the Five year forward view. In a recent report, the NAO highlights concerns with the national NHS transformation programme, which is managed through 44 Sustainability and Transformation Partnerships (STPs). It states that progress in local transformation is being hampered by lack of resources and overly optimistic plans. The report also argues that investment is too focused on the most advanced STPs, thus leaving less advanced areas behind – this is a common theme across NHS transformation efforts.
That is not to say that the STF has had no impact. As the data show, it has led to a substantial fall in the total deficit of trusts, from £2.5bn in 2015/16 to £806m in 2016/17. However, this was still more than the planned deficit of £580m, and a long way from the original intention to achieve financial balance, for the year. The decline in the deficit has also not been sustained, with a forecast for the deficit to rise again in 2017/18.
Despite STF funding being targeted at trusts providing emergency care that faced the greatest financial pressure, the challenges of meeting rising emergency demand continued. Performance against the 4-hour A&E target continued to decline, and failed to improve at the rate set for the STF (see Figure 28). Performance against other key standards also deteriorated, including the requirement to see 92% of elective referrals within 18 weeks, and the target for 85% of cancer patients referred by a GP to be seen with 62 days.
Figure 28: Percentage of A&E all type patients seen within 4 hours, 2015/16—2016/17
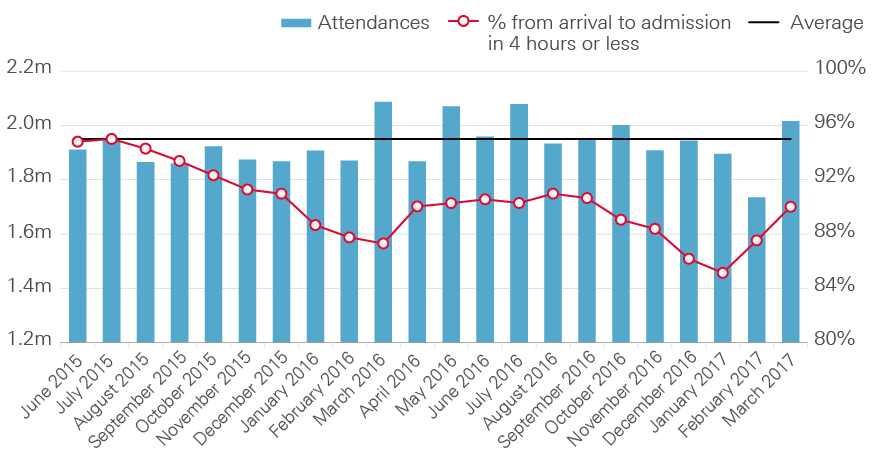
Source: NHS England, A&E attendances and emergency admissions
The lack of improvement in finances and performance at the scale expected means the STF has also been used to support trusts to move towards a sustainable position in 2017/18, and has been increased to £2.45bn for 2018/19, as the renamed PSF. There will also be a new commissioner sustainability fund (CSF) next year worth £400m, to help improve commissioner performance. This is funded in part through the additional £1.6bn for the DHSC’s total budget, announced in the Autumn Budget, but also from an extra £540m from the DHSC’s wider budget. This continues the trend of moving funds from the wider budget to front-line services.
The PSF will not continue indefinitely – eventually the funding will be allocated through normal commissioning routes; however, this must be done with care. The STF was not allocated in line with standard CCG need estimates in 2016/17, with more funding going to areas where CCG allocations are greater than the estimated share of need. Allocating the PSF directly to CCGs could therefore increase the distance from target for many of them, potentially leading to lower access in areas that receive allocation below the target. But allocating in a way to avoid this could reduce the funding some trusts receive. Equally, only 64% of CCG funding goes to NHS trusts, so simply allocating directly to CCGs through the normal method may see a reduction in funding allocated to NHS trusts. It is likely that a phasing out of the PSF in future years will therefore be required.
Non-NHS providers
Commissioners and NHS providers purchase health care from non-NHS providers. In the Health Foundation’s previous report on NHS finances, we highlighted that this can be a result of a lack of capacity to provide pre-planned care. The design of the national tariff means that the rate of return on pre-planned care is higher than for emergency care. As a growing proportion of trust activity comes from emergency admissions, this reduces capacity for pre-planned care, with a negative impact on overall income.
Although growth in CCG spending on non-NHS providers was much lower than in previous years (see Chapter 3), the rate of growth of spending by NHS trusts on non-NHS providers continues to rise at pace – spending increased by 11% between 2015/16 and 2016/17.
Table 7 shows that the growth in planned care provided by non-NHS providers has continued in 2016/17. Elective inpatient admissions among non-NHS providers rose by 6.8% in 2016/17, compared to 2.2% among NHS trusts. For outpatients, the number of appointments rose by 6% for non-NHS providers, compared to 5% for NHS trusts. This means the share of pre-planned care provided by non-NHS providers has also risen between 2013/14 and 2016/17 – from 5.6% to 6.6% for elective inpatients admissions and from 5.5% to 6.1% for outpatient appointments.
Table 7: Increase in acute hospitals’ elective inpatients, outpatients and emergency inpatients for NHS and non-NHS providers, 2013/14–2016/17 (%)
|
Elective inpatients |
Outpatients |
Emergency inpatients |
|||||||
|
Total |
NHS |
Non-NHS |
Share of Non-NHS |
Total |
NHS |
Non-NHS |
Share of Non-NHS |
Total |
|
|
2013/14 |
– |
– |
– |
5.6% |
– |
– |
– |
5.5% |
– |
|
2014/15 |
3.3% |
2.7% |
12.4% |
6.1% |
4.4% |
3.9% |
12.4% |
5.9% |
3.7% |
|
2015/16 |
2.3% |
2.0% |
6.8% |
6.4% |
4.4% |
4.3% |
7.2% |
6.1% |
2.7% |
|
2016/17 |
2.5% |
2.2% |
6.8% |
6.6% |
5.0% |
5.0% |
6.0% |
6.1% |
2.1% |
|
Average increase 2013/14 to 2016/17 |
2.7% |
2.3% |
8.6% |
– |
4.6% |
4.4% |
8.5% |
– |
3.2% |
Source: Health Foundation analysis
NHS trusts continue to face problems with emergency care crowding out planned activity in 2017/18. At Q3, income was 2.6% higher from non-elective services, and 1.7% higher from A&E than expected. Income from planned care was lower than expected, at 2.5% for inpatient care, 0.7% for first outpatient appointments and 3.3% for follow-up outpatient appointments. With a lower rate of return through the tariff for emergency care, this trend continues to make the financial challenge more difficult.
Agency spending is falling, but continues to be over plan
Improvement was made in certain areas of cost – most substantially in agency spend, which the Health Foundation highlighted as an area of concern in previous reports. Having risen by 11% between 2014/15 and 2015/16, spending on agency staff fell by 19% in 2016/17. This followed the introduction of a cap on agency spending introduced by NHS Improvement. However, this does not wholly address the underlying issue of high vacancy rates across the NHS. In Q3 2017/18, there were over 35,000 WTE vacancies for nursing staff, and over 9,500 for medical staff – vacancy rates of 10.3% and 7.9% respectively. The number of GPs has fallen by 3%, from 34,025 at September 2015 to 33,062 at September 2017. Despite the improvement in agency spending in 2016/17, total agency spend was still 24% over plan, and is forecast to be 5.5% over plan in 2017/18. Without a clear workforce strategy to help reduce vacancy rates across the NHS, the issue of agency spending is unlikely to disappear.
Capital spending falling in the UK and low against OECD comparator countries
The focus on providing funding to commissioners and trusts for front-line services comes at the cost of long-term investment. Capital spending has fallen by 19% since 2013/14, yet the UK already invests a relatively low amount in health care capital compared to other Organisation for Economic Co-operation and Development (OECD) countries (see Figure 29). In 2015, the UK spent 0.3% of GDP on capital, compared to an OECD average of 0.5%. This continues a long-term trend in low capital investment – the UK’s capital spending has been below the OECD average every year except two since 2000 (Figure 30). Increasing spending to the OECD average would mean an additional £3bn would be available for investment in health capital across the UK. For England, this would translate to approximately £2.5bn, which is about half of total annual capital spending in the NHS.
Figure 29: Spending on health capital as a percentage of GDP in 2015
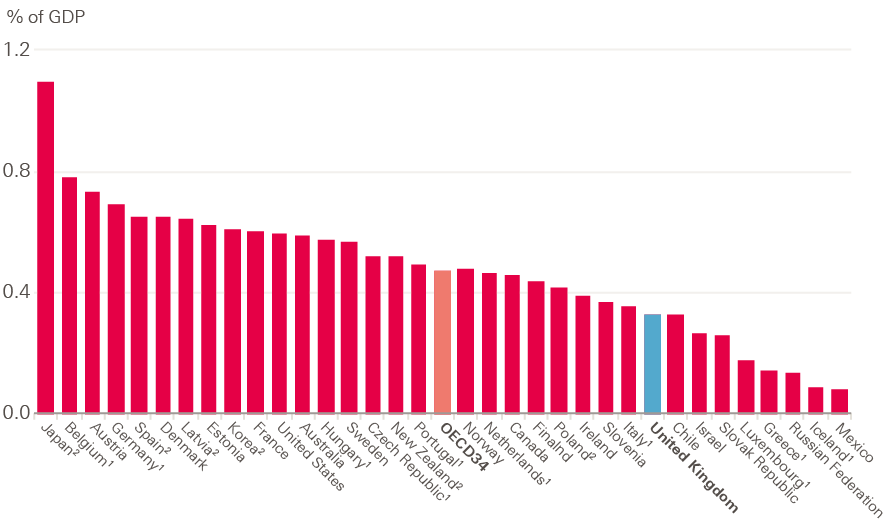
1. Refers to gross fixed capital formation in ISIC 86: Human health activities (ISIC Rev. 4).2. Refers to gross fixed capital formation in ISIC Q: Human health and social work activities (ISIC Rev 4).
Source: OECD data
Figure 30: Capital spending in health care as a percentage of GDP, 2000–2015
Note: Capital spending indicated is for gross capital formation of all fixed assets.
Source: OECD data
The recent review of NHS property and estates by Sir Robert Naylor indicated that higher capital investment would be required to allow the NHS to achieve the level of transformation required by the Five year forward view. Following this, an additional £3.5bn of capital funding was announced in the 2017 Autumn Budget between 2017/18 and 2022/23. This included an additional £500m for 2017/18, although £1bn has been transferred from the capital to the resource budget, so actual capital spending will still be below the original plan.
Spending on mental health services on the rise, but more work is needed to identify where it is going
2016/17 was a good year for funding of mental health services. As a minimum to meet the investment standard, CCGs would have needed to increase spending by at least £125m. Many CCGs opted to increase spending by more than the minimum required, so investment in mental health services rose by £379m – this is a 4% increase in real terms. Where this additional funding is being distributed is unclear. Funding for mental health trusts did not rise by as much as CCG allocations for mental health spending, spending on medication (such as antidepressants) fell in real terms, and cost-weighted activity for mental health care clusters fell. Increased investment in these services is vital, but it is also crucial that any investment represents the best value for high quality services. It is not possible currently to say whether this is the case. There is ongoing commitment to the Mental Health Investment Standard: the 2018/19 planning guidance update clarifies that 100% of CCGs must meet it, compared to 85% in 2016/17. It will be increasingly important to clarify how the additional investment is spent, to ensure the best possible improvement in services.
****** These numbers refer to total GPs excluding locum staff.
†††††† Comparable figures are provided for the UK rather than England.
‡‡‡‡‡‡ As this is using data from the OECD, it includes private as well as NHS spending.
§§§§§§ This estimate is based on the proportion of health expenditure in the UK that is from England (84%) in 2015/16, from Public Expenditure Statistical Analysis 2015/16 data.
Section nine – Conclusion
The NHS could not continue with a trend of rising deficits among trusts and commissioners. Action was required to stabilise the system, and focusing funding on front-line services in 2016/17 has had a positive impact on provider finances. However, this has come at the expense of long-term investment, and funding for transformation. It will therefore have implications for the sustainability of NHS services in the future.
As its name suggests, the STF was originally intended to support transformation as well as to improve financial performance. But transformation did not occur, and appears to no longer be an aim of the fund, as reflected by its change in name from the STF to the PSF – the provider sustainability fund.
The manner of allocation of the STF also meant that most funding went to acute trusts in 2016/17. This may have worked against the transformation principles set out in the Five year forward view, which envisions more services moving out of hospital and towards primary and community services.
Forgoing long-term investment to protect day-to-day services may be an appropriate tactic for a short period of austerity; however, the NHS is now in its seventh year of very low funding growth. Without significant investment above current plans, this is likely to continue until at least 2020/21. Continuing to forgo long-term investment will make the challenge of meeting demand pressures through improvements in efficiency increasingly difficult.
References
- Health Foundation, King’s Fund and Nuffield Trust. Autumn Budget 2017: what it means for health and social care; 2017. Available from: www.health.org.uk/publication/autumn-budget-2017-what-it-means-health-and-social-care
- Lafond S, Charlesworth A, Roberts A. A year of plenty? An analysis of NHS finances and consultant productivity. The Health Foundation; 2017. Available from: www.health.org.uk/publication/year-of-plenty
- Lafond S, Charlesworth A, Roberts A. A perfect storm: an impossible climate for NHS providers’ finances?. The Health Foundation; 2016. Available from: www.health.org.uk/publication/perfect-storm-impossible-climate-nhs-providers'-finances
- NHS England Mental Health Taskforce. The five year forward view for mental health. NHS England; 2016. Available from: www.england.nhs.uk/wp-content/uploads/2016/02/Mental-Health-Taskforce-FYFV-final.pdf
- Department of Health (DH). Annual report and accounts 2015/16. London: DH; 2016. Available from: www.gov.uk/government/publications/department-of-health-annual-report-and-accounts-2015-to-2016
- HM Treasury. Spending review and Autumn Statement 2015. Available from: https://assets.publishing.service.gov.uk/government/uploads/system/uploads/attachment_data/file/479749/52229_Blue_Book_PU1865_Web_Accessible.pdf
- The Conservative and Unionist Party Manifesto 2017. Available from: www.conservatives.com/manifesto
- NHS England. Annual Report 2016/17. NHS England; 2017. Available from: www.england.nhs.uk/publications/annual-report
- National Audit Office (NAO). Sustainability and transformation in the NHS. NAO; 2018. Available from: www.nao.org.uk/wp-content/uploads/2018/01/Sustainability-and-transformation-in-the-NHS.pdf
- NHS Improvement. NHS Improvement Board Meeting Papers, 29 March 2018. Item 12 – Consolidated Month 11 2017/18 Financial Report. NHS Improvement; 2018. Available from: www.england.nhs.uk/publication/nhs-england-board-meeting-papers-29-march-2018
- Monitor. 2016/17 National Tariff Payment System. 2016. Available from: www.gov.uk/government/uploads/system/uploads/attachment_data/file/509697/2016-17_National_Tariff_Payment_System.pdf
- NHS Improvement. Quarterly performance of the NHS provider sector: quarter 4 2016/17. Available from: https://improvement.nhs.uk/resources/quarterly-performance-nhs-provider-sector-quarter-4-1617
- Dayan M. How much has the NHS saved by holding down pay? The Nuffield Trust; 2017. Available from: www.nuffieldtrust.org.uk/news-item/how-much-has-the-nhs-saved-by-holding-down-pay
- Available from: https://improvement.nhs.uk/uploads/documents/Method_paper_-_STF_8march_v3.1_FINAL.pdf
- NHS England, NHS Improvement. Strengthening financial performance & accountability in 2016/17. NHS England, NHS Improvement; 21 July 2016. Available from: www.england.nhs.uk/wp-content/uploads/2016/07/strength-fincl-perfrmnc-accntblty-2016-17.pdf
- NHS Improvement. The Sustainability and Transformation Fund and financial control totals for 2016/17: methodology. NHS Improvement; 2016. Available from: https://assets.publishing.service.gov.uk/government/uploads/system/uploads/attachment_data/file/506568/Method_paper_-_STF_8march_v3.1_FINAL.pdf
- Department of Health (DH). Annual report and accounts 2016/17. DH; 2017. Available from: www.gov.uk/government/publications/department-of-health-annual-report-and-accounts-2016-to-2017
- Naylor R. NHS property and estates. Why the estates matters for patients. Sir Robert Naylor; 2017.Available from: www.gov.uk/government/uploads/system/uploads/attachment_data/file/607725/Naylor_review.pdf
- Appleby J. NHS urgent facilities repairs: is your hospital on the critical list. BMJ 2017;359;j5479. Available from: https://www.bmj.com/content/359/bmj.j5479
- Naylor C. Is there ‘parity of esteem’ between mental and physical health? The King’s Fund; 2017. Available from: www.kingsfund.org.uk/publications/articles/big-election-questions-parity-mental-physical-health
- NHS England. Delivering the Forward View: NHS planning guidance 2016/17 – 2020/21. NHS; 2015. Available from: www.england.nhs.uk/wp-content/uploads/2015/12/planning-guid-16-17-20-21.pdf
- NHS Improvement. Quarterly performance of the NHS provider sector: quarter 3 2017/18. Available from: https://improvement.nhs.uk/resources/quarterly-performance-nhs-provider-sector-quarter-3-201718
- NHS England. Mental Health Clustering Booklet v4.0 2015/16. NHS England; 2016. Available from: https://assets.publishing.service.gov.uk/government/uploads/system/uploads/attachment_data/file/379574/S118_Annex_7C_NTCN1516.pdf
- NHS Improvement. 2016/17 reference cost data. Available from: https://improvement.nhs.uk/resources/reference-costs
- NHS Digital. Psychological Therapies, Annual report on the use of IAPT services – England, 2016-17. NHS Digital; 2017. Available from: https://digital.nhs.uk/catalogue/PUB30157
- NHS England. Mental Health Five Year Forward View Dashboard, Q1 and Q2 2017/18. Available from: www.england.nhs.uk/publication/mental-health-five-year-forward-view-dashboard
- NHS England, NHS Improvement. Refreshing NHS Plans for 2018/19. NHS England, NHS Improvement; 2018. Available from: www.england.nhs.uk/wp-content/uploads/2018/02/planning-guidance-18-19.pdf
- HM Treasury. Autumn Budget 2017. Available from: www.gov.uk/government/publications/autumn-budget-2017-documents