Introduction
As voters prepare to go to the polls on 8 June, the NHS is once again a top concern. According to Ipsos MORI, in March 2017, 45% of the public identified the NHS as an important issue facing Britain, the same proportion as in March 2015, just before the last general election. Since then, public perceptions of the NHS in England have been framed by a steady stream of stories in the media about shortages of staff, hospitals running up deficits, overwhelmed accident and emergency services, and, more recently, a lack of social care leaving older people unable to leave hospital.
Although social care is a less pressing concern for the general public – 10% of people ranked it as an important issue in the same poll – a growing number of voices inside and outside government have been calling for a long-term solution to a chronically underfunded service.
So how concerned should the public be about the future of the NHS and social care? And what questions should they be asking politicians on the campaign trail about the future of health and social care?
To help inform this debate, the Health Foundation is publishing three briefings ahead of the June 2017 general election on: NHS and social care finances, the quality of care provided by the NHS, and the NHS and social care workforce. These briefings will pull together evidence and analysis from the Health Foundation’s work in these important areas of social policy. They will focus mainly on health and social care in England, as the control of these services in Northern Ireland, Scotland and Wales is a devolved matter.
All financial data in this report have been adjusted to 2017/18 prices using HM Treasury gross domestic product (GDP) deflators – a whole economy measure of inflation as of March 2017.
For more information on the data and reports mentioned in this briefing, please see the list of sources at www.health.org.uk/publication/election-briefing-nhs-and-social-care-funding.
Funding of the NHS and social care: what are the challenges?
The debate about funding for health and care services can seem bewildering. On the one hand, the government can rightly claim to have invested record amounts of money into the NHS. On the other hand, experts from a range of organisations, including the Health Foundation, argue that even more investment will be needed, particularly if health and social care services are to meet the needs of a changing society and make best use of the new technologies and treatments that are available.
This briefing aims to clarify the debate on three main challenges:
- Funding and social care: how big a problem is it?
- Funding and the NHS: two years of famine ahead?
- Funding for social care and the NHS: how much might be needed beyond 2020?
We summarise the evidence and offer commentary on the options that need to be considered if both of these essential services are to meet the public’s needs in the future.
Funding and social care: how big a problem is it?
Social care helps people with disabilities of all ages to live as independently as possible. Services assist people with the basics of daily life, such as bathing, dressing, eating or going to the toilet, either within people’s own homes, or in residential or nursing homes. In England, people have their social care partly or wholly funded by local authorities if they have high needs and low incomes, while many others pay for it themselves.
Social care will need immediate attention from an incoming government, as the current public system is severely underfunded. With local authorities forced to focus dwindling public funds on the most vulnerable, a growing number of people on low incomes are no longer eligible for public support for their care, and now face a choice between unaffordable social care bills, or doing without. And for those with higher incomes and assets, social care for conditions such as dementia can result in huge bills – what are known as catastrophic care costs. At 65 years' old, around one in ten people face future lifetime costs of over £100,000 for their social care needs.
What’s the evidence?
In 2015/16 local authorities in England spent £16.8bn on social care for adults, which is equivalent to 14% of the health care budget. 52% of social care funding is spent on those aged 65 years and older. The number of people in this age group is growing rapidly, as shown in Figure 1: it increased by almost a million in England from 2010 to 2015, and will grow by a further million by 2020.
Figure 1: Growth in English population by age group
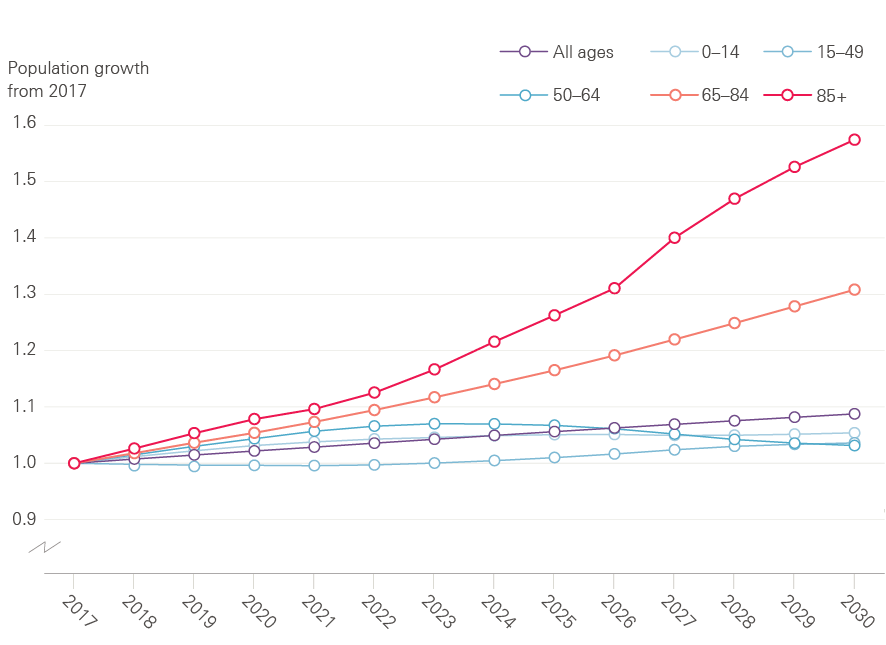
Source: ONS population projections, 2014
The remaining 48% of funding is spent on supporting younger adults with disabilities, with 285,000 people aged 18–64 years receiving long-term support in 2015/16. Need for social care services among younger adults will rise as medical advances increase survival rates for people with serious health conditions, people who have had accidents, and for premature babies.
Publicly funded social care in England has always been rationed according to need and financial means, unlike the NHS. The publicly funded element of provision, to help the poorest members of society, has fallen by 8% between 2009/10 and 2016/17 (see Figure 2).
Figure 2: Public spending on adult social care in England, 2009/10 to 2016/17 (2017/18 prices)
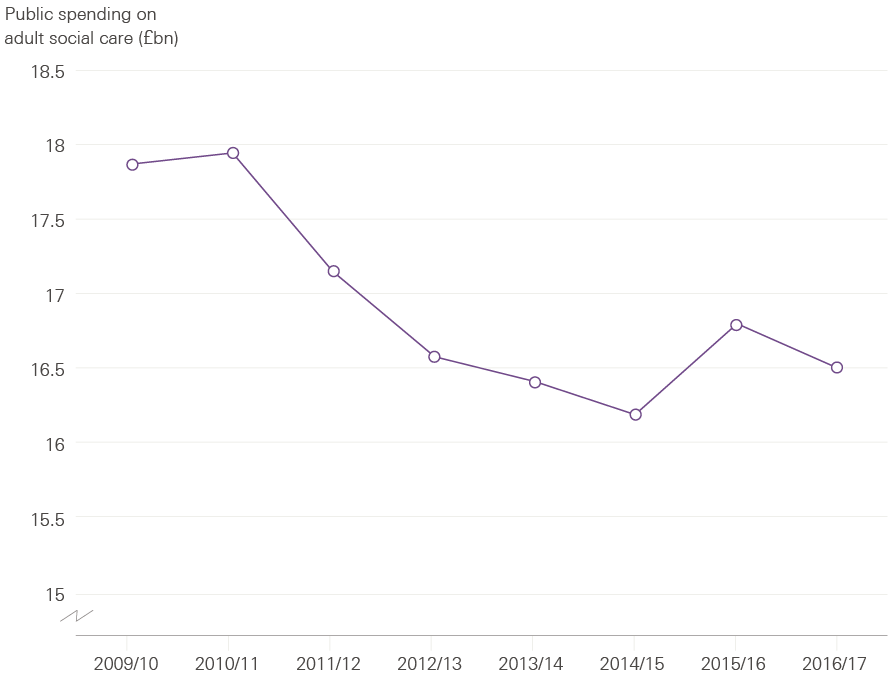
Source: NHS Digital personal social services expenditure and unit costs; DCLG local authority revenue expenditure and financing.
This has meant that local authorities have tightened the eligibility criteria that people have to meet to qualify for publicly funded social care. As a result, 400,000 fewer people received publicly funded care in 2012/13 than in 2009/10, despite rising demand. In 2015/16, the number of people aged 65 and over living in England increased by 2% (around 170,000 people), yet the number of them receiving social care fell by 2%. Those no longer eligible for public funding have to pay for their own care, arrange informal help – from friends, family or charities – or make do without. The percentage of people whose family was paying for additional care or support increased from 9.5% to 10.4% between 2014/15 and 2015/16.
In 2015, the new Conservative government postponed the implementation of a part of the Care Act 2014 until April 2020. This law would have improved access to publicly funded social care by raising the threshold at which home owners would start needing to pay for their own care from £23,250 in assets to £118,000, giving more people with modest means access to public help. It would also have capped the amount that any person could spend on their own social care to £72,000 over their lifetime.
Under the current system, people with assets of over £23,250 have to pay for their own residential care. When their assets are between £14,250 and £23,250, local authorities will pay some of the cost but each person also has to make a contribution towards their own care. Social care is only fully funded once a person’s assets fall below £14,250, including their home if they own it. There is currently no cap on the maximum a person can spend on these services before their assets fall to these levels.
The funding pressures on social care were acknowledged by the government in the 2015 spending review, with an additional £1.5bn earmarked via ring-fenced national funding in 2019/20. Local authorities were also permitted to raise up to a collective total of £1.8bn by 2019/20 through a new council tax ‘precept’, allowing them to increase council tax by up to an additional 2% a year to fund adult social care. Further announcements followed in December 2016 and the spring budget 2017, with additional funding of up to £1.5bn being made available for 2017/18, and an extra £324m for 2019/20 (in 2017/18 prices). Overall, ring-fenced social care funding from a combination of government grants, transfers from the NHS, and additional council tax could add as much as £5.4bn to local authorities’ spending power for adult social care in 2019/20. However, as indicated in Figure 3, this would still leave an estimated gap of around £2.1bn in that financial year.
Figure 3: Social care funding gap, 2015/16–2019/20 – Gap between estimated public spending on adult social care and funding pressures (2017/18 prices)
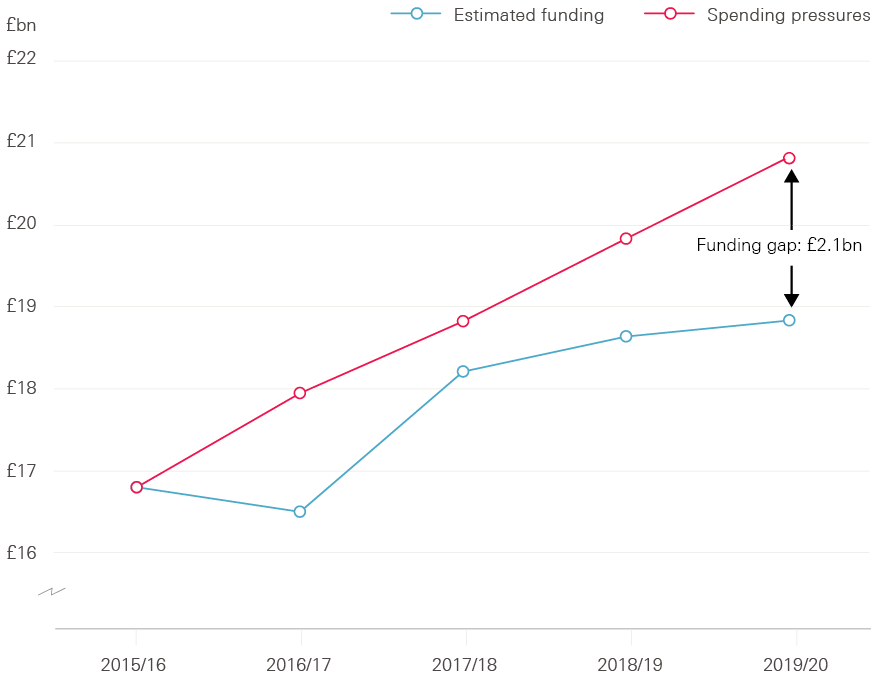
Source: Health Foundation analysis based on multiple sources
If local government continues to invest in social care from its general allocations, spending on social care will rise by an average of 2.8% a year between 2015/16 and 2019/20. This is a marked turnaround from the policy of cuts to social care funding of the 2010 to 2015 coalition government: social care funding will now be rising at a faster rate than health care funding over the next few years. But pressures on the social care system are increasing even more rapidly, driven by the growing numbers of people needing care, as well as rising cost pressures, particularly the introduction of the ‘National Living Wage’. Funding pressures on social care – including the additional cost of the National Living Wage – are projected to rise by about 5.5% a year (taking account of inflation) for the rest of this decade.
The government’s additional funding for social care was welcomed by many, but it is only a temporary fix. Even with this investment, we estimate there will still be a funding gap for social care of £600m in 2017/18, and around £2.1bn by 2019/20. These sums are an estimate of the additional money needed to maintain quality and access to social care at the same level provided in 2015/16. It does not include reversing any of the reductions to the numbers of people receiving care that have happened since 2009/10.
The government has also acknowledged the need for a longer term solution for funding social care, with the announcement of a green paper to be published later in 2017.
What should the next government do?
- The immediate financial pressure on social care cannot be ignored. Even with the extra funding announced since 2015, the funding gap will reach £2.1bn by 2019/20. Closing this gap will not be enough to restore the services provided to those who have lost access to support and care since 2009/10. In the first instance, any future government will have to address this gap, the burden of which has fallen on the individuals and families least able to absorb it.
- The government will also need to commit to full implementation of the Care Act 2014, which was based on the recommendations of the Commission on Funding of Care and Support led by Sir Andrew Dilnot. The Act would provide protection from catastrophic care costs (as it limits the amount any person could spend on their own care to £72,000), and improve access for those with more modest means.
- The promise of a green paper on a longer term solution for funding the Care Act and beyond must not be lost. Any longer term funding solution is likely to be complex and needs to involve an open debate with the public about how high quality services can be provided as equitably as possible to all those who need them.
Funding and the NHS: two years of famine ahead?
The next two years – 2018/19 and 2019/20 – will be the toughest years of funding for the NHS over this spending review period. To protect access to care and the quality of care for patients, the NHS will need additional funding in these years.
What’s the evidence?
Government spending on the NHS will be £123.7bn in England in 2017/18. This represents 15% of all public spending.
Spending on health care per person in England is planned to fall in real terms (taking account of inflation) by 0.2% in 2018/19 and by a further 0.2% in 2019/20 (see Figure 4). This is because the NHS is facing historically low funding increases as a result of the government’s efforts to balance the books following the big increase in government borrowing after the 2008 recession.
Figure 4: Changes in total NHS spend per head – annual change and actual spend per head for 2017/18 to 2020/21 (2017/18 prices)
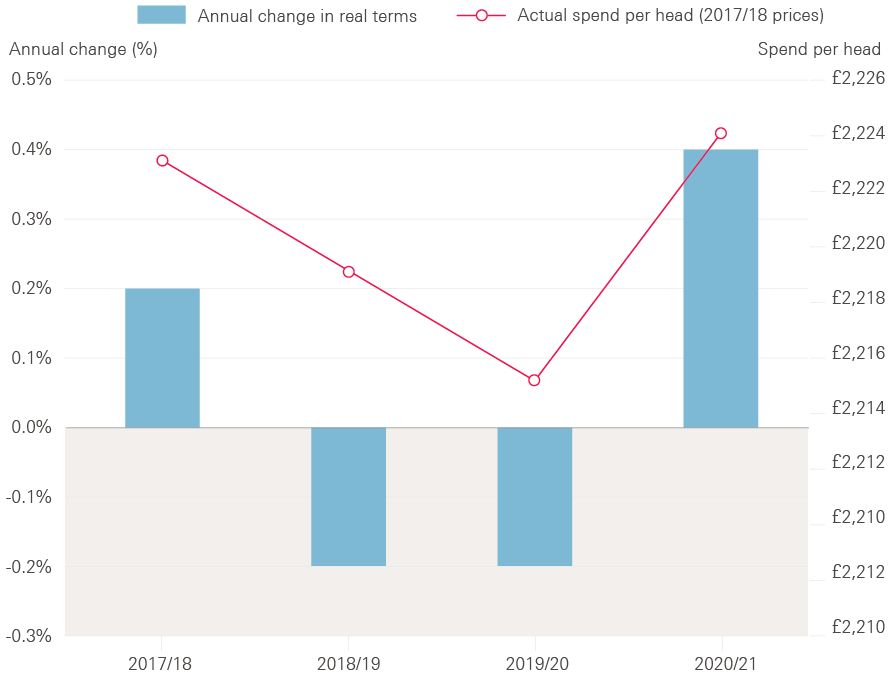
Source: Department of Health Annual Accounts 2015/16
Public spending as a share of GDP will reduce from a high of 45% of GDP in 2009/10 to 38% in 2020/21, but the NHS budget has been protected relative to other public services. Under current spending plans, NHS funding in England will rise by an average of 0.7% a year between 2015/16 and 2020/21 in real terms. But this funding growth is significantly lower than the pressures on the system, which are estimated to increase by around 4% a year above inflation. These pressures arise from the growing and ageing population, increasing numbers of people with complex chronic health problems such as diabetes, and additional cost pressures from new medicines and wages.
The government gave additional funding for the NHS in the 2015 spending review (covering 2015/16 to 2020/21), but it was front-loaded, meaning a greater proportion of the additional funding was allocated to the first two years of the review. This has led to two years of increases in spending per person, followed by two years of falling spending per person. The next two years (2018/19 and 2019/20) will be the toughest years of funding for the NHS in this spending review period.
This squeeze on NHS funding comes on top of five years of slow funding growth between 2010 and 2015. As a result, spending on the NHS in this decade will have grown by less than in any other 10-year period since the founding of the NHS. Based on current spending plans, 2010 to 2020 will be the most austere decade in the history of the NHS.
Table 1: Health care spending in England, 2014/15 to 2020/21
|
2014/15 Outturn |
2015/16 Outturn |
2016/17 Plan |
2017/18 Plan |
2018/19 Plan |
2019/20 Plan |
2020/21 Plan |
Change (£m / %), 2014/15 – 2020/21 |
Change (£m / %), 2015/16 – 2020/21 |
|
|
Total Department of Health expenditure limit, cash terms (£m) |
£113,345 |
£117,594 |
£120,611 |
£123,688 |
£126,343 |
£129,143 |
£133,051 |
£19,706 |
£15,457 |
|
Total Department of Health expenditure limit, 2017/18 prices (£m) |
£118,275 |
£121,874 |
£122,576 |
£123,688 |
£124,398 |
£125,078 |
£126,482 |
£8,207 |
£4,608 |
|
Change in real terms |
– |
3.0% |
0.6% |
0.9% |
0.6% |
0.5% |
1.1% |
1.1% |
0.7% |
|
NHS England, cash terms (£m) |
£97,994 |
£100,685 |
£106,800 |
£110,200 |
£112,700 |
£115,800 |
£119,900 |
£21,906 |
£19,215 |
|
NHS England, 2017/18 prices (£m) |
£102,257 |
£104,350 |
£108,540 |
£110,200 |
£110,965 |
£112,156 |
£113,980 |
£11,723 |
£9,630 |
|
Change in real terms |
– |
2.0% |
4.0% |
1.5% |
0.7% |
1.1% |
1.6% |
1.8% |
1.8% |
Source: Department of Health Annual report and accounts 2015/16, NHS England Annual accounts 2015/16, NHS England Board PAPER PB. 17.12.15/04
How has the NHS responded?
The NHS has responded to its financial situation by aiming to make £22bn of efficiency savings by 2020 (equivalent to 2–3% a year of efficiency improvements) to bridge the gap between growing pressures and available funding. These include improvements in efficiency and limiting pay rises for those working in the NHS to keep costs down. NHS pay rises will have been capped to a maximum of 1% in cash terms for nine consecutive years by 2019 under current policy.
It has become clear that NHS trusts are struggling to manage cost pressures within their budgets. In 2015/16 NHS trusts posted a combined deficit of £2.5bn, with two-thirds of them in the red, as shown in Figure 5. This continued a trend of rising deficits that began in 2013/14. While the NHS was able to make savings elsewhere, the NHS trust deficit was large enough that the Department of Health exceeded its total budget by £149m in 2015/16. The NHS’s end-of-year position for 2016/17 will not be published until July 2017, but by the end of December 2016, 57% of trusts were in deficit, with a projected end-of-year deficit of £873m.
Figure 5: NHS providers reporting a surplus/deficit, 2013/14–Q3 2016/17 (%)
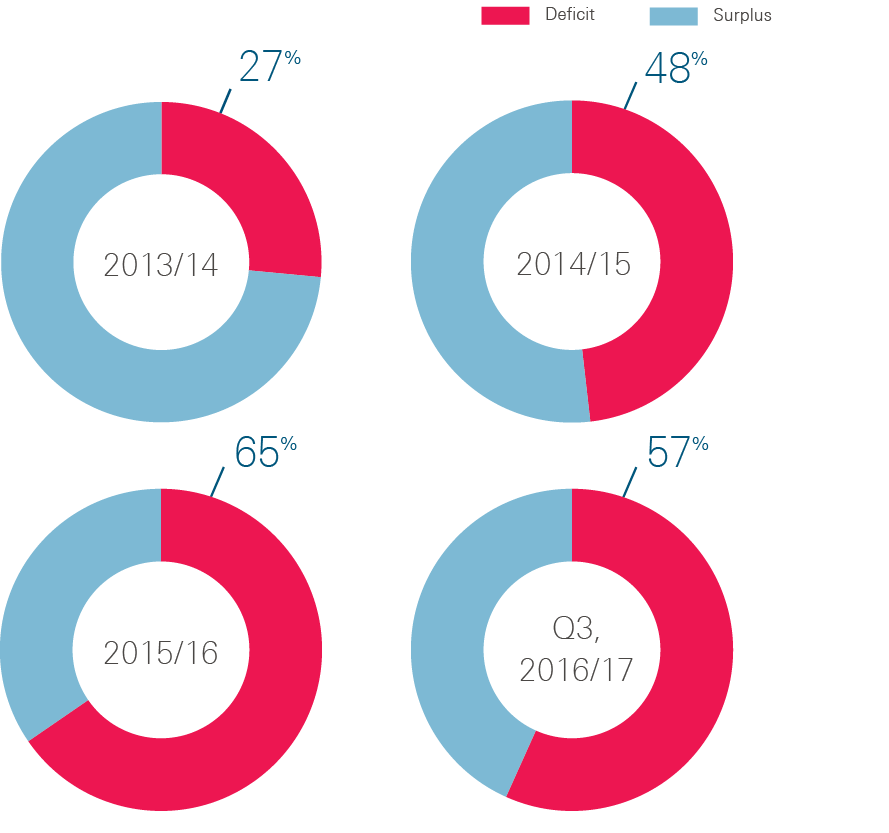
Source: Health Foundation analysis of NHS Improvement data
Efficiency and productivity
The NHS is committed to improving its efficiency and productivity. Productivity compares how the quantity and quality of care provided by the NHS has changed compared with the inputs (eg staff, medicines, equipment) used to deliver the care. Efficiency takes account of the cost as well as the volume of inputs used to deliver care.
In February 2016, Lord Carter of Coles’ review of acute hospital productivity found large, unwarranted variations across the NHS. These variations cover staff sickness rates (2.7% at the best to 5.8% at the worst), deep wound infection rates for hip and knee replacements (0.5% at the best to 4% at the worst), and big differences in the prices paid for equipment so that the cost of a hip prosthesis varies from £788 to £1,590. Taken together the Carter review found a 20% variation between the most expensive and cheapest hospital for in-patient care. From this, £5bn of potential efficiency savings were identified across a range of areas, from better use of digital technology, to reducing staff absence rates, to implementing best practice in clinical care.
While Lord Carter’s review showed there is still room for improvement, in recent years the NHS has become more productive. The University of York calculated that productivity increased across the NHS by an average of 1.75% a year between 2009/10 and 2014/15. Although this is below the target the NHS has set for itself (2–3% a year), it is above the long-run average for the NHS of 0.9% since 1995. It is also higher than the growth in productivity for the whole economy since 2009, which has averaged 0.4% a year (Figure 6).
Figure 6: Average annual increase in productivity for NHS, social care and whole economy
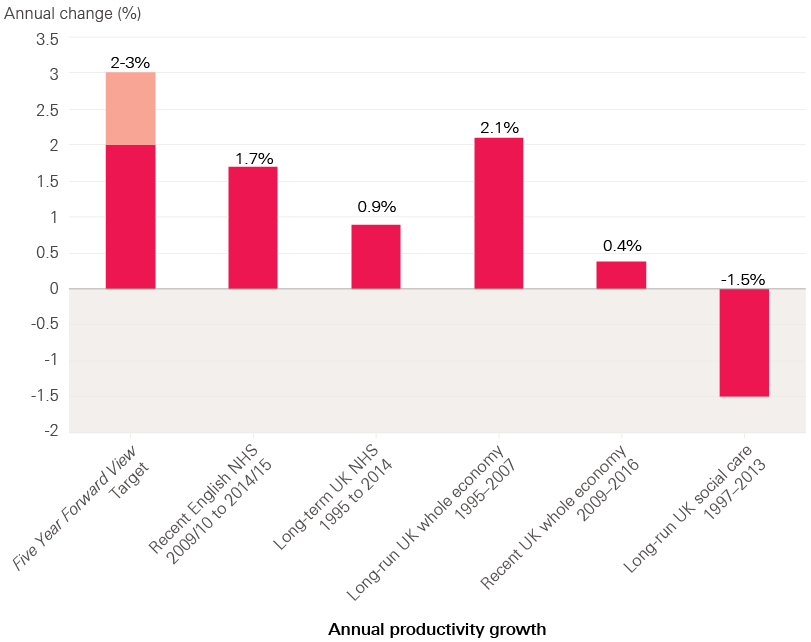
Source: Health Foundation analysis based on multiple sources
Capital investment
The NHS has had a ring-fenced budget for capital investment (for the acquisition or maintenance of assets such as land, buildings and equipment) of around £4bn a year since 2010. This is higher than the long-term average. However, as Sir Robert Naylor found in his review of NHS property and estates in March 2017, the NHS has a rising backlog of maintenance needs and requires additional capital funding to invest in improving services to meet the changing needs of the population as outlined in NHS England's Five Year Forward View.
The increase in backlog maintenance in recent years has arisen in part as capital budgets have been used to plug trusts’ deficits. In 2016/17, the Department of Health transferred £1.2bn from the capital investment budget to day-to-day running costs, reducing capital funding by a fifth. This followed transfers of £670m in 2014/15 and £980m in 2015/16. This means that for three years in a row, capital funds have been used to pay for the day-to-day running costs of the NHS. As a result, NHS trusts have been less able to invest in modernising equipment and facilities. In the longer term it is a false economy, as facilities that are old and in poor repair cost more to run, for example, through higher energy bills.
The Naylor review calculates that the NHS will need a total of £10bn of additional capital investment to tackle backlog maintenance and modernise the service to deliver the vision of the Five Year Forward View. The review identifies that this investment might unlock savings in hospital day-to-day running costs of £0.5bn to £1bn a year. Some of this capital might be funded by selling buildings and estates that the NHS no longer needs. The Naylor review calculated that a reasonable estimate of potential estate sales is £2.7bn. This means that further injections of public capital would be needed to bridge the gap.
What should the next government do?
- The pressures on the health care system, combined with a struggling social care sector, mean it is difficult to see how the NHS can sustain quality and access to care for patients with the planned decrease in spending per person in real terms over the next two years. The minimum option would to be to maintain the level of NHS spending per person. This would require an extra £230m in 2018/19 and £450m in 2019/20 (2017/18 prices).
- Alternatively, GDP is expected to grow by 1.7% in 2018/19 and 1.8% in 2019/20. So, a more generous option, maintaining the share of GDP, would require an extra £1.4bn in 2018/19 and £2.9bn in 2019/20 for the English NHS (2017/18 prices). This would still require the NHS to pursue challenging levels of efficiency improvement.
- In any event, alongside additional day-to-day funding, the NHS needs to invest to modernise its facilities and equipment. Such investment would support the quality of care provided, short-term efficiency gains, and the need to improve services to reflect changing health care needs as the population ages and more people are living with long-term chronic health problems.
- In March 2017, Sir Robert Naylor’s review for the Department of Health identified a capital commitment of at least an extra £10bn to address the backlog of maintenance requirements and to deliver the vision for a modernised health system set out in NHS England’s Five Year Forward View. While some of this might be funded by estate sales, much of it would need public investment.
Funding for social care and the NHS: how much might be needed beyond 2020?
Social care and health care funding will be a crucial issue for the next decade. Beyond 2020/21 the pace of funding growth for the NHS and social care system will need to accelerate, taking a greater share of GDP, if it is to keep pace with the growing and ageing population, rising chronic disease levels, meet public expectations, and fund new technologies and medical advances.
What’s the evidence?
The independent body the Office for Budget Responsibility (OBR) assesses the long-term financial pressures facing the NHS. The OBR uses an internationally recognised approach for estimating health and care pressures in the long term, which is consistent with our own research. The OBR’s central estimate for health care in the UK shows funding pressures growing by over 4% a year in real terms between 2021/22 and 2026/27. This is higher than their projection for UK economic growth of 2.4% a year.
Current spending commitments run until 2020/21. The next government will need to determine the path of NHS funding beyond this point. In the absence of firm figures the OBR assumes that spending in 2021/22 will be around 6.9% of GDP. We estimate that this is equivalent to a budget for the NHS in England of approximately £127bn. The OBR estimates that UK NHS spending will need to rise from 6.9% of GDP in 2021/22 to at least 7.6% by 2026/27. We estimate that this would mean an extra £31bn for the NHS in England, with a budget of £158bn by 2026/27.
The OBR also estimates that by 2021/22 UK public spending on long-term care will be worth around 1.1% of GDP. We estimate that this is worth £21bn for publicly funded adult social care in England. It then expects cost pressure to grow by an average of around 5% a year, which would see spending rise to 1.3% of GDP by 2026/27, worth an additional £6bn.
Table 2: UK projections of health care and social care spending as a share of GDP
|
2016/17 |
2021/22 |
2026/27 |
2031/32 |
|
|
Health |
7.3% |
6.9% |
7.6% |
8.4% |
|
Long-term care |
1.0% |
1.1% |
1.3% |
1.4% |
|
Combined |
8.3% |
8.0% |
8.9% |
9.8% |
|
Additional share of GDP for health and care combined for each five-year block |
-0.3 percentage points |
0.9 percentage points |
0.9 percentage points |
Source: Office for Budget Responsibility Fiscal Sustainability Report January 2017. (Note: the long-term care projections do not include the announcements of additional funding in the spring budget 2017.)
Growth of this order in health care spending would not mark the UK as a significant outlier for health care spending across Europe. Health care spending rising as a share of GDP is very common for countries with a growing economy. NHS spending has grown from around 2.8% of GDP in 1955/56 to 7.3% of GDP in 2017/18.
Combining all health care spending (including privately funded care), and using an internationally consistent measure of health care funding, which includes much of what is classified to social care, the UK spent 9.9% of GDP on health care in 2015. This broadly matches the average across the 14 other original members of the EU (9.8%), which act as the UK’s best international comparators. The UK’s spend is below Sweden, France, Germany and the Netherlands, which spend around 11% of their GDP on health care, as shown in Figure 8. The UK ranks sixth out of the G7 countries for the proportion of national income devoted to health care – only Italy spends a lower share.
Figure 8: Health care spending as percentage of GDP – How the United Kingdom compared to other G7 countries in 2015
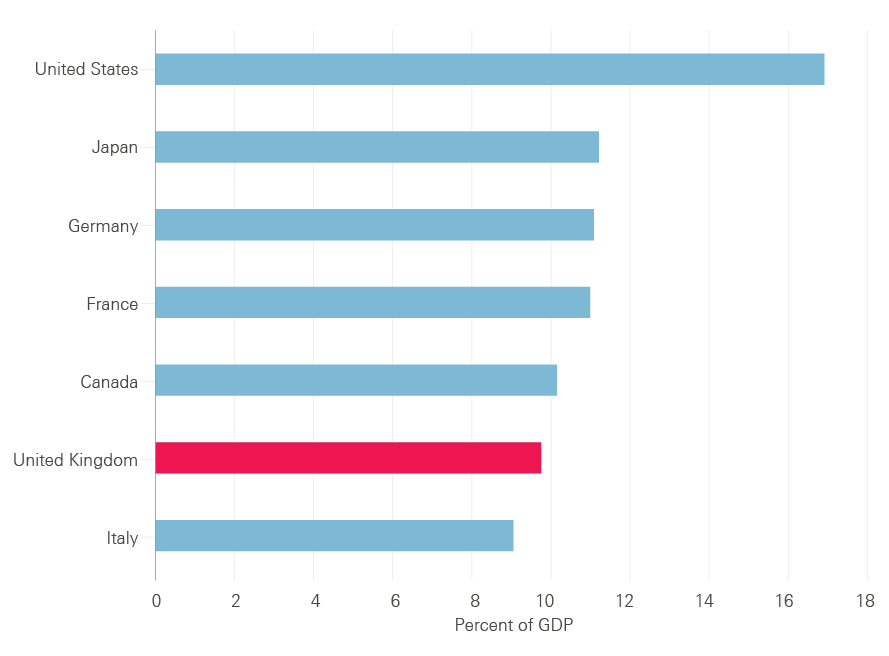
Source: OECD Health Statistics 2016, Frequently Requested Data
What should future governments do?
- The recent review by the House of Lords' Long-Term Sustainability of the NHS Committee recommended that health care funding beyond 2020 should increase at least in line with the growth of GDP and do so in a predictable way. We would agree. This would mean that with the UK economy expected to grow at an average rate of 2.4% a year in real terms, the budget for the NHS in England would need to increase by at least £16bn to £143bn in 2026/27 and by £33bn to around £160bn in 2031/32 in today’s prices (from an estimated £127bn in 2021/22) – see Figure 9.
- While this would be a higher growth rate than observed in this century, it would be below the estimate for need from the OBR. If the NHS is to be well equipped to meet the changing demands and expectations that will be placed on it in future, funding would need to increase at least in line with the OBR’s central projections for NHS spending, requiring an extra £31bn in 2026/27 and £68bn in 2031/32, as indicated in Figure 9.
- As shown in Figure 10, for adult social care to maintain the expected share of GDP from 2021/22, an extra £3bn would be required in 2026/27 and an additional £5bn in 2031/32. Alternatively, rising in line with OBR projected pressures would require an extra £6bn in 2026/27 and an additional £12bn in 2031/32.
Figure 9: Projections of additional funding required for the NHS budget in England (2017/18 prices)
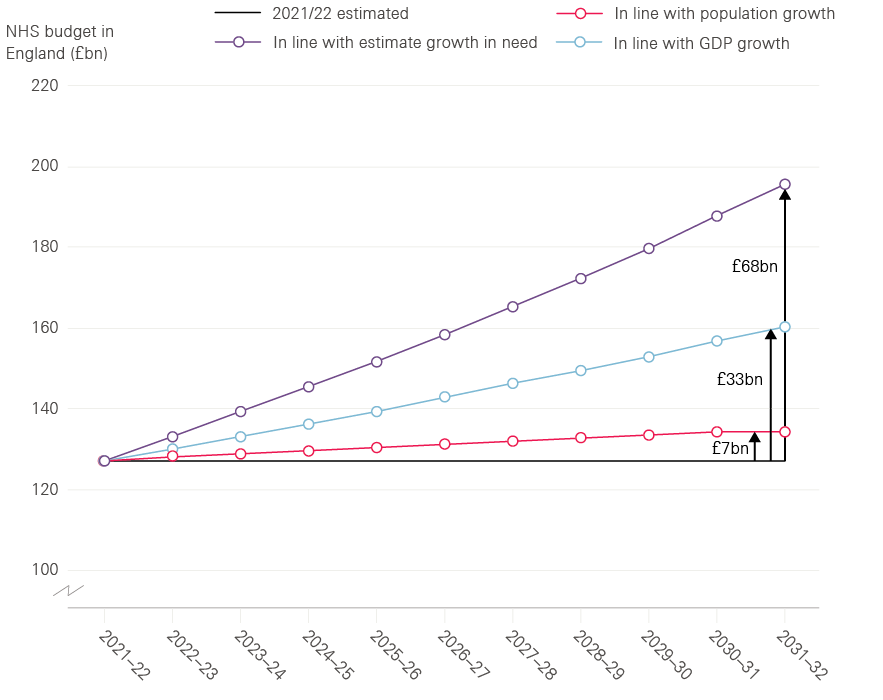
Source: Health Foundation analysis based on Office for Budget Responsibility, fiscal sustainability report 2017
Figure 10: Projections of additional funding required for publicly funded adult social care (2017/18 prices)
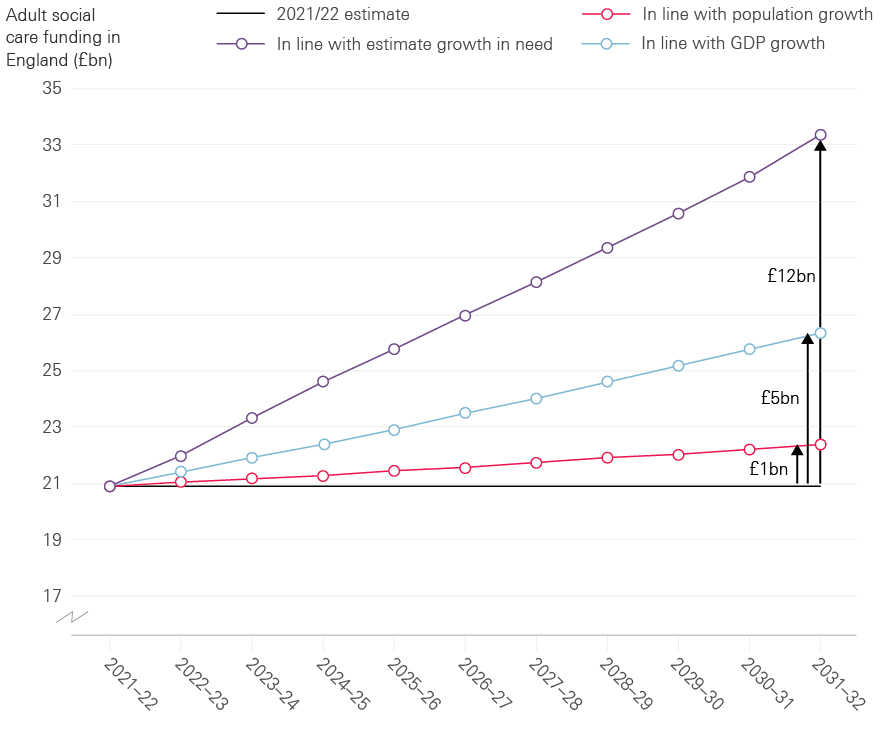
Source: Health Foundation analysis based on Office for Budget Responsibility, fiscal sustainability report 2017
Commentary: what’s the best route to a long-term, sustainable future for the NHS and social care?
Faced with sums of money of this size, many might question the affordability of the NHS and social care in the future. Should the funding models be changed?
There is no evidence that changing the funding model of the NHS will improve its efficiency or quality, or that the public has any appetite to abandon an NHS that is tax-funded and free at the point of use. The recent review by the House of Lords’ Long-Term Sustainability of the NHS Committee, which looked at international models of funding health care, found that the tax-funded model had the most advantages in terms of fairness and efficiency. But it also concluded that in the case of the NHS, the volatility of funding growth over time – going from feast to famine and back again – was damaging for the long-term planning of services. We would agree with this, and its recommendation that some sort of independent body needs to have an overview of the needs of the population, and make recommendations about the resources (and workforce) to meet those needs.
In any event, the NHS in England will have to continually improve its productivity and efficiency, and cannot duck difficult decisions about the right mix of local services. The national and local plans developed by the NHS for the next five years hold out a vision of what has to change in the future to improve care and reduce ill health. Investment will be needed to enable clinicians to work alongside their patients to improve care by making the best use of data as well as the latest technology.
For social care, of course, there is already a mixture of funding sources in England, increasingly drawing on the private resources of individuals and their families in a way that is perceived as both unfair and arbitrary. Any future solution for social care will have to consider how to balance private contributions and public funding.
In the end, it is a matter of public choice about how much money should be raised through taxes and spent on health and care services. Protecting spending on the NHS and social care at the expense of other public services is unsustainable. But in the debate about funding, there needs to be clarity about the underlying trade-off between how much we pay for health and social care, and the level and quality of the care that services are able to provide.
For more information on the data and reports mentioned in this briefing, please see the list of sources at http://www.health.org.uk/election-briefing-nhs-and-social-care-funding.