Key points
- Over the past decade of austerity, the ability of councils to maintain and improve the health of their residents has been jeopardised by substantial cuts to local services and investments, many of which directly affect health. Local authority budgets (excluding social care) fell by 32.6% between 2011/12 and 2016/17.
- The public health grant allows local authorities to provide services that maintain and improve people’s health. 2019 marks the final year of the Five year forward view for the NHS in England, which called for a ‘radical upgrade in prevention’.
- However, a reduction of almost a quarter in spending per person is expected between 2014/15 and 2019/20. Based on current spending plans, there will be a £0.7bn real-terms reduction in the public health grant in that period.
- These funding cuts come at a time when key indicators of health are causing concern. Mortality improvements have slowed and there are large inequalities in health outcomes between local areas. For example, there is a 19-year gap in healthy life expectancy for women in England’s 10% most- and least-deprived areas. Despite this, the areas of greatest need have not been protected from funding cuts. The lack of strategic approach, coupled with real-terms cuts, risks widening health inequalities at a time when the government has pledged to tackle such injustices.
- Current allocations to local authorities are largely based on historical spending patterns. The Advisory Committee on Resource Allocation (ACRA) recommends how various forms of health funding should be distributed.
- Re-allocating the public health grant according to its recommendation, while restoring real-terms losses and preventing any local area experiencing a reduction, would ultimately require an extra £3.2bn of funding per year.
- Our recommendation is that, at a minimum, the government should reverse real-terms cuts and allow additional investment in the most-deprived areas by providing an additional £1.3bn in 2019/20. The remaining £1.9bn should then be allocated in phased budget increases by 2023/24, with further adjustments for inflation.
- This increase will bring a more equitable distribution of funding for public health but is still far short of the upgrade called for in the Five year forward view.
Introduction
The focus of this briefing paper is the public health grant, the core services it is intended to deliver and the extent to which the grant has kept pace with changes in need. This should be viewed in the context of the government’s June 2018 pledge to increase NHS spend and the upcoming Budget and Spending Review process, which will set the parameters for wider health spending over the course of this parliament.
Maintaining and improving health
Public debate about health tends to focus on the NHS. The government's pledge to boost NHS funding by around £20bn a year by 2022/23 will be important to help maintain current service provision. However, with the ageing of the UK population, rises in the number of people living with multiple conditions, and healthy life expectancy failing to keep pace with overall rises in life expectancy (particularly for the poorest), demand for NHS services is only expected to rise.
Although the funding gap for predicted NHS demand may have been plugged for now, the government has been silent on two important areas of health-related spending. First, as Health Foundation research has highlighted, social care services have seen significant funding reductions in recent years and there is no credible plan for much-needed reform. Second, and the focus of this report, is the need for greater investment in 'upstream', preventive measures that improve the overall health of the population. Although prevention is a stated priority for the Secretary of State for Health, in June 2018 the Prime Minister said only that it would continue to be supported, and spending plans would be set out as part of the 2019 Spending Review. Policy plans have yet to be published and the forms of support the government provides to maintain people’s health continue to be reduced.
People’s health is dependent on more than just the health care system. Health is largely a product of the environment in which people live, their jobs, the education they receive and the places in which children are raised. In other words, the social determinants of health. Ensuring public health requires investment in the things that make us healthy, not just in the services that treat people when they become unwell.
Provision to support good health
The Department of Health and Social Care provides funding for activities that prevent ill health.
- £1.2bn a year from within the NHS core budget for preventive services such as immunisation and cancer-screening programmes.
- £0.3bn for Public Health England (in 2017/18), a non-departmental public body of the Department of Health and Social Care. It provides a range of services, from monitoring and controlling infectious diseases to providing support to local authorities and the NHS.
- £3.3bn for the public health grant (in 2018/19), predominantly spent on preventive and treatment services, such as sexual health clinics, help to stop smoking and children’s health services. Public health teams work for local authorities and also help steer the development of wider local policies and services, such as housing, planning and children’s services, to support improvements in health.
The public health grant supports primary prevention services and also intervenes more widely, helping influence the social determinants of health at a local level. It is specifically dedicated to improving health and is relatively straightforward to quantify, but it should not be considered in isolation. Other services provided by councils also have a key role in supporting the population’s health.
Local authority budgets have been significantly reduced in recent years. The National Audit Office reported a 32.6% fall in spending between 2010/11 and 2016/17 on non-social-care services such as libraries, public transport, children’s services and leisure facilities, which can negatively affect people’s health in the long term. Other forms of support, such as affordable housing, early-years education and the benefits system, also help maintain and improve people’s health. (The extent to which different types of provision affect health is difficult to specify and will be the subject of future research by the Health Foundation.)
The Public Health Grant is provided in England, the other nations of the UK have their own provision models which tend to be a mix of NHS, local public health board and local authority provision. In all three nations, funding has either remained stable and in some elements increased in recent years.
* Throughout this report, unless otherwise stated, spend figures are presented in 2018/19 price terms using a gross domestic product (GDP) deflator.
A short history of the public health grant
The public health grant was introduced in 2013/14 when, under the 2012 Health and Social Care Act, public health functions previously the responsibility of the NHS were transferred to local government. Many of the most important levers to improve health sit outside the NHS and require broader interventions designed to meet the needs of local populations. Directors of public health and their teams became employed by local authorities with a ring-fenced public health grant.
In 2014/15 the government set out the Five year forward view for the NHS in England, which called for a ‘radical upgrade in prevention’. However, in every subsequent year the public health grant has fallen in real terms (and even in cash terms between 2015/16 and 2019/20). The total fall in spend per person between 2014/15 and 2019/20 is expected to reach 23.5% .
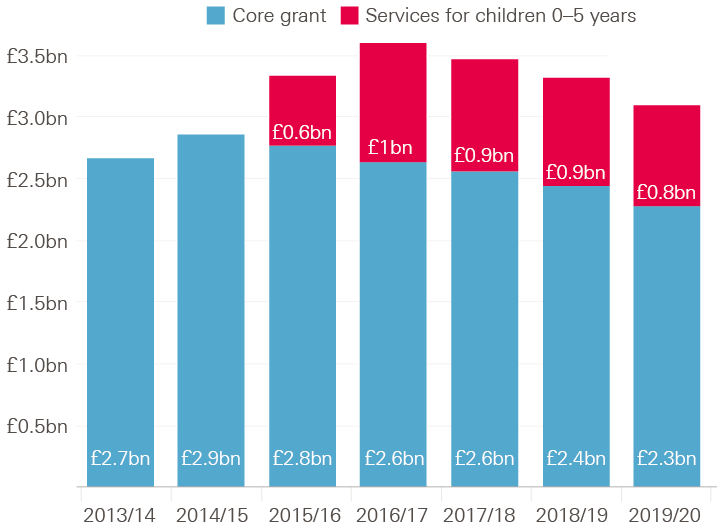
Figure 1 shows that the core public health grant reached £2.9bn in 2014/15 (in 2018/19 real terms), before starting to fall in successive years. We have used spend reported by councils (out-turn spend) where available and spending allocations for future years (from 2018/19). Allocated spending to these core functions is now set to reach £2.3bn by 2019/20 – a fall of £0.6bn. It is possible that allocations will be topped up via wider local authority resources.
Figure 1: Annual public health grant net expenditure between 2013/14 and 2019/20 in real terms (2018/19 prices)
Note: Data for 2013/14 to 2016/17 is out-turn spend. Estimates for 2017/18 and 2018/19 are published allocations. Estimate for 2019/20 is based on provisional allocation; it is assumed the share of the overall grant allocated to children’s services is in line with the previous year. Real terms refers to 2018/19 prices, using the Gross Domestic Product deflator from the Office for Budget Responsibility.
The picture is complicated by the additional transfer of services for children 0–5 years of age (largely health visitors for infants and mothers) from the NHS partway through the 2015/16 financial year. This portion of the grant increases from £0.6bn in the year of transition to £1.0bn in the first full year of allocation (2016/17). By 2019/20, this spend is set to fall to £0.8bn. How fast spending has fallen at the local level in the grant will depend on how the relevant services are prioritised. It is assumed in this briefing that future allocations will follow the pattern of historic spending.
How the public health grant is spent
The public health grant is used to provide a range of services, some of which are mandatory functions, whereas others, reflecting variation in local need, are discretionary so long as they are intended to improve the health of the population. Local authority returns capture the areas in which the grant is being spent but, because of this local flexibility, the range of activities carried out within these categories can vary significantly between local areas.
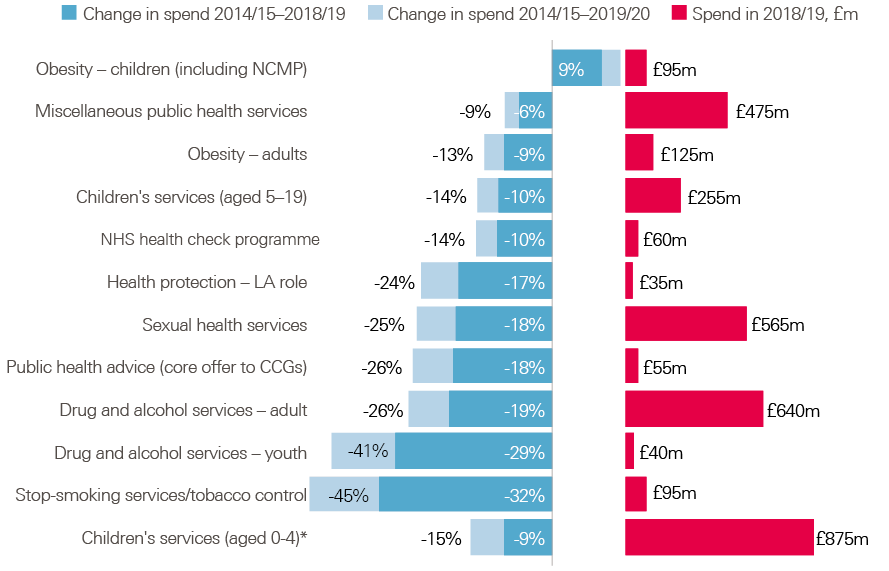
Figure 2 shows the greatest areas of public health grant spend in 2018/19:
- services for children aged 0–5 years (£875m)
- adult drug and alcohol services (£640m)
- sexual health services (£565m).
Figure 2: Public health grant net expenditure and percentage change in spend since 2014/15 by element of provision (England only; 2018/19 real terms)
Note: Data for 2013/14 to 2016/17 is out-turn spend. Estimates for 2017/18 and 2018/19 are published allocations. Estimate for 2019/20 is based on provisional allocation; it is assumed the share of the overall grant allocated to children’s services will be in line with the previous year and future cuts will fall in line with historic trends. Real terms refers to 2018/19 prices, using the Gross Domestic Product deflator from the Office for Budget Responsibility. NCMP, National Child Measurement Programme; LA, local authority; CCG, Clinical Commissioning Group.
Although most of the grant is spent on the mandatory services mentioned above, a significant portion (£475m) is also spent on ‘miscellaneous services’. This usually includes staff, which partly represents the time and resources public health teams can allocate to influencing other areas of local authority policy. Improvements in long-term health outcomes can come from this – for example, ensuring that other local authority action with the potential to improve health is effectively designed and delivered.
The areas of highest spend may not necessarily be those that have the most impact on population health. Drug and alcohol services are an area of high spend for a relatively small number of people, because support is so resource intensive.
Figure 2 also shows how spending on each of those areas has changed: both the real-terms fall in spending on each component between 2014/15 and 2018/19 and how those cuts will look if the pattern continues into 2019/20, when a further reduction in overall spend is expected. Spending has fallen across all functions other than child obesity. The largest proportional reductions to date have been in stop-smoking services (–32%) and drug and alcohol services for young people (–29%). If this pattern continues, by 2019/20 we can anticipate allocations to these categories to have fallen by 45% and 41%, respectively.
Distributing the public health grant
How does distribution of the public health grant relate to measures of deprivation?
The Index of Multiple Deprivation measures relative deprivation of small local areas in England (almost 33,000 areas, each with an average population of 1,500 people) by weighting a range of indicators. It considers income, employment, education and skills, crime, health and disability, barriers to accessing housing and services, and the environment.
There is a close correlation between the extent of deprivation in small local areas and how long people in those areas can be expected to live in good health. This association reflects the social determinants of health: health is predominantly determined by the circumstances in which people live, the work they do, the food they eat, and the quality of their housing and transport links. Therefore, it might be expected that local authorities with the greatest concentrations of the most-deprived areas would receive more funding.
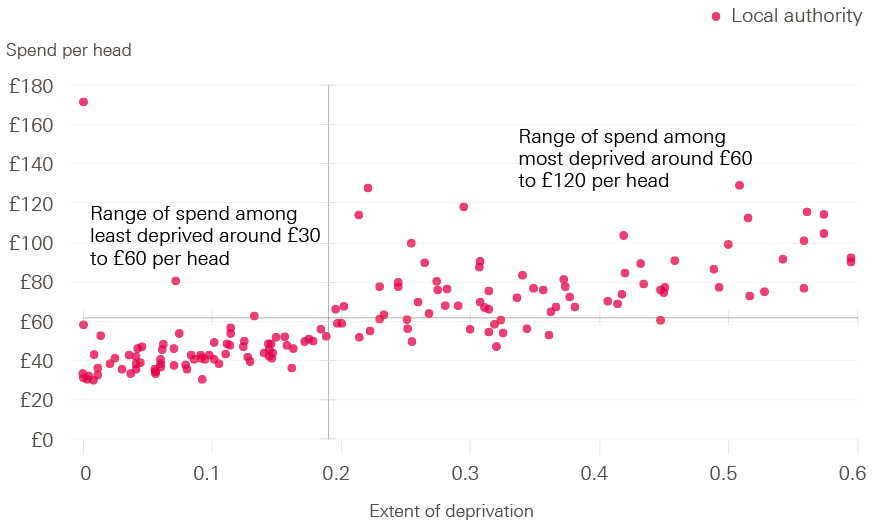
A broad relationship does exist between the level of funding in a local area and the extent of deprivation within that area (Figure 3). Local authorities with higher levels of deprivation have higher allocations of per-person spend. However, this pattern does not hold true in all circumstances and the variation tends to widen as the extent of deprivation increases. Funding generally remains within a band of £30–60 per person in the least-deprived areas, but the funding range widens to £50–120 per person in more-deprived areas. These differences partly relate to historical levels of spending inherited by local authorities when these services were still managed by the NHS.
Figure 3: Public health grant allocations compared with extent of deprivation by local authority (spend per person)
Note: Axes cross at average values. Extent of deprivation is a weighted measure of the population in a larger area from the 30% most-deprived areas in England.
The Advisory Committee on Resource Allocation (ACRA) formula
Public health provision is not only related to an area’s level of deprivation. A large share of provision relates to children’s services, so the composition of the population is important, as is the extent to which an area is rural or urban, given the implications for service delivery.
ACRA provides advice to the government on how health spending should be distributed to support ‘equal opportunity of access for equal need’ and reduce avoidable health inequalities. ACRA has been developing a formula to distribute the public health grant that seeks to take into account local need for services as well as the level of deprivation. The ACRA formula takes into account variation in mortality rates between local areas and also estimates demand for services covering children 0–5 years of age, sexual health and substance misuse.
Initially, ACRA recommended that distribution should gradually move to meet the formula-based allocation, with faster growth in spend for areas where current allocations were furthest behind, of up to 10%, but minimum growth of 2.8% in any area. That was possible between 2013/14 and 2014/15 because the grant increased in real terms. However, the core grant has been diminishing in cash terms since 2014/15, meaning that any change in distribution would lead to some areas receiving a greater cut to funding than others. Progress in meeting ACRA's recommended distribution has stalled. The final allocations for 2018/19 and 2019/20 proposed by the Department of Health simply followed the pattern of 2017/18.
Concerns regarding such a redistribution tend not to lie with how the formula is calculated but with how it will be applied, particularly given the large real-terms cuts to the grant. The reduced spending has left room to re-allocate funds without making some areas bear a far greater share of the overall burden of the cuts.
How does distribution of the public health grant relate to the ACRA formula?
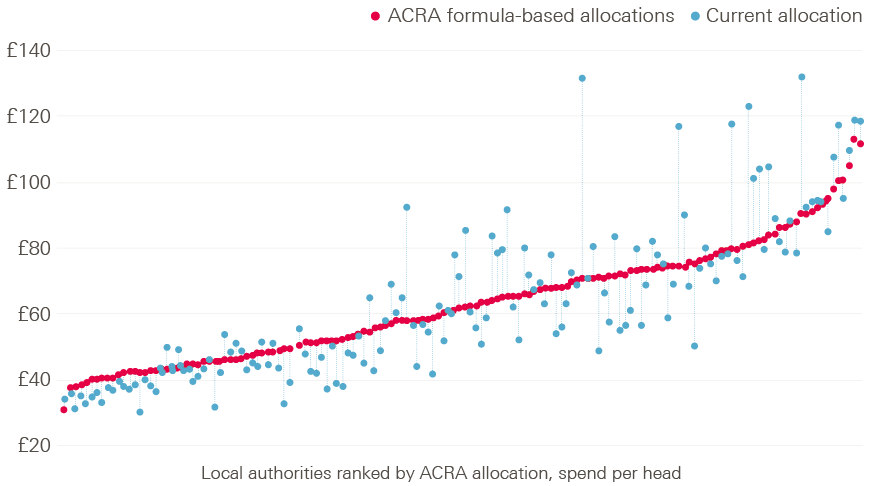
Figure 4 shows the current distribution of the public health grant against that calculated using the ACRA formula, given the 2018/19 grant of £3.3bn. Local areas are ranked by their level of per-person funding according to the ACRA formula (red dots) and contrasted with (dotted lines) the current per-person funding for the same year (blue dots). (This figure is not intended to indicate that any under- or over-funding is allocated to specific areas.)
Figure 4: Current public health grant distribution compared with ACRA-formulated distribution by local authority (spend per person, 2018/19)
Note: Advisory Committee on the Resource Allocation (ACRA)-recommended allocation applies the relative allocation based on the latest provisonal formula applied to pubished total allocations of spend in 2018/19.
The extent to which the ACRA-formulated funding distribution would differ from the current distribution is mixed. Broadly, the areas with least need would receive slightly less funding than at present, and some areas with the most need would also receive less than they do at present. There are some outliers with signficantly higher levels of current spend than other areas with a similar level of need (notably, Kensington and Chelsea, Knowsley and Blackpool). These differences relate to historical spending patterns.
How have changes in the public health grant reflected the ACRA formula?
Figure 5 compares the real-terms percentage change in the core public health grant since 2014/15 for each local area with the gap between the current and ACRA-formulated distributions.
Figure 5: Real-terms reduction in core public health grant spend compared with the gap between the current and ACRA-formulated distributions (per-person spend, 2014/15 to 2019/20)
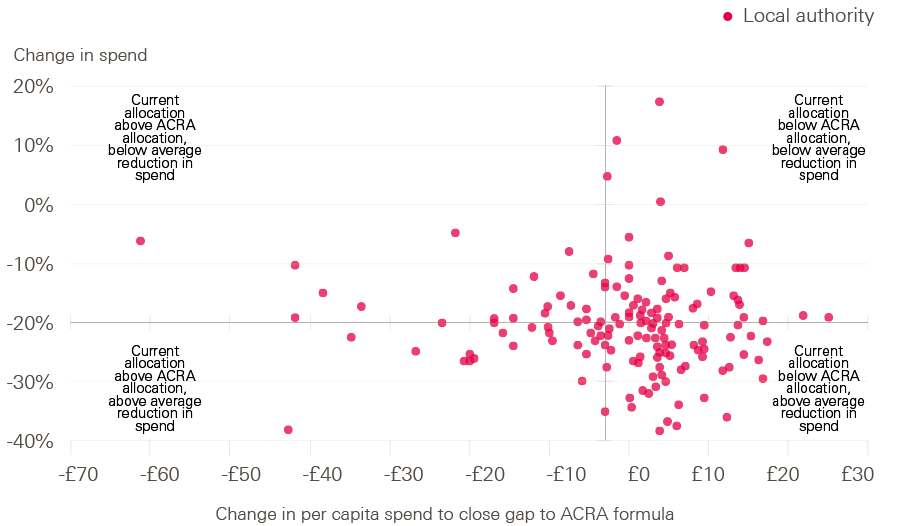
Note: Advisory Committee on the Resource Allocation (ACRA)-recommended allocation applies the relative allocation based on the latest provisional formula applied to published total allocations of spend in 2018/19.
If the changes to grant funding had reflected ACRA's recommended distribution of funds, we would expect the largest falls in spend to be shown towards the bottom left-hand corner of Figure 5, and the smallest reductions (or any increases) in funding in the top right-hand corner. If anything, the opposite seems to be true: the largest reductions in spend are among areas that have lower spend than if the grant were allocated in line with the ACRA formula. However, it must be remembered that some areas indicated as most deprived by the ACRA formula might see funding fall, as their current allocations are above the recommendations derived from the ACRA formula.
How have reductions in the public health grant affected different areas of spending?
The extent of grant reductions vary at the local level, as does the relative prioritisation of different services within the grant. Figure 6 ranks local authorities according to the size of the reductions in their core grant since 2014/15. Each dot reflects the change made to three key parts of public health spending.
Overall, children’s services and sexual health services are prioritised above drug and alcohol services, although the precise pattern varies. The number of children in England is expected to grow by 7% between 2014 and 2019, so we can expect the demand for children’s services to increase. It is more difficult to interpret changes in demand for sexual health or drug and alcohol services. Service usage is the most readily available indicator, but this is tied to the extent of provision and funding. In the case of sexual health services, diagnosis rates have been broadly flat over the last decade, while drug-related deaths have risen by two-fifths.,
It may be that public health directors are prioritising services they consider to be either most needed or most cost-effective. It may also be that some services are easier to restrict than others – for example, by tightening eligibility criteria or reducing staffing costs. Alternatively, prioritisation might relate to local political concerns.
Figure 6: Percentage change in local authority spending by service type since 2014/15
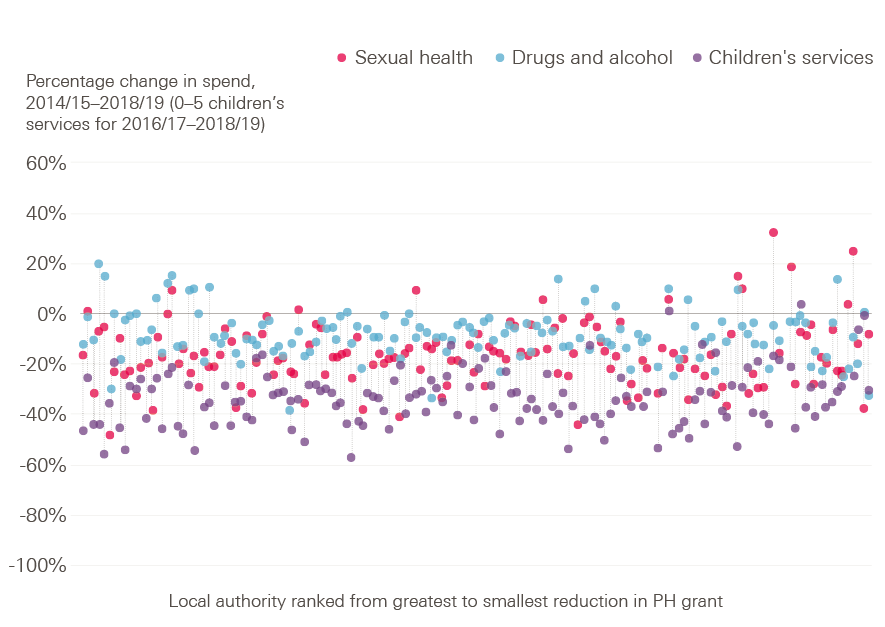
Note: Change in funding for services in between 2014/15 and 2018/19 apart from 0-5 years children's services, which is shown for 2016/17 to 2018/19.
† As estimates rely on how councils complete their financial returns, some caution should be used in interpreting them. They show spend on provision at a relatively detailed level and accounting practices may vary slightly between councils.
Key health indicators show there is no room for complacency
These reductions in spending come at a time when many indicators of population health are worsening. Even where there has been significant improvement, such as in the case of smoking prevalence, it can vary between local areas and those who still smoke can be the most difficult cases to tackle.
A major issue is the slowing of improvement in life expectancy. The population mortality rate (on which life-expectancy projections are based) was improving relatively rapidly. However, this improvement began to slow around 2010. Figure 7 shows the percentage change in mortality rates (taken as a rolling four-quarter average) since Q1 2001, plotting the historical trend alongside it. There is a clear break in the trend for improvement for men and women from the early 2010s.
Figure 7: Index of change in age-standardised, all-cause mortality rates in England for all ages by gender, 2000–2017
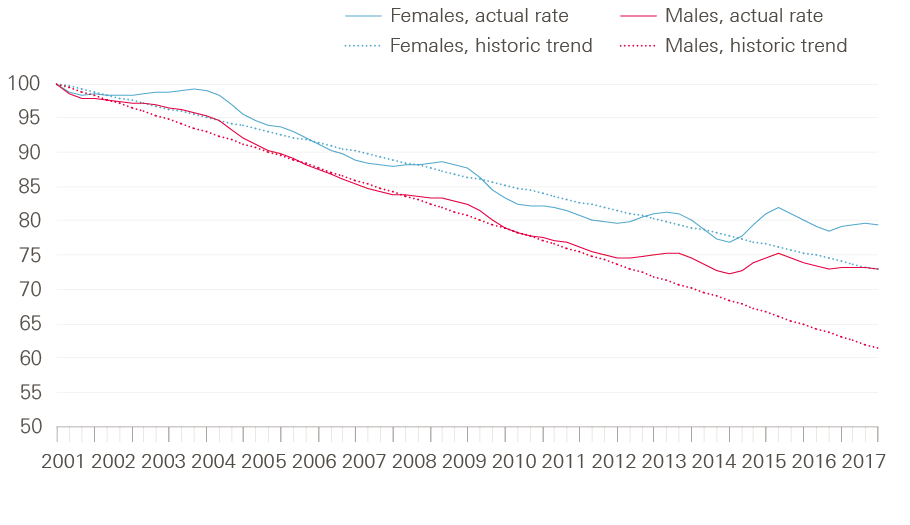
Note: Index is based on a rolling four-quarter average of a rolling, annual, age-standardised mortality rate for all ages and trend from period before break in trend due to slowdown in mortality rate improvement using quarters, Q3 2000 to Q4 2017.
The reasons behind this slowdown are not known. Some have suggested it relates to a more severe than usual strain of flu increasing deaths among older people. Others relate the change to the effect of austerity measures. Analysis suggests that there have been a greater number of flu-related deaths in recent years, and that the greatest increase in the number of deaths has been among older women. However, there have also been increasing mortality rates among younger age groups, with no single cause accounting for the change., The slowdown has also been observed across other developed countries, although when the effect occurred differs by country. Disentangling the drivers of this slowdown is the focus of ongoing Health Foundation-funded research.
Regardless of the overall rate of improvement in how long we live, the wide variation across local areas in both total expected years of life, and how many of those years are spent in good health, are cause for concern. Women living in the most-deprived 10% of areas of England are expected to live for 9 fewer years than those from the least-deprived 10% and spend 19 fewer years in good health (Figure 8). Between 2009 and 2016 (the period over which comparisons can be made), there has been little to no improvement in these outcomes. The difference in women’s life expectancy between the most- and least-deprived areas has increased.
Figure 8: Women’s life expectancy and healthy life expectancy in England by decile of index of multiple deprivation (2014–2016)
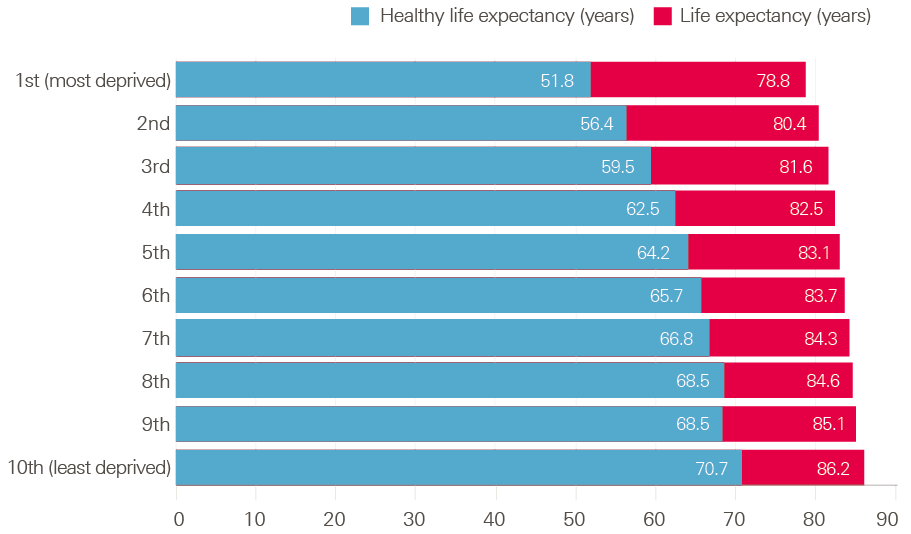
Note: Estimates shown are life expectancy at birth calculated on a period basis.
Addressing inequalities in health is a huge challenge and questions remain about the pace of future improvements in life expectancy. Although discussing specific approaches to closing those gaps is not the aim of this paper, it seems clear that reducing investment in public health grant activity to improve health is unlikely to help.
Making good the shortfall
The analysis above focused on the changes to the public health grant and how this has affected provision. Simply reversing funding cuts will not be sufficient. Demand for children’s services can be expected to increase, with projected increases in the child population and the level of child poverty. To gauge the potential shortfall in the public health grant, this section considers the funding gap through a number of different lenses:
- investment relative to the NHS
- re-profiling spend as if the latest ACRA formula were applied
- changes in demand since the grant’s introduction.
How the public health grant compares with overall health care spending
In 2013/14, the public heath grant was 2.8% of the NHS spend (that is, NHS England RDEL‡). It has since reduced in real terms. NHS spend has been relatively protected compared with the public health grant and wider government spending, so it is no surprise that the original core grant is expected to equate to 2.1% of the NHS spend in 2018/19 (Figure 9). Taking into account the pledged funding boost to the NHS, and making the optimistic assumption that public health grant funding will increase in line with real-terms growth from 2019/20, the grant could equate to only 1.7% of NHS spend by 2022/23.
Figure 9: Public health grant funding as a share of health spend under different scenarios (2013/14 to 2022/23)
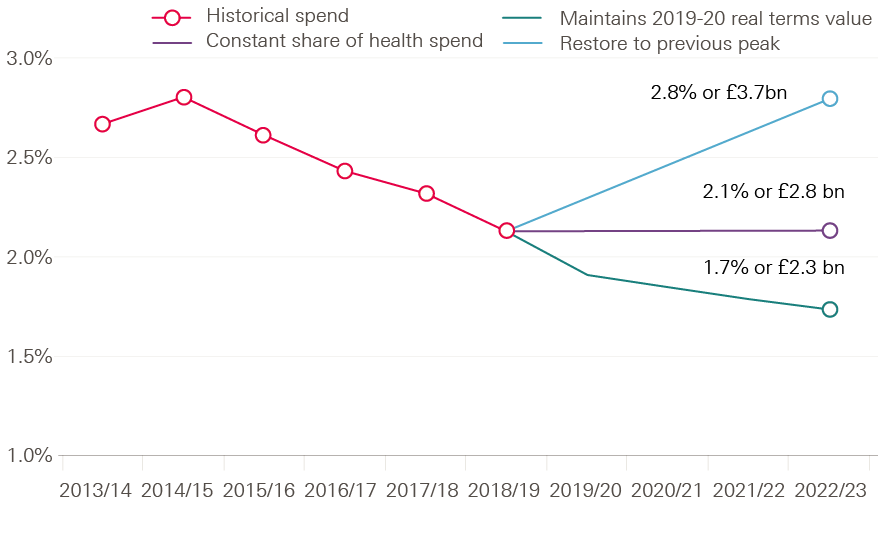
Maintaining the core public health grant as a 2.1% share of total health spend would require an additional investment of £0.5bn a year by 2022/23. Restoring the public health grant to its historic share of 2.8% of the NHS spend would require extra spend of £1.4bn a year by 2022/23. This exercise highlights the relative magnitude and prioritisation of spend between health care and health. It does not seek to estimate the level of spend that would be sufficient to maximise health outcomes.
Keeping pace with cost and demographic change
The public health grant has fallen in real terms since its funding peak in 2014/15. The cost of service provision and demand for services have both changed. Changes to the age profile of the population and therefore the relative demand for different services, and changes in levels of economic disadvantage, also drive demand for services, especially for children.
Maintaining spend in real terms since the 2014/15 peak: £0.7bn gap
The public health grant has been falling in real terms (and cash terms), meaning that the power of the grant to purchase health care goods and services has been falling. To calculate the size of this real-terms gap in spending, it is assumed that the core element of the grant will keep pace with gross domestic product (GDP) growth to 2019/20, based on out-turn and Office for Budget Responsibility projections. It is also assumed that spending on services for children 0–5 years of age will keep pace with GDP growth since its first full year in 2016/17.
Accounting for demographic and social change: £0.6bn gap
Even if the grant were restored to 2014/15 levels, this would not consider the fact that population needs have increased since that time. The ACRA formula provides detailed information on the projected demand for sexual health, alcohol and drug abuse and children services in each local authority. The estimates are based on the population of different age groups in each area and, for children’s services, the level of child poverty. To assess how that need has increased over time, the change in population by age group has been applied to the related cost using Office of National Statistics population estimates for 2013/14 and projections for 2019/20 at a local authority level. The rate of child poverty in each local area is estimated to increase in line with (rising) child poverty projections for the whole of the UK produced by the Institute for Fiscal Studies.
Aligning spending with need
The public health grant was introduced with the intention, at least, of better aligning spending with need. Given this aim, an approach that takes into account differences in mortality, poverty and local need for specific services certainly makes sense. The ACRA formula was developed along those lines, and is a sound basis for considering the optimum allocation of funds. (Although alternative methods to distribute funds obviously exist, analysis of these is beyond the scope of this briefing.)
ACRA usually recommends a pace of change with differential growth to meet a final allocation over the longer term. At present, consultation about the formula relates to its final allocation, rather than how to move towards it, given the context of ongoing cuts to the grant.
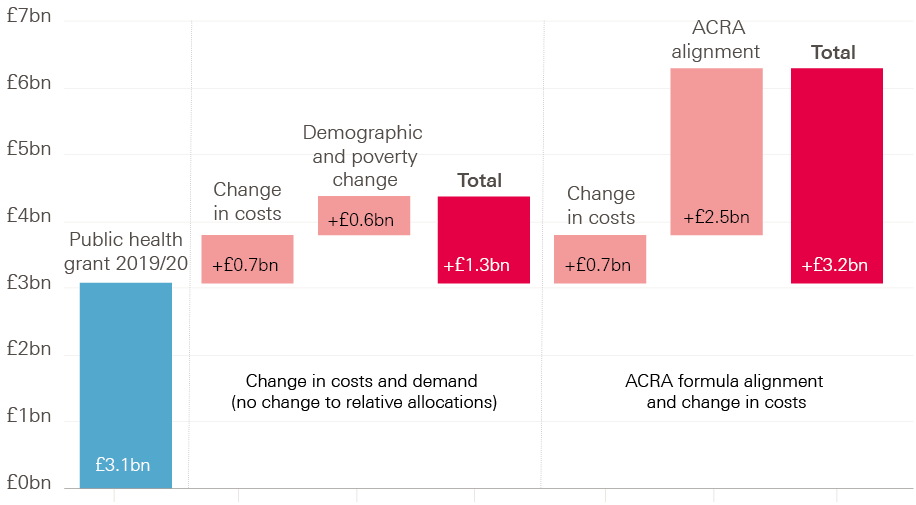
Overnight implementation of the spending allocation suggested by the ACRA formula, restoring the public health grant in real terms, and without any area experiencing a loss, would require a £3.2bn increase in spending. £2.5bn of this is accounted for by the reallocation, and the remaining £0.7bn by restoring the public health grant to its real-terms value (at its peak in 2014/15). The reallocation estimate is reached by finding the local authority facing the greatest potential reduction in funding due to the ACRA formula, maintaining their current level of funding and then allocating all other spend relative to this value. In practice, implementing this allocation could occur over several years, with differential growth rates applied to the areas furthest away from the formula allocation. However, given the scale and pattern of funding cuts, the government should reinvest £1.3bn in 2019/20 to restore the real-terms reduction in spend (£0.7bn) and target additional funding on the most-deprived areas while moving towards the ACRA allocation (£0.6bn). If that is to be achieved without further real-terms reductions in spend in any area, then setting such a path would require an above real-terms increase in the grant until the final allocation is reached to allow for such differential growth.
Figure 10 compares the funding gaps we have identified. The public health grant is expected to be £3.1bn in 2019/20. Simply accounting for changes in costs and demand for services by then would require an additional £1.3bn of funding. However, this would do nothing to ensure that allocations best meet local need, which is what the ACRA formula seeks to achieve. Overnight implementation of funding in line with the ACRA formula, accounting for changes in costs and without making any local area worse off, would require £3.2bn of additional funding – more than doubling the expected budget.
Figure 10: The public health grant ‘gap’ in 2019/20 (2018/19 real terms)
Note: Real terms refers to 2018/19 prices, using the Gross Domestic Product deflator from the Office for Budget Responsibility.
The case for investing in public health
What do we know about the relative value of public health interventions?
With finite resources available, decision makers need to strike a cost-effective balance between investment in ‘upstream’ public health interventions and ‘downstream’ treatment of ill health. Finding this balance is far from simple. Evidence relating to the effectiveness of public health interventions is limited compared with that for health care treatments. This is partly due to the nature of such interventions. Changes in population health are often the result of multiple small behavioural and environmental changes that are driven by many factors and might not be seen for years.
One way to assess the merit of greater investment in public health is to compare the marginal cost of such interventions with that of health care treatments. If, for example, the cost of a given intervention is lower than that of a treatment, but leads to a similar improvement in population health, then it would support the case for greater investment in public health over health care.
Such comparisons are complicated, as interventions to maintain and improve people’s health do not necessarily equate to reducing future health care costs. Living longer, for example, simply delays the costs associated with late life and death. However, improved health can reduce the lifetime costs of treating disease.
The cost-effectiveness of interventions can theoretically be measured using the cost per quality-adjusted life-year (QALY). Across the NHS, the average cost per QALY of health care interventions is £13,000. An equivalent estimate for public health interventions has not yet been made, although Public Health England plans to fund research into this in 2019.
Public health interventions tend to be assessed on a wider basis than cost per QALY; instead, the overall return on investment (ROI) is often measured. ROI includes long-term benefits to both the individual and society, though it does not estimate cash savings to the Treasury. Public health interventions are assessed in this way as they are often compared with wider policy interventions (such as housing or transport developments), and because improvements in health tend to have long-term consequences. This can make like-for-like comparisons of public health interventions and health care treatments difficult.
Research into the ROI from local-level public health measures suggests a typical return of 14:1. That is, society benefits by an average of 14 times the initial investment into each intervention. There can be a wide range of returns, depending on intervention type and the geographical level (national or more local) at which it takes effect: for example, regulatory measures like smoking bans (typical ROI of 46.5), health protection like immunisation schemes (typical ROI of 34.2), social interventions like working with young offenders (typical ROI of 5.6).
The same study estimates that a cost per QALY of £13,000 is equivalent to an ROI of 3.16. This ROI estimate should be thought as an indication of scale only, and there is certainly room for improvement in the comprehensiveness of public health intervention assessments, because the estimate is lower than those mentioned above (even for local-level social interventions). There is a clear case for greater ‘upstream’ public health investment.
These findings are particularly relevant at a time in which the government has pledged a significant funding boost to the NHS, which provides predominantly ‘downstream’ health care services. That funding boost will sit alongside already announced, real-terms cuts to the public health grant.
Funding public health
Although the case for investing in public health is likely to strengthen as the evidence base improves, there are two fundamental issues that dominate the landscape for local governments.
Greater control of locally raised revenues
The government’s intention is that revenue raised through business rates will remain fully in the hands of local authorities. The trade-off is a reduction in support from the centre via grants – such as the public health grant. Some areas, such as Greater Manchester, are already trialling the approach of full business rate retention.
However, local authorities would not keep full control of the finances they raise. Some of the funding would be redistributed to areas of higher need. It is vital that any funding to support public health is distributed to those with the greatest need, but without creating large reductions in support in any given local area. The ACRA formula is the government's proposed method of determining the distribution of public health funding, but does not suggest the size of the total pot. Our analysis suggests the pot should be substantially bigger than at present and that, even if the ACRA formula is adopted (with differential growth), a more immediate boost to funding is required to offset years of real-terms reductions.
As well as giving local authorities greater control of their funding sources, a reason for this move is to give them an incentive to maximise local tax revenue. However, it is likely that the least-deprived areas, or those with relatively strong growth, will be most able to increase their revenue. This could ultimately widen health inequalities. That’s why it is so important to ensure the appropriate level of funding and fair distribution of funding for public health.
One priority among many funding pressures
Thinking about improving health purely in terms of the public health grant and health care misses out a big part of what makes us healthy. Improving health also requires focus on the social determinants of health, such as education, housing, job quality and physical environment.
Between 2010/11 and 2016/17, local authority budgets have been reduced by 32.6% (excluding adult social care). Although there once may have been a case to seek greater efficiencies in local spending, the mounting reports of councils in significant financial difficulties and cutting back all but the most basic provision suggest funding cuts are reducing the services councils provide. Beyond cuts in service provision, changes to working-age benefits are expected to increase levels of child poverty. Given the strong association between poverty and health outcomes, there is real cause for concern about the impact on people’s health.
The health implications of reductions in services or income may not be immediately apparent. Changes in population health tend to be long term and can be lost when data is viewed as averages rather than for specific groups or local areas.
The consequences of eroding people’s health are likely to prove far more expensive, both to individuals and the state, than the cost of supporting people to stay healthy.
Future Health Foundation research will explore the impact of changes in policy on people’s health, both in the short and long term. However, it is vital that the government considers the impact of such large reductions in local service provision on people’s health.
¶ One QALY is equivalent to 1 year of life in perfect health.
Conclusions: Investing in health
Moving towards a society that prioritises the maintenance and improvement of people’s health requires far more than investment in the public health grant. However, the grant is an important starting point.
- It provides a recognition of the importance of health and the need to invest in it.
- It ensures a greater level of influence for public health directors in local decision making.
- It allows local areas to play a greater role in determining the best mechanism through which to improve health.
- It is intended to be distributed in a way that recognises the inequalities between local areas, which partially determine the health of people in those areas.
With the NHS having marked it 70th anniversary in 2018, and with additional investment pledged to ensure it can treat people into the future, it is time for the government to make an important forward move towards improving health, rather than just health care. To back up the rhetoric of putting prevention first and increasing 'upstream' intervention, it must provide the necessary funding to do so. That should start with direct reinvestment in the public health grant so that, like the NHS, current provision can be at least maintained. However, to ensure more than a short-term fix, the impact of local government funding cuts on long-term health should be assessed to make sure we are not storing up health problems for the future.
References
- Charlesworth A, Johnson P (eds). Securing the Future: Funding Health and Social Care to the 2030s. The Health Foundation, Institute for Fiscal Studies, 2018.
- Bottery S, Varrow M, Thorlby R, Wellings D. A fork in the road: Next steps for social care funding reform. The Health Foundation, 2018.
- May T. PM Speech on the NHS: 18 June 2018 (www.gov.uk/government/speeches/pm-speech-on-the-nhs-18-june-2018).
- Department of Health and Social Care, NHS England. NHS Public Health Functions Agreement 2018–19: Public Health Functions to be Exercised by NHS England. Department of Health and Social Care, 2018.
- Public Health England. Strategic Plan for the Next Four Years: Better Outcomes by 2020. Public Health England, 2016.
- National Audit Office. Financial Sustainability of Local Authorities 2018. National Audit Office, 2018.
- British Medical Association. Funding for Ill-Health Prevention and Public Health in the UK. British Medical Association, 2017.
- NHS England. Five Year Forward View. NHS England, 2016.
- Ministry of Housing, Communities and Local Government. Local Authority Revenue Expenditure and Financing [collection]. Ministry of Housing, Communities and Local Government, 2018.
- Department of Health and Social Care. Public Health Grants to Local Authorities: 2018 to 2019. Department of Health and Social Care, 2017.
- Office for Budget Responsibility. Public Finances databank, June 2018. Office for Budget Responsibility, 2018 (https://obr.uk/data).
- Department for Communities and Local Government. The English Indices of Deprivation. Department for Communities and Local Government, 2015 (http://assets.publishing.service.gov.uk/government/uploads/system/uploads/attachment_data/file/465791/English_Indices_of_Deprivation_2015_-_Statistical_Release.pdf).
- Bibby J, Lovell N. Healthy Lives for People in the UK. The Health Foundation, 2017.
- Smith T, Noble M, Noble S, Wright G, McLennan D, Plunkett E. The English Indices of Deprivation 2015: Technical Report. Department for Communities and Local Government, 2015.
- Department of Health and Social Care, NHS England. Terms of Reference: Advisory Committee on Resource Allocation (ACRA): 2018 Update. Department of Health and Social Care, 2018 (www.england.nhs.uk/wp-content/uploads/2018/03/acra-terms-of-reference-18.pdf).
- Resource Allocation Team, Public Health Policy and Strategy Group. Exposition Book Public Health Allocations 2013-14 and 2014-15: Technical Guide. Department of Health, 2013.
- Resource Allocation Team, Public Health Policy and Strategy Group. Public Health Grant: Exposition Book for Proposed Formula for 2016-17 Target Allocations – Technical Guide. Department of Health, 2015.
- Buck D. Who Gets What is Tricky: Allocating Public Health Resources to Local Authorities. The King's Fund, 16 February 2012 (www.kingsfund.org.uk/blog/2012/02/who-gets-what-gets-tricky-allocating-public-health-resources-local-authorities).
- Public Health England. Sexually Transmitted Infections and Screening for Chlamydia in England, 2017. Health Protection Report Volume 12, Number 20. Public Health England, 2018.
- Office for National Statistics. Deaths Related to Drug Poisoning in England and Wales: 2017 Registration. Office for National Statistics, 2018 (www.ons.gov.uk/peoplepopulationandcommunity/birthsdeathsandmarriages/deaths/bulletins/deathsrelatedtodrugpoisoninginenglandandwales/2017registrations).
- Office for National Statistics. Changing Trends in Mortality in England and Wales: 1990 to 2017. Office for National Statistics, 2018.
- Raleigh V. Is the Problem of Excessive Winter Deaths Unique to the UK? The King's Fund, 2 July 2018 (www.kingsfund.org.uk/blog/2018/07/problem-excessive-winter-deaths-unique-uk).
- Dorling D, Gietel-Basten S. Life Expectancy in Britain has Fallen so much that a Million Years of Life could Disappear by 2058 – Why? The Conversation UK, 29 November 2017 (http://theconversation.com/life-expectancy-in-britain-has-fallen-so-much-that-a-million-years-of-life-could-disappear-by-2058-why-88063).
- Office for National Statistics. Health State Life Expectancies, UK: 2014 to 2016. ONS, 2017.
- Office for Budgetary Responsibility. Fiscal Sustainability Report – June 2018. Office for Budgetary Responsibility, 2018.
- HM Treasury. Public Expenditure: Statistical Analyses 2018. HM Treasury, 2018.
- Department of Health. Exposition Book Public Health Grant: Proposed Formula for 2016–17. Department of Health, 2015.
- Office for National Statistics. Dataset: Population Projections for Local Authorities: Table 2. Office for National Statistics, 2018 (www.ons.gov.uk/peoplepopulationandcommunity/populationandmigration/populationprojections/datasets/localauthoritiesinenglandtable2).
- Hood A, Waters T. Living Standards, Poverty and Inequality in the UK: 2016–17 to 2021–22. Institute of Fiscal Studies, 2017.
- Office for National Statistics. Estimates of the Population for the UK, England and Wales, Scotland and Northern Ireland. Office for National Statistics, 2018 (www.ons.gov.uk/peoplepopulationandcommunity/populationandmigration/populationestimates/datasets/populationestimatesforukenglandandwalesscotlandandnorthernireland).
- Office for National Statistics. Subnational Population Projections for England: 2016-Based. Office for National Statistics, 2018 (www.ons.gov.uk/releases/subnationalpopulationprojectionsforengland2016basedprojections).
- Claxton K, Martin S, Soares M, Rice N, Spackman E, Hinde S, et al. Methods for the estimation of the NICE cost effectiveness threshold. Health Technol Assess, 2015;19(14):1–503.
- Masters, R, Anwar, E, Collins, B, Cookson, R, Capewell, S. Return on investment of public health interventions: A systematic review. J Epidemiol Community Health, 2017;71:827–834.