Foreword
It has been a great privilege to chair the COVID-19 impact inquiry. When the inquiry began last autumn, it was still reasonable to expect that by the summer of 2021 we would be in a ‘post-pandemic’ phase. As the months have elapsed it has become clear that we will be living with the pandemic itself, as well as its consequences, for a long time to come. And while still not yet over, there are already some clear messages about the uneven impact it has had on different groups within society.
With many words already written about the pandemic, and so much more to come, we did not set out to tell the whole story of COVID-19’s impact and the measures to contain it. Instead, we have sought to draw together thinking across a variety of disciplines, to situate COVID-19 in the wider picture of health inequalities and to understand how this extreme experience may influence the journey towards greater equality.
In doing so we were hugely assisted by an Expert Advisory Panel, with expertise spanning research, civil society and public service. The panel’s broad understanding of the dimensions and determinants of health, across the nations and regions of the UK, was invaluable in challenging and enriching our discussions.
We were able to draw on research being written in real time as the pandemic moved from the first wave into its extended second wave. Some early impacts were partially reversed as restrictions ebbed and flowed. Others have become entrenched, often with uneven effects, with remote services proving more accessible for some while risking exacerbating problems of digital exclusion for others.
Our guiding principle was understanding how the UK’s experience of the pandemic could inform the decisions of a government committed to improving the health of its population, shining a light on the key issue of recovery.
The inquiry found that the shape of the UK’s recovery from the 2008 financial crisis, the last major global shock, had a direct bearing on our experience of the pandemic. In turn, we can expect the nature of the recovery from the pandemic to shape our experience of the next global shock, whatever it may turn out to be. That makes it imperative to aim for a recovery that builds economic and social resilience, with ‘levelling up’ not limited to geographical areas of disadvantage but also addressing the needs of groups who have experienced the most damaging impacts of the pandemic.
The legacy of the pandemic is all around us in unmet health need, mental health problems, gaps in educational attainment, loss of employment and financial insecurity. If we are to avoid these becoming long-term scars, it’s time to confront our choices about how we value people. A recovery led by investment in people and communities – in health, housing, skills and education – along with a safety net to protect the most vulnerable, will pay dividends for the nation’s health and prosperity in the longer term.
Dame Clare Moriarty
Chair, COVID-19 impact inquiry Expert Advisory Panel
Executive summary
As the success of the COVID-19 vaccination programme sets the UK on a course towards recovery, it is essential to learn the lessons of the past 18 months. What started as a health crisis rapidly developed into an economic emergency, with government taking unprecedented action to protect people’s lives and livelihoods. The pandemic has shown that health and wealth are inextricably connected. A sustainable recovery needs to create a stronger, more resilient economy and will require purposeful commitment to ‘level up’ health and reduce the stark inequalities exposed by the pandemic.
Although COVID-19 has challenged governments around the world, the UK was notable in entering the pandemic with life expectancy stalling for the first time in a century and falling for some. Following the 2008 financial crisis, public services had been eroded and the underlying economy and social fabric frayed.
Over the first year the UK experienced some of the worst outcomes internationally, with 119,000 excess deaths by 13 March 2021. Measures to suppress the virus have led to the UK experiencing a huge economic shock – including a 9.9% drop in GDP in 2020 compared with a 4.8% drop across all OECD countries.
Behind these overall figures lie the unequal burdens carried by different population groups and regions. During the first wave of the pandemic, 40% of all UK deaths were among care home residents. 6 out of 10 people who died with COVID-19 between January and November 2020 were disabled. And people from ethnic minority communities had significantly higher risk of mortality – 3.7 times greater for black African men than their white counterparts during the first wave and Bangladeshi men more than five times more likely to die during the second wave.
The Health Foundation’s COVID-19 impact inquiry has drawn on a broad range of available evidence to consider two main questions:
- How were people’s experiences of the pandemic influenced by their pre-existing health and health inequalities?
- What is the likely impact of actions taken in response to the pandemic on the nation’s health and health inequalities – now and in the future?
It is beyond our intended scope to propose specific policy recommendations. But the findings from this inquiry can direct policymakers at national and local level to some core issues that need attention as they take the recovery forward.
COVID-19 mortality and the actions taken to reduce it
Government restrictions have suppressed the spread of the virus and saved lives. National and tiered lockdowns, PPE provision, self-isolation measures, and the vaccine programme have moved us towards recovery.
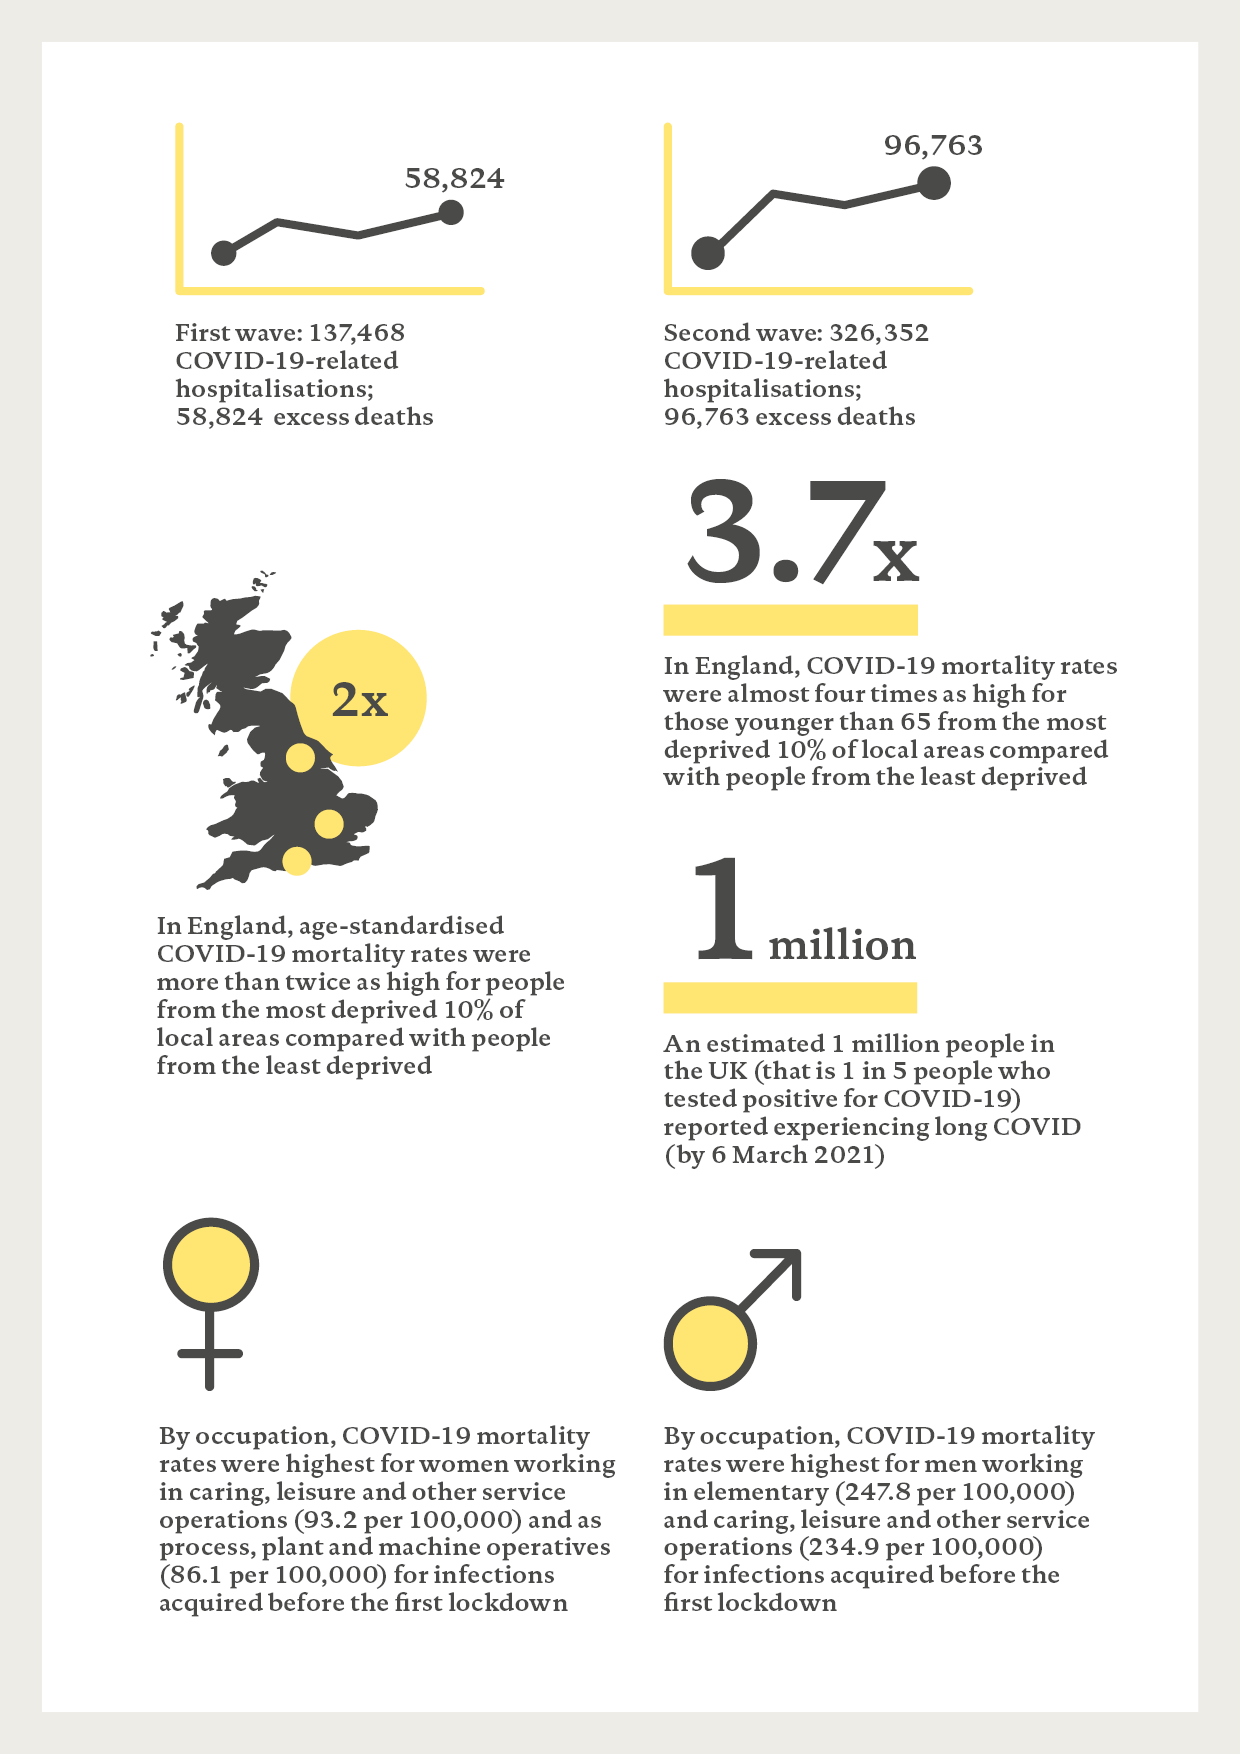
Despite these actions, the UK had the fourth highest excess deaths of OECD countries in 2020. Excess deaths for people younger than 65 were the second highest in Europe after Bulgaria. The UK’s experience was worse during the second wave (326,352 COVID-19-related hospitalisations and 96,763 COVID-19 deaths in this wave alone).
Several factors have influenced variations in the impact of COVID-19 across different countries. The single biggest factor was the timing of pandemic restrictions as these influenced levels of exposure to the virus. Population density and high levels of regional and international travel accelerated spread in the UK ahead of restrictions.
Poor underlying health also accounted for differences in excess mortality among countries – particularly in the outcomes for people younger than 65. Countries with the greatest improvement in healthy life expectancy over the previous decade experienced lower excess mortality during the pandemic. Conversely, countries with the highest levels of disability-adjusted life years lost to diabetes, cardiovascular disease, cancer and chronic respiratory disease had higher mortality rates.
Certain socioeconomic factors were also associated with an increased risk of transmission. In England, COVID-19 mortality rates were more than twice as high for people from the most deprived 10% of local areas compared with people from the least deprived, and almost four times as high for people younger than 65. Pre-existing differences in health were associated with worse outcomes from COVID-19, with those aged 50–69 in the most deprived areas twice as likely as those in the least deprived areas to have at least two long-term health conditions.
The type of work someone does and their access to financial support also shaped their risk of, and outcomes from, COVID-19. People working in elementary, caring, leisure and other service occupations had higher mortality rates, and these were higher still for men. This partly reflects poorer existing health, but also because these roles are often in sectors typified by having remained open during lockdowns or having fewer restrictive measures. For lower income workers, the inadequate level of support for sick pay was a key factor in not self-isolating.
Immediate risks to health
The immediate risks to people’s health go beyond the direct harm caused by the virus. Reprioritisation of health care services to manage COVID-19-related demand has led to increased unmet need for care. Health Foundation analysis shows that 6 million ‘missing patients’ did not seek treatment in 2020, which could mean many living with poor health for longer. In cases of acute need, such as cancer care, where treatments have been delayed, reductions in survival rates are likely.
Long COVID will limit people’s ability to return to daily life. By May 2021, an estimated 1 million people self-reported being affected by long COVID (equivalent to 1 in 5 people who tested positive for COVID-19). Women and those from more deprived backgrounds appear to be at particular risk, disrupting employment and reducing quality of life.
“In England, COVID-19 mortality rates were almost four times as high for those younger than 65 from the most deprived 10% of local areas.”
Pandemic restrictions have also affected people’s mental health through reduced social interaction, changing work conditions and loss of work and income. Although the easing of restrictions tended to improve mental health, by September 2020 there had been a sustained deterioration in mental health for a fifth of the population. Women, younger people and those facing financial hardship have fared the worst.
Access to social care services has declined despite increasing need. This will have longer term effects on the health and wellbeing of those needing care and exacerbate the growing pre-pandemic responsibilities of unpaid carers.
Reported incidents of domestic abuse increased during the first wave of the pandemic. With children out of school, child safeguarding referrals reduced. One study found a 37% decrease in referrals for child protection medical examinations between February and June 2020 than in the same period in 2019 – suggesting some children were left exposed to harm.
The vaccination programme has been crucial in reducing the spread of the virus and preventing deaths and hospitalisations with over 70 million doses of the vaccine given by 12 June 2021. Despite this there are emerging differences in access to and uptake of the vaccine. In the least deprived fifth of areas 95% of people aged 50 and older have received one dose, compared with 88% in the poorest. 67% of black Caribbean people and 78% of Pakistani people older than 50 have received one dose compared with 94% of white people. These threaten to exacerbate existing health inequalities as well as the continued risk posed by existing and emerging variants.
Future risks to health
With large parts of the economy shut down and people required to stay at home, the government implemented unprecedented economic measures to provide support for individuals, families and businesses (such as the Coronavirus Job Retention Scheme) and increased existing financial support (such as the £20 weekly Universal Credit uplift). Despite the scale of action, 28% of adults saw their family finances deteriorate by September 2020. Many families had to rely on savings or debt to get by with more than half (54%) of those in the poorest fifth seeing their debts rise compared with 31% of the wealthiest fifth.
Although there were early signs of labour market recovery in spring 2021, an extra 2.8 million people were out of work in May 2021 than before the pandemic, and the end of the furlough scheme in autumn is likely to mean unemployment rises. Assuming the £20 a week uplift to Universal Credit ends in September 2021, around 6 million families will experience a drop in income.
Experiencing financial strain or periods of unemployment – resulting in lack of status, structure and income – are associated with poorer physical and mental health. As temporary support measures end, the pandemic risks further eroding people’s health through a decline in living conditions and an increase in poverty.
The loss of education during the pandemic also risks widening the gap in future health outcomes. The cohort of children and young people who have missed periods of education could lag behind pre-pandemic cohorts. The loss of education has also not fallen evenly, with children from more disadvantaged backgrounds having experienced a greater deterioration in their educational outcomes.
But the risks to health identified in this report are far from inevitable and can be addressed through a fair recovery.
Ensuring a healthy recovery
The government’s ‘levelling up’ agenda – and its associated funding for local government – creates an opportunity to ensure this recovery is managed better than that following the 2008 financial crisis and creates a more resilient and fairer society.
With poor health estimated to cost the UK economy £100bn a year in reduced productivity, the much-needed economic recovery will also require a recovery in the nation’s health.
Immediate action is needed to address the harm caused by the pandemic – tackling the health care backlog, protecting family finances and ‘catching up’ on education. There need to be greater protections for low-paid workers as well as schemes and targeted support for people whose mental health has deteriorated to get back into work.
Over the longer term, resilience can be built through investment to create good-quality jobs in areas with historically low employment, as well as those hardest hit by the pandemic. Businesses can design better quality jobs and individuals can continue to help strengthen local communities. Weaknesses in the welfare state need to be addressed to provide an adequate safety net that supports people through income and health shocks. Public services will require investment and to be redesigned to put prevention first.
The nation’s health has frayed over the past decade and this has contributed to the UK experiencing some of the poorest global outcomes from the COVID-19 pandemic. Ensuring a recovery that improves health – as well as the economy – will require a cross-government health inequalities strategy with clear targets for improvement and a regular, independent assessment of the nation’s health laid before parliament.
* Excess deaths measure additional deaths over a time period compared with the number of deaths usually expected. We measure the deaths caused by the pandemic in excess deaths instead of registered COVID-19 deaths due to discrepancies in the way COVID-19 deaths are recorded.
Introduction
The COVID-19 pandemic has had a profound impact on people’s health and their livelihoods. By mid-March 2021, the pandemic had led to 119,000 excess deaths in the UK and in 2020 caused a 9.9% drop in GDP. The UK government and devolved governments have taken far-reaching action in attempts to suppress the virus: schools closed, routine health care suspended, and businesses and community facilities shut down.
People’s experiences of the pandemic have varied greatly. Not everyone faced the same risk of exposure to the virus nor equivalent severity in health outcomes. The measures taken to suppress the virus have affected people’s lives and livelihoods differently – with both immediate and longer term consequences for people’s health and wellbeing.
Although COVID-19 has been challenging for governments around the world, the UK entered the pandemic with life expectancy stalling for the first time in a century. A month before the first national lockdown, The Marmot Review 10 Years On – funded by the Health Foundation – showed that life expectancy had gone into reverse for the most socioeconomically deprived communities, revealing a growing gap in health between wealthy and deprived areas.
This report explores how the same factors contributing to this widening of health inequalities exposed the UK to a high death toll and reduced people’s ability to deal with the subsequent economic shock. Drawing on an extensive body of evidence, this report identifies what has driven such outcomes during the pandemic.
Scope and structure of this report
The factors shaping the UK’s overall experience of the pandemic are complex and multifaceted, and the pandemic is still ongoing. The COVID-19 impact inquiry provides an initial assessment of the effects of the pandemic using evidence available up to May 2021.
The inquiry set out to answer two key questions:
- How were people’s experiences of the pandemic influenced by their pre-existing health and health inequalities?
- What is the likely impact of actions taken in response to the pandemic on people’s health and health inequalities – now and in the future?
The inquiry did not set out to formulate specific policy recommendations but does highlight the need for action in two key areas to ensure the recovery creates a more resilient society that improves the nation’s health: immediate action to address the harm caused by the pandemic and prevent longer term scarring effects; building resilience for the longer term.
The COVID-19 impact inquiry
The Health Foundation launched this inquiry in October 2020 to gather, analyse and synthesise evidence and insight from an extensive range of sources, including:
- submissions received from around 75 charities, patient representative groups and community organisations, through an open call and an in-house evidence review of an additional 600 papers
- commissioned work to address gaps in the literature relating to the experience of specific population groups
- a literature review of existing qualitative evidence, to understand the public experience of the pandemic
- stakeholder meetings focused on disability and digital exclusion, as well as discussions and analyses of the impacts of the pandemic across the four UK nations
- in-house Health Foundation data analysis.
Other sources of data were excluded, such as studies with a low sample size or qualitative data that could not be triangulated by other evidence. The literature review covers evidence up to May 2021 and more detail of this review and the analysis is available in the separate technical supplement.
Box 1: The Expert Advisory Panel
The inquiry has been guided and informed by an advisory panel with expert members from across the areas of inequalities, economics and the wider determinants of health. The members are:
- Dame Clare Moriarty (Chair)
- Lord Victor Adebowale CBE
- Professor James Banks
- Yvonne Coghill CBE
- Professor George Davey Smith FRS
- Sarah Davidson
- Fozia Irfan
- Polly MacKenzie
- Professor Sir Michael Marmot
- Auriol Miller
- Professor James Nazroo
- Dr Vanessa Pinfold
- Yusuf Qureshi
- Matthew Whitaker
COVID-19 health outcomes
Summary
During the first wave, the UK had the fourth highest rate of excess deaths out of 33 OECD countries behind Spain, Mexico and the USA. Despite government measures to supress the virus, the UK experienced higher hospitalisations and excess deaths during its second wave. It also had one of the highest excess mortality rates among those younger than 65 in Europe.
The single biggest factor influencing differences in COVID-19 mortality between countries was the timing of restrictions. The virus spread throughout the UK before restrictions were applied due to higher levels of travel within and to the UK. Underlying population health also accounted for some of the variation in excess mortality between countries.
In the UK certain groups experienced disproportionate levels of exposure and deaths due to the virus. These included: older people, people from ethnic minority communities, disabled people and people working in certain occupations, including some keyworker roles.
Occupation, living conditions and the ability to access financial support affected risk of exposure to COVID-19. Low rates and coverage of statutory sick pay, and difficulty in accessing isolation payments reduced people’s ability to self-isolate and increased exposure. Being able to work from home reduced the exposure risk.
Once exposed, people’s pre-existing physical and mental health made them more vulnerable to severe outcomes. People with pre-existing conditions, such as diabetes, obesity, cancer, respiratory disease and underlying mental health conditions were at increased risk of death from COVID-19.
In England, for people younger than 65, the COVID-19 mortality rate for the 10% living in the most deprived areas is almost four times that of those in the least deprived areas. This partly reflects the poorer health of people living in more deprived areas.
The vaccination programme has been crucial in preventing many deaths and hospitalisations. Despite this some groups have lower access to and uptake of the vaccine.
COVID-19 health outcomes summary
The COVID-19 pandemic has had profound consequences for the health of people in the UK. Most directly – and visibly – through the numbers of deaths attributed to COVID-19 and those who have experienced severe symptoms. As explored in this section, the UK’s high COVID-19 death toll reflects a range of different factors. While some factors relate to how the pandemic was managed – such as the timing of lockdown measures – others reflect pre-existing aspects of the structure of UK society and the economy, such as the wide disparity in COVID-19 mortality rates for those younger than 65.
COVID-19 outcomes in the UK
COVID-19 was first detected in the UK in January 2020 with the first known death occurring at the beginning of March 2020. On 23 March, the UK government mandated a nationwide lockdown requiring certain businesses to close and for people to only leave their homes for essential purposes. By this time there were already 938 deaths recorded and around 5,000 hospitalisations attributed to COVID-19. Most of these deaths had occurred in England (876), with Wales (24), Scotland (29) and Northern Ireland (9) recording fewer deaths.
Box 2: COVID-19 waves and mortality
Where possible, this report uses the Office for National Statistics (ONS) definition of first and second waves. The first wave refers to the period between 24 January and 11 September 2020. The second wave refers to the period from September 12 2020. Where our analysis diverges from this definition, this is clearly flagged.
A measure of excess mortality for COVID-19 deaths in the first wave is used – this is the number of deaths in a given period over and above the number expected, such as the average number recorded in the same week of the past 5 years. This was the international gold standard used to measure mortality during the pandemic, and the measure we used for international comparisons.
This is more reliable than measuring cases of COVID-19 because testing and the reporting of deaths vary between countries. This also matters in comparing between waves in the UK, given testing was less available during the first wave and conducted mainly for hospitalisations, leaving high numbers of potential infections uncounted.
For the second wave, COVID-19 deaths are a more accurate measure of COVID-19-related mortality in the UK. This is due to increased testing and because excess mortality was reduced due to lower numbers of deaths than usual from flu during winter 2020–21.
The nationwide lockdown saved thousands of lives but by the end of the first wave the UK had experienced 137,466 hospitalisations due to COVID-19 and 58,824 excess deaths. With tight restrictions in place, the number of COVID-19 cases and deaths began to fall from mid-April 2020. By the end of June, weekly deaths were back to levels consistent with previous years.
As restrictions eased in the summer, COVID-19 cases again began to rise, leading to a second wave. Between 12 September 2020 and 30 April 2021, the UK experienced a further 96,763 COVID-19 deaths and 326,352 hospitalisations. The second wave was a more prolonged outbreak.
Figure 1: Excess deaths and deaths involving COVID-19 by week registered, per 100,000 people, UK, January 2020 to June 2021
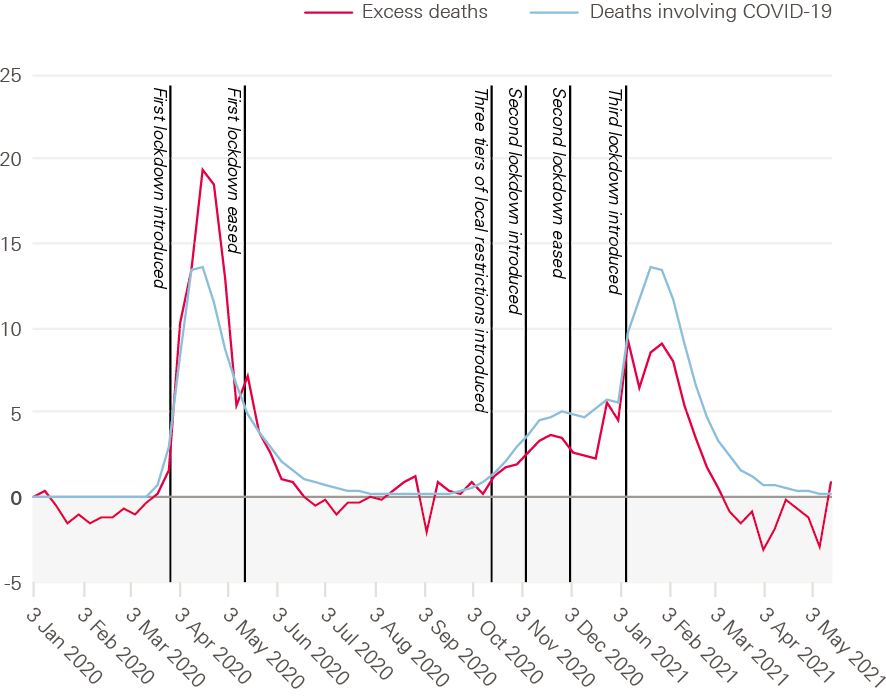
Source: Health Foundation analysis of ONS, Weekly provisional figures on deaths registered in England and Wales; National Records of Scotland, Deaths involving coronavirus (COVID-19) in Scotland, Weekly data on Births and Deaths in Scotland; NISRA, Weekly deaths bulletin; Mid-year population estimates via NOMIS.
Experiences of COVID-19 have varied across the UK, from one nation to the next and between different regions within nations. England had the highest excess deaths during the first wave. In the second wave, the rates were more similar across the four nations except for Northern Ireland, which had a slightly lower level of excess deaths.
At first, each UK nation imposed the same rules. But over time these varied – in timing and stringency – as measures were eased at the start of June 2020. However, by the end of June, Leicester was back in lockdown and by August other parts of the country had returned to stricter measures. Between the end of the first lockdown (July 2020) and the beginning of the second lockdown (November 2020), some regions and countries in the UK had considerably higher levels of excess mortality. Northern Ireland had 36 excess deaths per 100,000, and the north east and north west of England had 19 per 100,000. London had fewer excess deaths than average, and the south west had 1.6 per 100,000, highlighting the regional variation in outbreaks during this period.
Figure 2: Excess deaths as a share of expected deaths by week registered, for regions and countries of the UK, January 2020 to June 2021
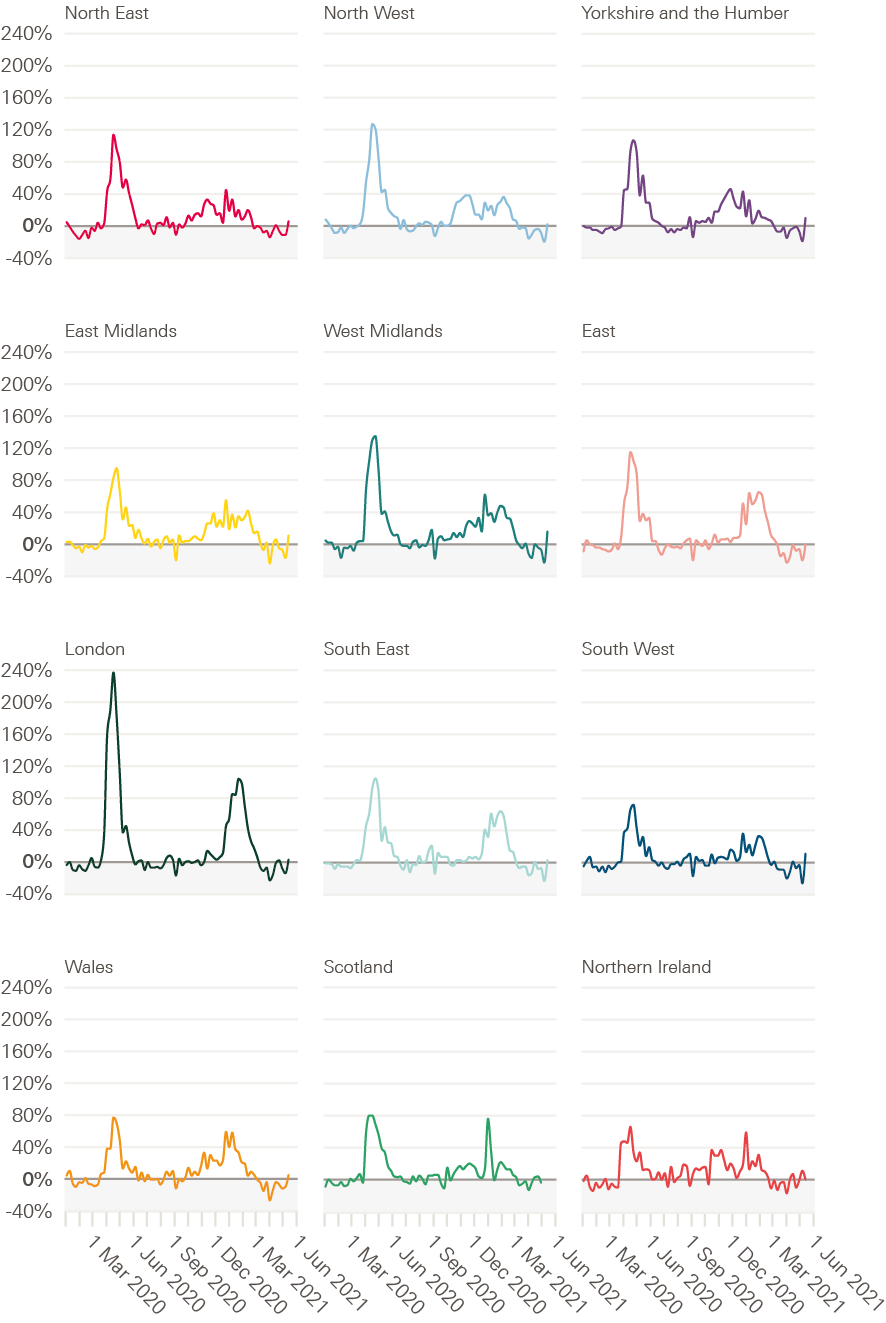
Source: Health Foundation analysis of ONS, Weekly provisional figures on deaths registered in England and Wales; National Records of Scotland, Deaths involving coronavirus (COVID-19) in Scotland, Weekly data on Births and Deaths in Scotland; NISRA, Weekly deaths bulletin; Mid-year population estimates via NOMIS.
In the north of England as well as the East Midlands, deaths began to increase from October 2020 compared with November/December in London and parts of the south of England. These regional variations and tiered restrictions continued until a new national lockdown was imposed in January 2021.
“Across the 33 countries in the OECD with comparable data, the UK had the fourth highest excess mortality rate during this period behind Spain, Mexico and the USA.”
Long COVID
The effect of COVID-19 on people’s health should not only be perceived in terms of hospitalisations and deaths. By May 2021, initial data showed that an estimated 1 million people self-reported being affected by ‘long COVID’ – ongoing symptoms persisting for more than 4 weeks after infection. Of these, 65% reported that persisting symptoms affected their ability to carry out day-to-day activities, including almost 20% who reported these activities had been limited a lot. People with a pre-existing, activity-limiting health condition, women, workers in the health and care sectors and those from more deprived backgrounds have reported higher incidences of long COVID.
Comparing UK COVID-19 outcomes internationally
Outcomes from COVID-19 during 2020 – measured by excess deaths – were significantly worse in the UK than in most other comparable OECD countries. Across the 33 countries in the OECD with comparable data, the UK had the fourth highest excess mortality rate during this period behind Spain, Mexico and the USA. In spring 2020, the UK had a higher peak in the rate of excess deaths than neighbouring or similar countries other than Spain (Figure 3).
In the autumn, excess deaths began to rise and then fall again following short-term restrictions in November, but then rose rapidly through December and January 2021. The 82,305 COVID-19 deaths between 28 November 2020 and 30 April 2021 can be attributed partly to the rapid spread of the alpha variant and a failure to introduce lockdown measures sooner. Few other countries experienced the level of excess deaths that the UK saw at the peak of its second wave.
Restrictions began to be eased again on 12 April 2021. Deaths have remained low in the UK following tight restrictions and the introduction of the vaccination programme. But the threat of emerging variants that may be more transmissible or resistant to existing vaccines remains.
Explaining the differences in COVID-19 outcomes internationally
The single biggest factor in the extent to which COVID-19 spread in the UK compared with other countries is the timing of lockdowns and stringency of restrictions. Higher levels of regional and international travel, increasing burden of disease and worsening social conditions also played a role. Once the virus had spread the extent to which different groups were affected within the UK reflected variations in underlying health and socioeconomic factors that increased risk of exposure and worse outcomes.
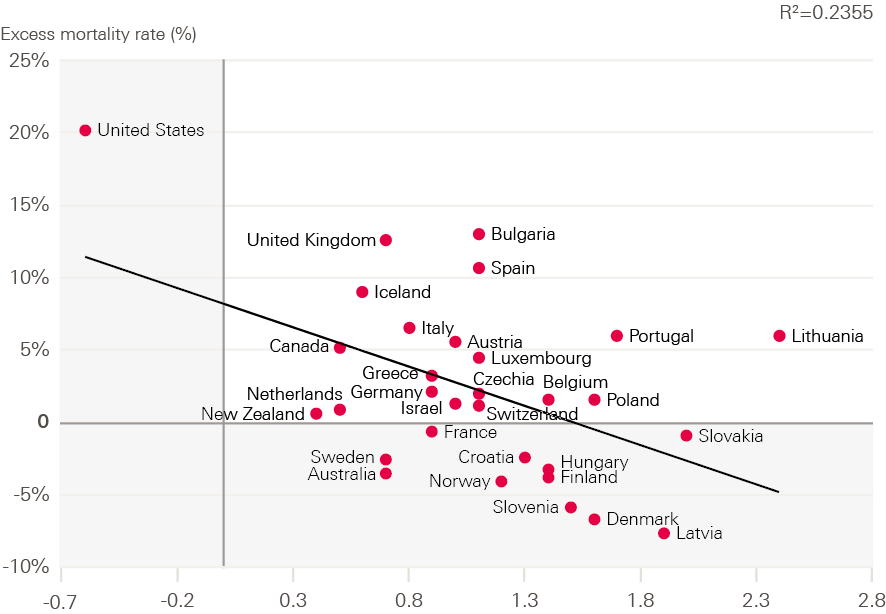
Figure 3: Cumulative excess mortality for select countries, January 2020 to May 2021
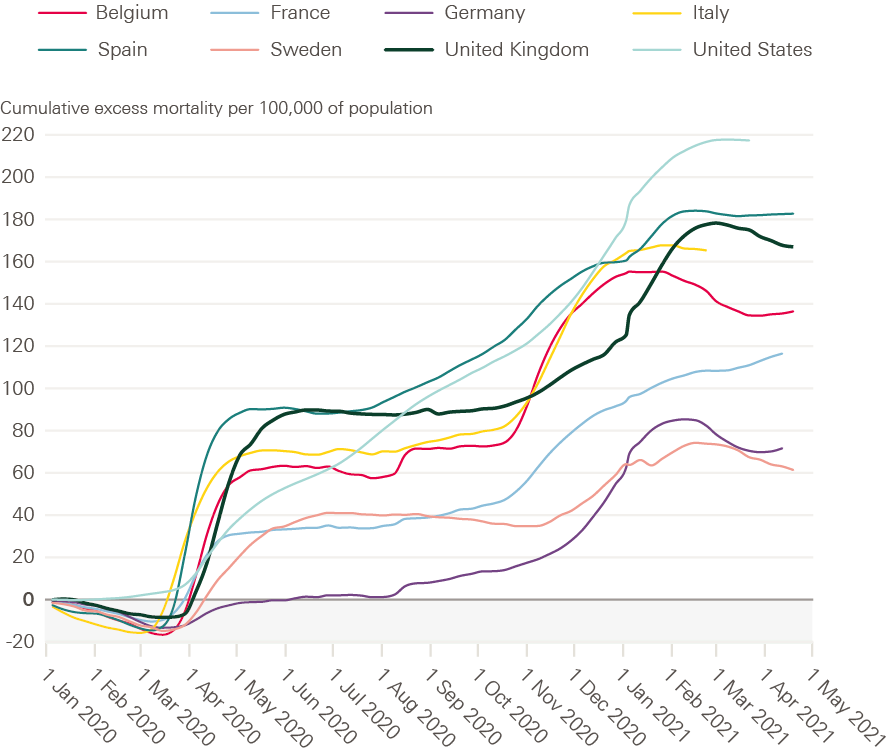
Source: Health Foundation analysis of Our World in Data excess mortality data, population data via OECD Stat for 2018.
Timing of lockdowns and travel
Differences in policy interventions were more important than socioeconomic variations in explaining the varying death rates among OECD countries. One study points to timing of lockdowns accounting for around 40% of the international variation in deaths – highlighting the importance of policy responses in suppressing the spread of the virus.
The extensive spread of the virus observed in the UK reflects three factors:
- COVID-19 entered the country in a number of regions over a similar period of time
- the UK is more densely populated than many developed countries,
- the relatively high level of travel between different UK regions, for instance there were more than 1.7 billion domestic trips in 2019 (versus 260 million in France).
The virus arrived and spread in different places in the UK, leading to excess deaths across all regions. In other countries, the spread of the virus and deaths tended to be isolated to specific regions. For example, in Italy only three northern regions experienced high excess mortality outside of the main cities.
An ageing population and poorer underlying health
The total number of excess deaths during the first wave was highest for older age groups, with 41% of all deaths among those aged 85 and older. Once the virus had spread, the age and health of the UK population (including underlying health conditions and comorbidities) played a role in the severity of outcomes.
The UK has an ageing population, so could expect more deaths than countries with a younger age profile. But deaths among older age groups were far higher in the UK than other countries even though its proportion of people aged 80 and older is below average for a developed country. As healthy life expectancy improvements have not kept pace with life expectancy in the UK, people are living more years in poor health – particularly in older age. This could have led to greater vulnerability to COVID-19.
While there appears to be little relationship between pre-existing levels of life expectancy or healthy life expectancy and excess deaths from COVID-19 across different countries, Figure 4 shows that greater improvement in healthy life expectancy over the past decade is associated with lower COVID-19 mortality. Countries with the greatest improvements in healthy life expectancy in the previous two decades, such as Latvia and Slovenia, experienced lower excess mortality during the pandemic. A similar pattern holds for life expectancy improvements.
Improvements in healthy life expectancy are a meaningful measure of broader and historical social conditions because factors such as adequate income, good-quality jobs and housing are necessary ingredients for good health. The decline in improvement in healthy life expectancy partly reflects the erosion of these social conditions in the UK in the decade preceding the pandemic – affecting certain groups to a greater extent. This reduced the population’s opportunities for good health and is highly likely to have weakened resilience to COVID-19.
Figure 4: Change in healthy life expectancy at birth, 2010–2019 compared with excess mortality as a share of expected deaths during 2020, for people aged younger than 65, selected OECD countries
Source: The Human Mortality Database, Short-term Mortality Fluctuations (STMF) data series; WHO Global Health Observatory data repository.
Note: Greece and Germany calculations are based on 2016-2019 data. Data from 2000 to 2018 are final and results for 2019 and 2020 are provisional. Data for the last 3 weeks of 2020 are estimated. Data for 2020 and 2021 are preliminary. Expected deaths are an average of deaths between 2015 and 2019.
Increasing burden of disease in the UK
Research within the UK, and internationally, shows that certain underlying health conditions increase risk of more severe outcomes from COVID-19. For example, UK adults with diabetes were 1.31–1.95 times more likely (depending on blood sugar levels) to die than those without diabetes, after adjusting for age, sex and other health conditions. Similarly, those with dementia, obesity, cancer, respiratory disease, reduced kidney function or COPD had an increased risk of mortality., In the years leading to the pandemic, the UK experienced declines in health – particularly in the conditions associated with poor COVID-19 outcomes. In 2016, 27.8% of adults in the UK were obese, the highest in Europe. Prevalence data from the Global Burden of Disease study also show that the UK has higher age-standardised prevalence of asthma, COPD, chronic respiratory conditions and diabetes. It is lower for stroke, cardiovascular disease and chronic kidney conditions. In the decade to 2019, diabetes prevalence increased faster in the UK than in the EU.
Table 1: Age-standardised prevalence of certain health conditions associated with COVID-19 outcomes, UK and EU, 2019 and change since 2009
|
UK age-standardised prevalence 2019 |
EU age-standardised prevalence 2019 |
Difference |
Change in the UK since 2009 |
Change in the EU since 2009 |
|
|
Cancer |
2.2% |
2.1% |
0.1% |
0.1% |
0.0% |
|
Diabetes |
9.4% |
6.5% |
2.9% |
1.9% |
0.9% |
|
Chronic kidney disease |
5.7% |
6.6% |
-0.9% |
0.0% |
0.1% |
|
Chronic obstructive pulmonary disease |
4.3% |
3.2% |
1.1% |
-0.1% |
-0.1% |
|
Chronic respiratory conditions |
13.3% |
8.8% |
4.5% |
-1.1% |
-0.5% |
|
Cardiovascular disease |
6.1% |
6.6% |
-0.5% |
0.1% |
-0.1% |
|
Asthma |
10.1% |
6.1% |
4.0% |
-1.2% |
-0.5% |
|
Stroke |
0.7% |
0.9% |
-0.1% |
-0.1% |
-0.1% |
Source: Institute for Health Metrics and Evaluation, Global Burden of Disease Study, 2019 via GBD Results Tool.
People with underlying mental health conditions have also had worse COVID-19 outcomes. Evidence from the UK Biobank study between 31 January and 26 July 2020 found that after adjusting for age, sex, ethnicity, deprivation, BMI, smoking status and certain comorbidities, people with existing psychiatric disorders were 2.0 times more likely to die from COVID-19 than those without. The risk ranged from 1.2 for substance misuse to 3.5 for psychotic disorders. People with more than one psychiatric diagnosis had an even higher risk of dying from COVID-19.
A range of factors contribute to worse COVID-19 outcomes among those with mental health conditions:
- higher prevalence of other underlying health conditions, such as diabetes
- greater likelihood of living in poor living environments
- difficulties appraising health information
- difficulties physically distancing or complying with social distancing restrictions
- stigma resulting in barriers to accessing health care
- differences in immune responses.
A working age population at greater risk
Compared with other European countries, excess mortality among people younger than 65 in the UK was second only to Bulgaria. Figure 5 illustrates the differences between some of these countries. More detailed analysis using data for within the UK shows the rate of excess deaths for 55–64 year olds (45–64 year olds in Scotland) was higher than for 65–75 year olds. As will be discussed further, higher COVID-19 mortality in this younger age group was determined by poorer pre-existing health due to socioeconomic deprivation, as well as increased risk of exposure.
Figure 5: Excess mortality by age, selected European countries, 2020
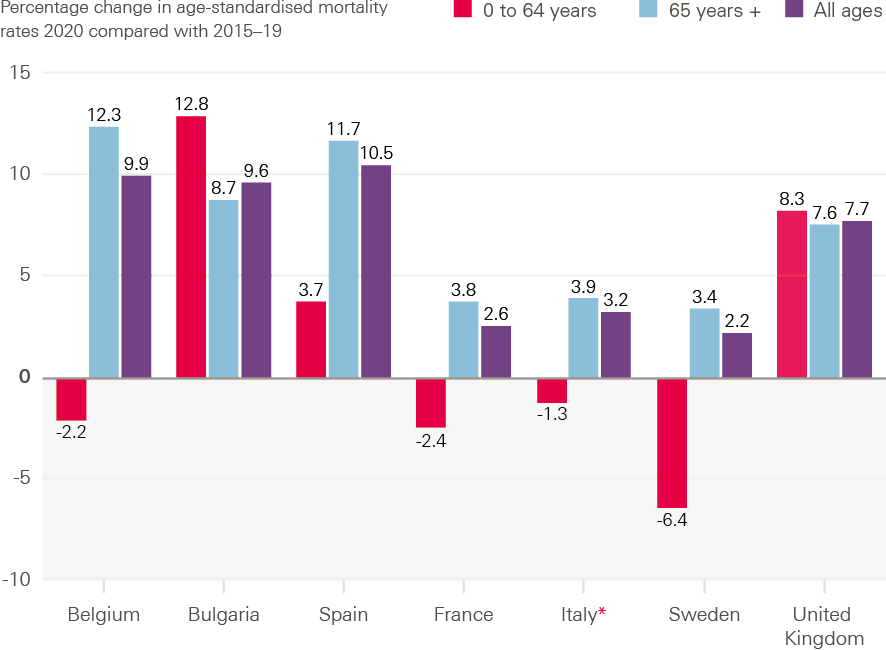
Source: ONS, Comparisons of all-cause mortality between European countries and regions: 2020.*
*Note: Latest data available for Italy is 30 October.
What made people more vulnerable to COVID-19 in the UK?
Underlying health and comorbidities are important factors in shaping outcomes from COVID-19, but they do not provide a complete picture of why the UK fared as it did. Other factors, such as someone’s sex, the type of work they do, where they live and their housing situation, also shaped people’s exposure and vulnerability to COVID-19.
Sex
In England and Wales 54% of COVID-19 deaths were among men. In Scotland and Northern Ireland deaths were evenly distributed among men and women., However a comparison of age-standardised rates of excess deaths shows that across 29 high income countries men were at greater risk of mortality. In England and Wales excess mortality rates were 1.5 times higher for men, 1.9 times higher in Scotland and 1.2 times higher for Northern Ireland.
“Across 29 high income countries men were at greater risk of mortality.”
Overall differences in mortality reflect that men are at a higher risk of more severe symptoms and worse outcomes. Men have higher prevalence of certain comorbidities (such as cardiovascular disease and diabetes). And there are hormonal differences too, with research showing that oestrogen can enhance the immune system while testosterone can suppress it.
Occupational risk factors
Occupation type
Among people aged 20–64, mortality differed among those working in different occupations. By the end of December 2020, the highest relative risk of mortality was for men and women working in elementary occupations, process, plant and machine operatives and in caring, leisure and other service occupations. The pattern of these COVID-19 mortality rates by occupation largely follows the pattern of all-cause mortality. This suggests that people in these occupations had poorer pre-existing health.
Figure 6 shows how risk of occupational exposure affected mortality. It compares first wave mortality rates before and after the first lockdown by occupation. Mortality rates proportionally reduced the most for people more likely to be able to work from home, or for those who tended to work in sectors that shut down.
People working in social care had a significantly higher rate of death compared with those working in health care by December 2020. For men, the death rate in health care was 44.9 per 100,000 people, rising to 79.1 per 100,000 for nurses, compared with 109.9 per 100,000 in social care. For women, the death rate for health care was 17.3 per 100,000, rising to 24.5 for nurses, and compared with 47.1 in social care.
Figure 6: Age standardised mortality rates for deaths related to COVID-19 among 20–64 year olds by occupation and sex, England and Wales, March to June 2020
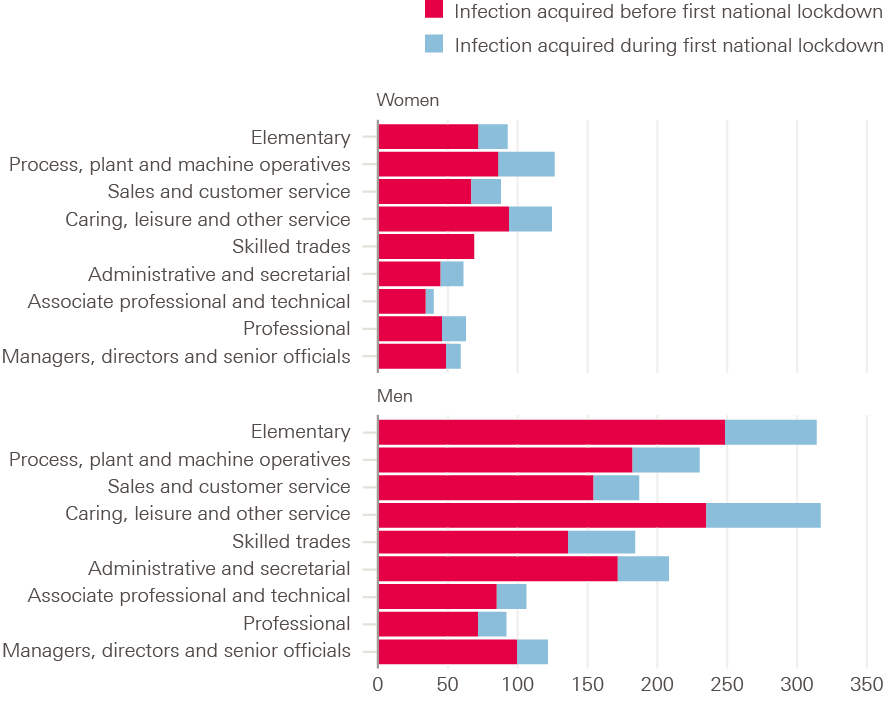
Source: ONS, Coronavirus (COVID-19) related deaths by occupation, before and during lockdown, England and Wales: deaths registered between 9 March and 30 June 2020.
A study from Scotland using national data on health care workers for the period 1 March to 6 June 2020 found that patient-facing workers were 3.3 times more likely to be admitted to hospital for COVID-19 than non-patient-facing workers, after adjusting for age, sex, ethnicity, deprivation and comorbidity. Household members of patient-facing workers were also 1.79 more likely to be admitted.
Figure 7 highlights the relationship between the ability to work from home and COVID-19 mortality for those younger than 65 across local areas in England during the second wave. Areas with low rates of homeworking and high mortality rates are shown in dark red; areas with high rates of homeworking and low mortality rates are shown in dark blue. The pattern suggests that those able to work from home were able to limit their exposure to the virus and subsequently their risk of mortality. Some areas, however, had high rates of homeworking and COVID-19 mortality among those younger than 65. In London and the south east in particular this partly reflects exposure to the alpha variant in late 2020. More rural areas and the south west tended to have low rates of both.
Figure 7: Mortality rates for deaths due to COVID-19 among those younger than 65 with share of workers that work from home, England and Wales, September 2020 to May 2021
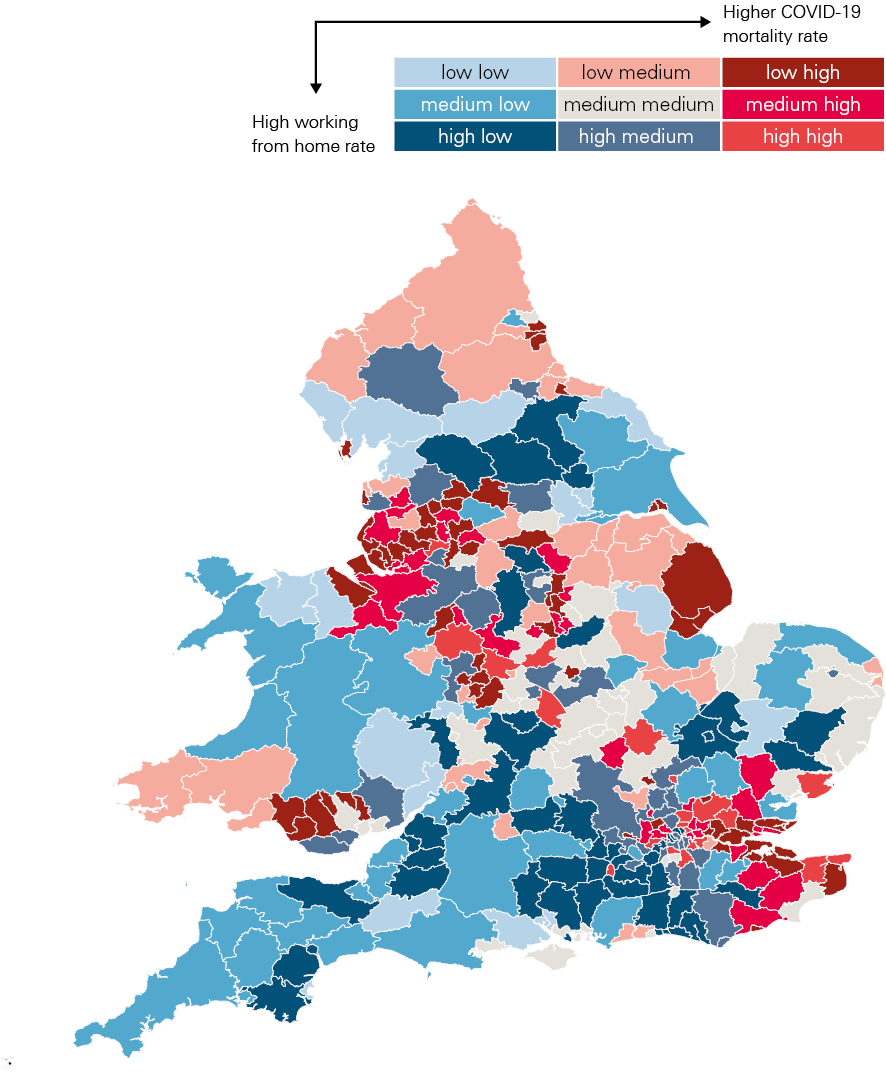
Source: ONS, ad hoc requested data on COVID-19 mortality by lower tier local authority and MSOA by age; Homeworking in the UK, work from home status.
Access to financial support
The UK government and devolved governments launched several schemes to support individuals and businesses through periods of economic closure and reduced activity. This included the Coronavirus Job Retention Scheme. By May 2021, over 11 million jobs had been furloughed, with people receiving financial support to replace their earnings while not being able to work.
For people going out to work, inadequate levels of sick pay led to people continuing to work even if unwell or exposed to COVID-19. UK statutory sick pay covers only a quarter of the average worker’s earnings and 2 million of the lowest paid workers are ineligible. Additional self-isolation payments of £500 were introduced but access to the scheme was limited – between September/November 2020 and 15 January 2021, only one-third of people applying for isolation payments were successful.
Financial incentives to keep working are also strong, with UK unemployment benefits replacing only 12% of average wages, compared with the 50–60% replacement offered by most other western European countries. Existing UK social security design is geared towards incentivising work rather than allowing a minimum standard of living for those out of work.
The CORSAIR study, which surveyed 53,880 people aged 16 and older between 2 March 2020 and 27 January 2021, found that adherence to self-isolation was low (20.2%). ‘Going to work’ was reported as one of the most common reasons for not self-isolating.
Access to PPE
Within organisational settings, containment measures such as social distancing and access to PPE played a role in reducing deaths among key workers. For example, in the first wave there were higher deaths among social care workers compared with health care workers. Social care workers also had lower access to PPE.
In November 2020 the National Audit Office found that of the total PPE items distributed, only 14% were given to social care providers – equal to 10% of the estimated need – compared with NHS trusts, which received 81% of the PPE distributed – equal to 80% of the estimated need. The fragmentation of the social care sector further exacerbated poor coordination and lack of access to PPE for staff especially during the first wave.
Deprivation
Before the pandemic, women living in England’s most socioeconomically deprived 10% of local areas were already expected to live 19 fewer years in good health than those in the least deprived 10%. COVID-19 mortality also follows a similar pattern in deaths by deprivation seen before the pandemic.
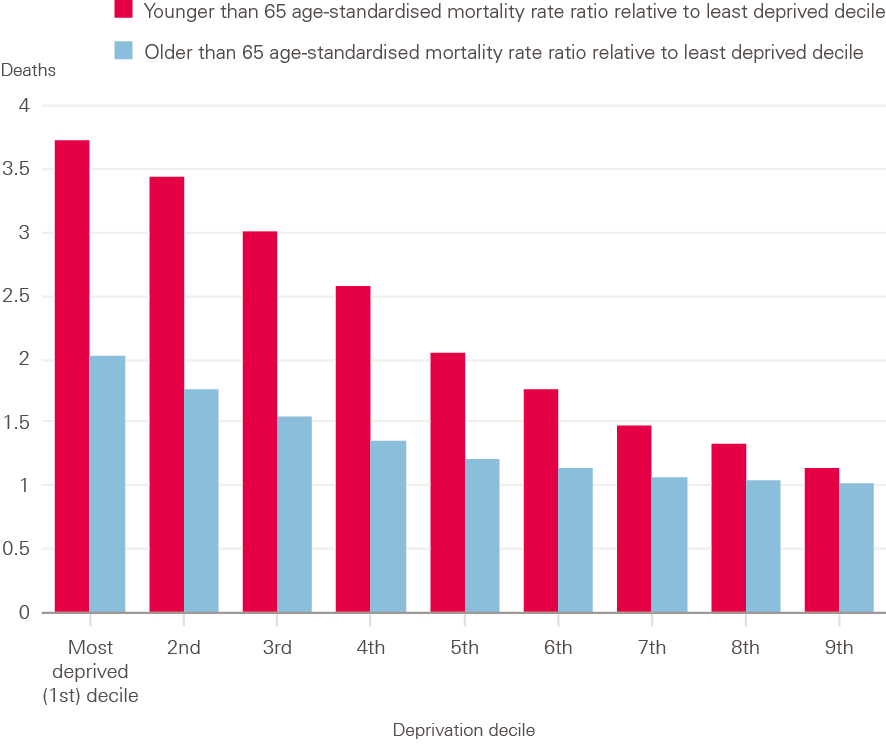
For people younger than 65, the COVID-19 mortality rate for the 10% living in the most deprived areas is almost four times (3.7) that of those in the least deprived areas (Figure 8). This partly reflects the poorer health of people living in more deprived areas. 50–69 year olds living in the 10% most deprived areas are more than twice as likely to have two or more long-term conditions, with a similar risk differential for diabetes and chronic lung conditions. Differences in occupation (for those in work) and housing conditions also increased risk of exposure to the virus in areas with greater deprivation.
Figure 8: Age-standardised mortality rates for deaths due to COVID-19, deprivation decile relative to the least deprived decile by age, England, March 2020 to May 2021
Source: ONS, ad hoc requested data on COVID-19 mortality by lower tier local authority and MSOA by age and MySociety IMD2019 Maps Local Authority MSOA-level file.
Housing
Going into the pandemic, one in three households in England (32% or 7.6 million households) had at least one major housing problem relating to overcrowding, affordability or poor-quality housing. These factors increase exposure to poor living conditions, reduce financial resilience, and exacerbated susceptibility to COVID-19 through overcrowding.
In 2019/20, the rate of overcrowding in the private and social rented sectors in England was at its highest recorded, with 9% of social renters and 7% of private renters living in overcrowded accommodation.
Household size increases the risk of COVID-19 infection and mortality, with one study finding that household size increased the odds of a positive test by 9%. Another study found that households with nine or more residents had more than five times the risk of deaths compared with single-occupant households.
Multigenerational households are also associated with higher rates of COVID-19 infection and mortality. For example, for women aged 65 and older, the risk of mortality if living in a multigenerational household with children was 1.2 times that of people living with another adult. Research also shows that the proportion of people aged 70 and older living with people of working age within a local authority explains some of the variation in COVID-19 cases across England – suggesting the risk of exposure was greater and that those of working age may not have had the space to self-isolate in their own homes.
The COVID-19 vaccination programme
The NHS vaccination programme has been a crucial intervention in suppressing COVID-19’s spread, saving lives and marking the beginnings of recovery in the UK. The initial rollout prioritised reducing mortality. As age is a key predictor of COVID-19 mortality, the focus was on making sure the oldest people were vaccinated first along with health and social care staff and those with underlying health conditions. By 30 April 2021, almost 35 million people in the UK had received their first dose and almost 15 million had received both doses.
Analysis by Public Health England found that the vaccination programme had prevented 33,000 hospitalisations among people aged 65 and older, and 11,700 deaths among people aged 60 and older in England to the end of April 2021.
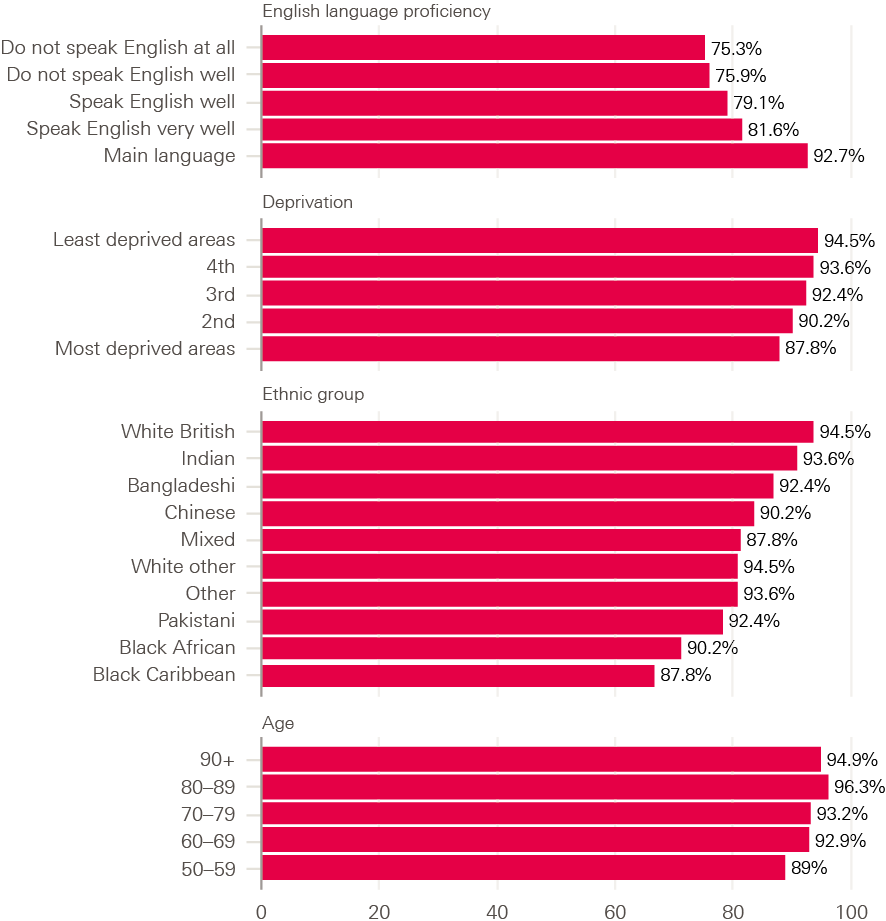
Nevertheless, there are emerging inequalities in access to and uptake of the vaccine. Figure 9 shows that by 12 April 2021, fewer people in socioeconomically deprived areas, people from ethnic minority groups, or those for whom English is not their main language have been vaccinated – despite the pandemic disproportionately affecting these groups. Only 88% of people aged 50 and older in the poorest areas had received a first dose, compared with 95% in the least deprived. Innovative approaches are being applied by local councils to close this gap, including providing information and training to community and faith leaders, interactive webinars and follow-up phone calls with people not taking up vaccinations.
Ensuring a fair recovery across all areas and groups will require concerted local and national efforts to mitigate these differences in vaccine access and uptake.
Figure 9: COVID-19 vaccination rates among people age 50 and older by socio-demographic group, England and Wales, 12 April 2021
Source: ONS, COVID-19 vaccination rates and odds ratios by socio-demographic group. Data cover those aged 50 and over up to 12 April 2021.
The pandemic’s implications for wider health and wellbeing
Summary
Health care services for non-COVID-19 conditions were reprioritised to manage increased demand from COVID-19. Childhood vaccinations and access to prescription medication were maintained, but reduced treatment of existing conditions has resulted in a backlog of unmet care need. People living with long-term conditions, disabled people and those shielding experienced reduced access to health services.
Access to social care services has declined despite an increasing need during the pandemic. This will have longer term effects on the health and wellbeing of those in need of services.
Mental health impacts from the pandemic are not uniform but worsened for many. One-fifth of the population had experienced a sustained increase in poor mental health by September 2020. Rates of anxiety and depression were particularly high during periods when the tightest social distancing restrictions were in place. Those facing financial hardship fared worse than others.
Domestic abuse and child protection risk increased during the first lockdown. Reported incidents of domestic abuse increased during the first wave of the pandemic. With children out of school, child safeguarding referrals reduced suggesting children were left exposed to harm.
Health risk behaviours, such as smoking and drinking alcohol, decreased during the first lockdown. However, this reduction masks an increase in these behaviours among heavy smokers and drinkers.
The measures brought in to suppress the spread of the virus have had wider implications for the health and wellbeing of people in the UK. These are less well understood and are likely to have longer term implications for the population’s health. They arise from the following main causes:
- reduced access to routine care services
- the consequences of lockdown on people’s mental health
- the consequences of lockdown on vulnerable groups
- changes in people’s health risk behaviours.
Access to health care services for non-COVID-19 conditions
Health services were reprioritised to manage the increased demand from COVID-19-related illness and to allow for new social distancing restrictions, which meant fewer patients could be treated. While this was a necessary precaution, in most sectors this has led to reduced treatment of existing conditions and a backlog of unmet care need.
Primary care
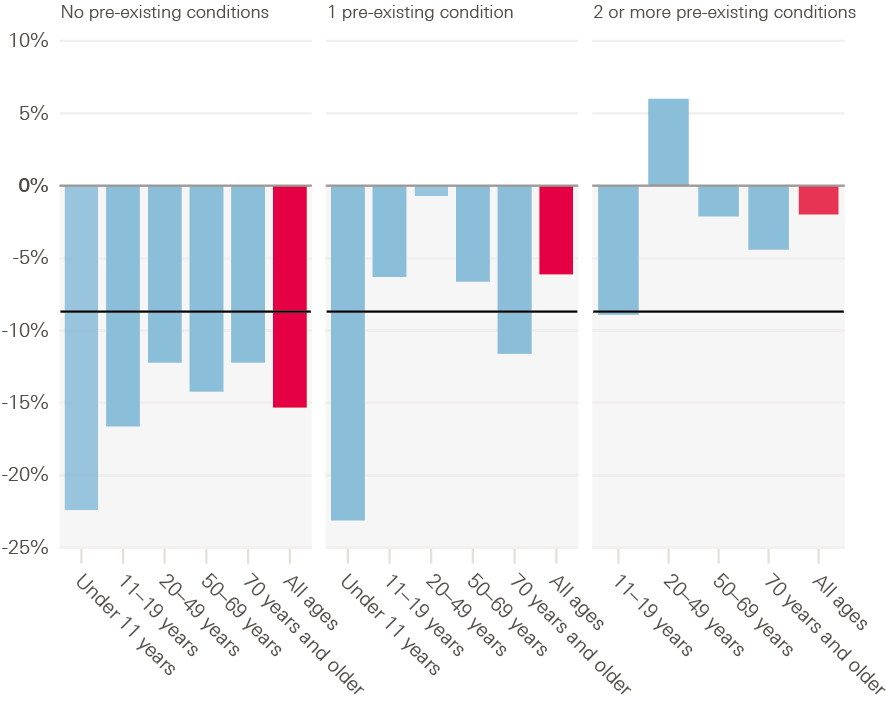
Despite the restrictions, in April 2020, 98% of people with a long-term condition who needed prescription medications were still able to obtain them. 73% who needed treatment via a GP still received the services they needed and 65% were able to see a pharmacist. Childhood immunisations appear to have held at pre-pandemic levels in England., Health Foundation analysis shows that all regions across England saw a 30% drop in GP consultations per patient between March and May 2020. This was despite the efforts to enable online and telephone consultations. An unintended consequence of this service shift has meant that access has been more challenging for those digitally excluded or people more reliant on face-to-face services., The greatest reduction in consultations has been for patients without a pre-existing condition, as shown in Figure 10 (15% versus 6% for those with one pre-existing condition and 2% for those with two or more pre-existing conditions).
It is not known what proportion of the missing consultations is a direct result of a reduction in need because of the pandemic; for example, fewer treatments following car accidents or a reduction in the prevalence of non-COVID-19 communicable disease (especially among younger patients). The size of the reduction in consultations, however, suggests that there will be a high number of people with undiagnosed conditions coming into contact with the health system at a more advanced stage of their condition.
The relative reduction in consultations has been similar across ethnic groups, apart from those from a Chinese ethnic background who saw larger reductions and previously had a below average consultation rate.
By October 2020, primary care consultations had recovered to pre-pandemic levels and remained so until the end of January 2021.
Figure 10: Percentage change in consultation rate in 2020 compared with 2019, by number of pre-existing conditions and age, England, 2020
Source: Clinical Practice Research Datalink (CPRD), Aurum database, Analysis from CPRD protocol number 20 143.
Note: Data for under 11 year olds with two or more pre-existing conditions are not available.
Referrals
At the beginning of the pandemic there was a substantial drop in 2-week wait for suspected cancer and urgent referrals. By autumn 2020, the rates of 2-week wait referrals and urgent referrals were broadly the same as in previous years. However, 2-week wait referrals did not increase enough to account for the substantial reduction during the first lockdown. Around 250,000 estimated 2-week wait referrals were ‘missing’ by the end of January 2021.
Routine referrals dropped by 74% during the first lockdown. This had not recovered by end of January 2021.
A&E visits
A&E visits began to fall 2 weeks before lockdown in March 2020 in England, falling to 48% compared with the same week in 2019 by the end of March. This recovered slightly to reach 64% of 2019 levels by mid-May. The fall in visits was greater for injury (54%) than for illness (32%). This is likely due to a combination of changes in NHS operations, in patient behaviour and in prevalence of conditions.
Those from the most deprived areas had 23.3% fewer emergency admissions in March to December 2020, compared with a 20.2% reduction for those in the least deprived areas. The IFS reported that the absolute gap in activity between local areas is substantially larger, since more deprived areas generally have more emergency admissions.
“Only 27% of people with long-term health conditions who needed NHS treatment in April 2020 received it, because of NHS cancellations.”
Elective care
During 2020, treatment activity fell in some specialties more than others. The largest impact was in trauma and orthopaedics, oral surgery and ear, nose and throat (ENT), with respective falls of 38%, 37% and 37% compared with 2019. In England, there were regional differences, with the largest fall in the north west (31%) and the smallest reduction in the south west (24%). The fall was greater in the most deprived areas (9,162 per 100,000 compared with 6,765 per 100,000 in the least deprived areas).
Survey data show that only 27% of people with long-term health conditions (such as cancer or cardiovascular disease) who needed NHS treatment in April 2020 received because of NHS cancellations. For other health conditions during this period, the NHS cancelled such treatment for more than two-thirds of people and around 5% of people cancelled treatment themselves.
There was a 29% decline in the number of patients referred to consultant-led elective care. In other words, there were 6 million ‘missing patients’ who did not seek treatment in 2020. If 75% of these ‘missing patients’ are referred for treatment as social distancing measures ease further, the waiting list for elective treatment could increase to 9.7 million by March 2024. By August 2020, almost three times more people had waited for more than 18 weeks as compared with August 2019.
Cancer
The number of patients seen for suspected cancer by a specialist dropped by 60% in April 2020 compared with 2019. Similarly, 37% fewer patients started treatment for cancer in May 2020. These numbers improved over the summer, narrowing to 8% and 10% respectively by October 2020.
Endoscopy activity from 23 March to 31 May 2020 was 12% of that between 6 January and 15 March 2020, which resulted in only 58% of the expected cancer cases being detected. From April to October 2020, over 3,500 fewer people had been diagnosed and treated for colorectal cancer in England than would have been expected. Survival from colorectal cancer is closely linked to the stage of disease, with over 90% of those diagnosed at stage I surviving 5 years compared with only 10% at stage IV.
Self-management of existing conditions
The fall in NHS treatments has adversely affected the health and wellbeing of people with existing conditions, as restrictions made their conditions harder to manage. For example:
- Diabetes (affected 3.9 million people in UK in 2019) – some adults with diabetes reported that their confidence to self-manage their condition fell during the summer (between 24 April and 31 August 2020), particularly their mental wellbeing (37%), as well as their physical activity (32%), eating patterns (29.6%) and ability to maintain a healthy weight (27.1%).
- Eating disorders (affected 700,000 people in UK in 2019, 90% of whom are women) – between June and July 2020, 83.1% of adults with an eating disorder reported a worsening of symptoms.
- Epilepsy (affected 600,000 people in the UK in 2010) – in June 2020, one in three young people with epilepsy reported that their seizures had increased during the pandemic and the majority reported that their sleep, mood and levels of physical activity had deteriorated.
Shielding population
Due to particularly high case numbers, the UK government advised 2.2 million of the most clinically vulnerable people to shield. Early data from NHS Digital shows that by mid-April, the drop in emergency admissions for shielding patients in England was greater than that for the general population (46% versus 33%). By July 2020, more than one in three of the shielding population had reduced access to care. Outpatient attendance for this group had fallen by 43% and elective admissions by 51%.
Perinatal and antenatal care
Women saw disruptions to perinatal and antenatal care. Scans became less frequent at the beginning of the pandemic and women reported difficulties discussing sensitive issues virtually and fears of further burdening the health system. Initial restrictions meant many women gave birth without a birthing partner and even once this changed there were still limitations on how long they could stay to support mothers. In Northern Ireland travel restrictions meant that women could not travel to England to access abortions.
Access to social care services
The pandemic has had a profound impact on social care services in England. Against a backdrop of pre-existing problems, such as chronic underfunding, workforce issues and system fragmentation, COVID-19 has made some of these challenges worse.
Analysis by the Health Foundation has found that despite an increase in care needs during the pandemic, fewer people have accessed local authority-funded long-term care than before the pandemic. In September 2020, 800 fewer younger adults and 12,150 fewer older people were supported in residential and nursing care than in March, a decrease of 2.6% and 10.5% respectively. This unmet need for care is occurring at the same time as an increase in unpaid care.
The COVID-19 impacts on care home residents and staff in terms of mortality, infection risk and access to PPE are covered in Section 5.
Mental health impacts of the pandemic
The mental health impacts of the pandemic have been mixed. For many, initial declines in mental health during periods of lockdown subsequently improved. A significant cohort have experienced a reduction in mental health, posing a potential longer term risk to the nation’s health.
Analysis from the ONS showed that around 21% of adults experienced some form of depression in early 2021 (27 January to 7 March), more than double that observed before the COVID-19 pandemic (10%). By March 2021, anxiety and depression had returned to levels seen during the lockdown easing in summer 2020.
However, one-fifth of the population experienced a sustained period of poor mental health relative to their previous levels by September 2020. By January 2021 around a quarter of working age people had experienced a new mental health problem during the pandemic. Diagnoses of self-harm, depression and anxiety and first anti-depressant prescribing decreased substantially in April across England, Wales, Scotland and Northern Ireland. In England, the rates returned to expected levels in September but remained about a third lower than expected in the other nations. The evidence suggests that access to mental health care declined with implications for individuals, health care services and for society as a whole.
Who has been disproportionately affected by worsening mental health?
Analysis of two longitudinal studies (the Avon Longitudinal Study of Parents and Children and the Generation Scotland: Scottish Family Health Study) found that in April–May 2020 those with financial problems, lower educational attainment, lower incomes or living in a more deprived area had disproportionately high rates of anxiety and depression.
The ONS also found that during 27 January–7 March 2021 a higher proportion of adults renting their home experienced some form of depression (31%) compared with adults who own their home outright (13%). Almost 3 in 10 (28%) adults living in the most deprived areas of England experienced depressive symptoms, compared with just under 2 in 10 (17%) living in the least deprived.
The pandemic is compounding mental health and economic hardship. Those experiencing income loss, loss of pay or with minimal safety net have been more likely to report poorer mental health. In January 2021, 43% of unemployed people had poor mental health. This was greater than for people in employment (27%) and for people on furlough (34%). This suggests that furloughing has provided some protection for people’s mental health.
Self-reported declines in mental wellbeing were twice as high for women as men. This is likely due to differences in caring responsibilities, social engagement and health behaviours. Women were more likely to spend longer doing housework and home schooling, alongside facing fears of redundancy and greater feelings of loneliness., When home schooling returned in January 2021 there was a significant increase in psychological distress among mothers, higher than in earlier waves, and compared with younger people during this period.
“Young people and disabled people experienced worse mental health outcomes compared with the general population.”
Young people and disabled people experienced worse mental health outcomes compared with the general population. The outcomes for these groups are explored further in Section 5.
Domestic abuse and child protection
For some people, having to stay at home increased the risk of experiencing domestic violence and abuse.
Analysis of domestic abuse cases held by the Metropolitan Police between 23 March 2020 and 14 June 2020 shows that abuse by current partners and family members had increased by 8.5% and 16.4% respectively, while abuse by ex-partners had declined by 9.4%.
Survivors reported escalating abuse during the first lockdown. Almost two-thirds (61.3%) of respondents to one survey said the abuse they were experiencing had worsened during lockdown; 54.8% said they had felt more afraid since the start of lockdown and 71.7% reported that their abuser had more control over their life.
Calls for help have remained high during both waves. Refuge reported an average 60% increase in monthly calls to their helpline between April 2020 and February 2021 compared with the start of 2020. 72% of these calls were from women directly experiencing domestic abuse.
Similarly, orders to stay at home have increased the risk to children experiencing violence and abuse at home. The NSPCC recorded a 53% increase in monthly average calls to their helpline between April and December 2020. The number of calls peaked in November 2020.
Research also suggests that school closures have resulted in fewer safeguarding referrals, indicating that children and young people had reduced opportunities to ask for help and no safe places where they could disclose. One study found a 37% decrease in referrals for child protection medical examinations between February and June 2020 compared with the same period in 2019.
Health risk behaviours
On average, health risk behaviours such as smoking and drinking alcohol decreased during the first lockdown. The percentage of adults smoking reduced from 14% pre-pandemic (in 2018/19) to 11% in April 2020. This reduction persisted and was still 11% in January 2021.
The same was true for drinking, with a slight decrease in the average number of units consumed per week – from 14.9 to 13.4 between March and June 2020.
However, this average reduction in smoking and alcohol consumption masks an increase in these behaviours among heavy smokers and drinkers. Lighter smokers were more likely to quit during the first wave, but in people who smoked more than 20 cigarettes a day there was no change.
By September 2020, 8.5 million people’s drinking levels were considered high risk, compared with 4.8 million in February 2020. There was also a 20% increase in alcohol-specific deaths in 2020 compared with 2019, the increase occurring between April and December, with deaths 28% higher in the fourth quarter of 2020 compared with a year earlier.
Analysis by Sport England, for ages 16 and older, found that physical activity levels declined during the early stages of the pandemic where there were just over 3 million fewer active adults (doing 150+ minutes a week of physical activity). As restrictions eased these declines in physical activity improved but did not recover to pre-pandemic levels.
Changes in the wider determinants of health
Summary
Relationships between friends, families and communities changed with stay at home restrictions in place. Many people reported feeling closer to family and their local community, but less connected to friends and other relatives. Loneliness increased over the pandemic. Those living alone, those with poorer underlying health or in rented accommodation were more likely to report higher levels of loneliness.
The closure of schools and reduced access to early years settings led to lost learning and development. Children from more disadvantaged backgrounds experienced higher levels of learning loss than their peers. A lack of social participation affected young people’s mental health and wellbeing.
The UK government launched unprecedented support to mitigate impacts on income and employment, including the Coronavirus Job Retention Scheme and the £20 uplift to Universal Credit. Despite these measures, people in shutdown sectors, those from deprived backgrounds, young people and the self-employed remained among those worst affected by the economic shock.
Challenges in housing security and homelessness were initially met with positive government measures. This included the introduction of mortgage holidays, the halting of evictions and schemes to house homeless people. Yet many families still struggled with housing payments, with an extra 450,000 families in rental arrears by January 2021 and 400,000 at risk of eviction in May 2021.
The greatest influences on health are the factors that shape the conditions in which we are born, grow, live, work and age. Quality of work, housing, education, communities and family all impact on people’s health. The pandemic and the measures taken in response have had direct effects on these wider determinants of health.
Despite concerted and unprecedented measures to protect lives and livelihoods, there are short and long-term implications for the health of the population due to the effect of restrictions on families, communities, the economy, education and housing.
Friends, family and community
Positive relationships and feelings of connectedness contribute to good health and wellbeing. This was inevitably affected by the pandemic, with the scale of the response leading to radical changes in our day-to-day lives. Restrictions during the first wave limited people’s social contact with others outside of their own households and 51% felt less connected to friends and colleagues. In contrast, 47% reported feeling more connected to family and 45% more connected to neighbours.
“47% of people reported feeling more connected to family and 45% more connected to neighbours [during the first wave].”
Loneliness increased in Great Britain between spring 2020 and February 2021. Data from the ONS show that working-age adults living alone were more likely to report loneliness. Those in ‘bad’ or ‘very bad’ health, those in rented accommodation, or who were either single, divorced or separated also reported higher levels of loneliness.
During the first wave, many local communities came together to support each other. By May 2020, there were 2,000 new local support groups on the Mutual Aid website and more than 5,000 neighbourhood-based Mutual Aid groups established to provide support for residents of local communities., More than 750,000 NHS volunteers signed up to help support vulnerable people.
This increase in community spirit was not experienced universally. People with lower levels of education and members of certain ethnic minority communities experienced a greater decline in perceptions of neighbourhood cohesion than their less disadvantaged counterparts. For some vulnerable groups, including people living in poverty or with pre-existing mental and physical health conditions, social support was persistently lower – by about 10–15% – than for those from wealthier backgrounds, or without physical or mental health conditions.
For the majority, feelings of neighbourhood cohesion were mirrored at the beginning of the pandemic by an increased sense of national unity. However, this does not seem to have been sustained. In April 2020, 57% of people thought that Britain would be more united than before once recovered from the pandemic, but by June 2020 this figure had fallen to 28%.
Unpaid carers
Greater responsibility for unpaid care has previously been linked to poorer mental health and greater risk of some physical health conditions., , ,
The number of people caring for older, disabled or seriously ill relatives and friends almost doubled during the pandemic from 17% of the population in 2018–20 to 32% in January 2021. By October 2020, unpaid carers were reporting increases in caring activity but reduced access to support. Many reported lower wellbeing, financial difficulties such as greater reliance on foodbanks, and lack of respite opportunities., , , ,
Carers are more likely to have poor health with over 60% of people providing over 20 hours of care a week having two or more long-term conditions. During the pandemic, over 20% have been waiting for NHS treatment.
Early years
Early years services have profound and lifelong effects on many aspects of health and wellbeing because they support social and emotional development and contribute to school readiness. Early years settings are particularly important for more disadvantaged children, helping to prevent gaps opening up in development levels at this early stage.
Before the pandemic, 68% of parents with children aged 2–4 years reported accessing formal early education or childcare. During the first lockdown this dropped to just 7% and by June 2020 the figure was still below 20%.
During the second wave, families were accessing early years settings more often but not at pre-pandemic levels. In February 2021, early years providers in England and Wales reported that attendance was still 28% lower than in the previous year. In England almost half reported lower take up of government-funded childcare entitlements.
Ofsted found that over half of early years providers felt that children’s personal, social and emotional development had fallen behind during the first lockdown. Almost half (45%) of parents reported a negative impact on their child’s social and emotional development, and 20% felt their child’s language and physical development was negatively affected.
Education
Government restrictions and lockdowns led to school closures, with most children and young people spending almost 60% less time in school by Easter 2021, with corresponding impacts on participation in learning and increased learning loss.,
There was some recovery in the autumn term when schools reopened and increased online provision in January 2021. But by the end of the 2020/21 spring term, primary school children had lost between 2 and 2.3 months of reading progress and between 3.1 and 3.6 months of progress in maths. Secondary school pupils also experienced similar levels of learning loss for reading, amounting to 1.6 and 2 months respectively for years 8 and 9.
The disruption of the pandemic has been greater for some children than others. School-aged children who are eligible for free school meals, have lower-educated parents or are in single-parent families spent less time on home learning than peers. In secondary education, schools with high rates of eligibility for free school meals had higher levels of learning loss than schools with lower rates (2.2 months versus 1.5 months) by autumn 2020.
Box 3: Digital exclusion
The pandemic transformed many day-to-day activities by accelerating people’s reliance on technology. Social distancing policies meant people having to use the internet to access vital services, such as financial, housing, health and social services. Internet access has been necessary to maintain connections with friends and family, to learn and work remotely, and to pursue exercise, faith, cultural and social activities.
This inadvertent and rapid shift in infrastructure widened inequalities for people digitally excluded: those lacking access, skills or confidence to use the internet. Before the pandemic, around 10% of the population had not used the internet in the previous 3 months or more. A considerable proportion of the UK population – 9 million people – is unable to use the internet independently.
Around 53% of the ‘offline population’ may lack the disposable income to afford an average monthly broadband bill of £30–35. The Good Things Foundation reports that certain groups – disabled people, older people, people on low incomes and those living in rural areas – are disproportionately likely to experience digital exclusion. These groups are also likely to have faced worse socioeconomic outcomes, showing how digital exclusion widens existing inequalities.
For example, digital exclusion has affected education and employment. Around one in five children did not have access to a suitable device for home learning during the pandemic, and 3% of school children were unable to do any schoolwork due to digital exclusion.
At the same time, many people with limited digital skills have embraced the internet during the pandemic. The proportion of homes without internet reduced from 11% in March 2020 to 6% in March 2021, while 75% of 50–70 year olds reported making video calls more often. There has also been a threefold increase in the number of 70 year olds registering for an online bank account.
In July 29% of teachers in the ‘most-deprived schools’ (as measured by the highest quintile of children on free school meals) reported that their children were 5 months or more behind, compared with only 5% of teachers in the least. Children from ethnic minority communities were also particularly disadvantaged by school closures. These are explored further in Section 5. The OECD estimates that learning loss equivalent to one-third of a school year can subsequently reduce earned income in later life by 3%. At an aggregate level the current cohort of years 1–12 losing just one-third of a year in effective learning has been estimated to reduce a country’s GDP by an average of 1.5% over the remainder of the 21st century. The negative consequences for individual and societal standard of living would be expected in turn to have negative consequences for health, particularly for those from more disadvantaged backgrounds. This risks widening future health inequalities.
Income and employment
Pandemic restrictions have had a profound effect on the economy, with the reduction in GDP in 2020 the greatest since current records began in the 1950s. Shutting down large parts of the economy has also reduced paid employment and as a result household incomes.,
The huge scale of financial support provided by government has helped to mitigate much of the impact of the pandemic on household finances, as have reduced outgoings for many families. This has left average income levels in 2020 similar to those in 2019. The Coronavirus Job Retention Scheme also has helped to prevent a large rise in unemployment and protected incomes by replacing a proportion of lost earnings. However, there is significant variation in how incomes and employment have been affected.
The duration of the economic shock has meant that by January 2021, 10% of the working population had been unemployed or on full furlough for 6 months or longer. The loss of status and routine that can arise from loss of employment, and reduction in income or disruption such as needing to move home, can increase stress and anxiety and cause depression. A sustained period without work can also cause a scarring effect on future employment chances and earning potential with longer term consequences on health. Increased debts to cover short-term income losses can also create future financial strain.
Box 4: Key government economic support through the pandemic
Job retention: From 1 March 2020 to 30 June 2021, the UK government paid 80% of employee wages, up to a cap of £2,500 a month, for businesses unable to operate fully due to COVID-19. From 1 July 2021 to 30 September 2021, this contribution is being reduced, with the scheme due to end in October 2021.
Self-employment income support: The government offered grants for self-employed people whose businesses were adversely affected. Eligibility required certain criteria: being a sole trader or a partner in a partnership, having been self-employed in the 2019/20 tax year, intending to continue trading in the 2020/21 tax year and being adversely affected by COVID-19.
Business loans: The government offered a range of loans to help businesses recover. The Bounce Back Loan Scheme enabled small and medium-sized businesses to borrow up to 25% of their turnover. And the COVID-19 Corporate Financing Facility involved the Bank of England buying short-term debt from eligible large businesses.
Universal Credit uplift: The government increased the standard allowance of Universal Credit by £20 a week in March 2020 for 1 year, with an equivalent increase to tax credits. In March 2021 it was announced the scheme would be extended until the end of September 2021.
Employment
In January 2021 an estimated 25% of the working age population were no longer working, on furlough or reduced earnings (of greater than 10%) compared with February 2020. Some groups were more affected than others including young and old people, those on low pay or in insecure work and the self-employed.
The biggest factor affecting someone’s likelihood of changes to their work status during the pandemic was the sector in which they worked. For example, 72% of people working in hospitality in February 2020 were out of work, furloughed or had a pay reduction of at least 10% or more in January 2021. About 19% of workers in this sector were no longer working compared with 7% across the general working population. Those who work in the sector are more likely to be younger and in low paid or insecure work.
“The biggest factor affecting someone’s likelihood of changes to their work status during the pandemic was the sector in which they worked.”
The share of self-employed people reporting they had stopped working has increased during the pandemic. Compared with February 2020, 9% were no longer working in May 2020, 11% in September 2020 and 14% in January 2021. For this group, earnings were also particularly affected – with 27% reporting they had lost more than 25% of earnings in January 2021 compared with February 2020. Poor targeting of the Self-Employed Income Support Scheme meant that 3 in 10 self-employed workers were not able to receive financial support despite their income decreasing.
As well as younger people (discussed further in Section 5), older people have experienced the most significant changes in employment during the pandemic. In January 2021, 15% of people aged 60–65 were no longer working compared with 7% of all working age people., Among those aged 50–65 working in February 2020, those self-employed (13%), in insecure work (18%), with the lowest weekly pay (14%) and those working in the hospitality sector (10%) were most likely to stop working in January 2021 (compared with 8% across all working people aged 50–65).
Household income
Despite the significant increase in support available, some families experienced large reductions in income – incomes fell by 40% on average for people making claims to Universal Credit. Across the income distribution reductions in family incomes were similar, with 25% of adults from the poorest fifth experiencing a reduction in income, compared with 23% in the wealthiest fifth by September 2020. This is partly because lower income families gained from the Universal Credit uplift, receive a smaller share of income from work overall, and because lower paid workers may live in families with various levels of income.
Taking account of changes in spending and income, 28% of adults saw their family finances deteriorate by September 2020, with poorer families experiencing a bigger hit to their overall finances. One-third of adults from the poorest fifth of families had their income fall further than their spend, compared with a quarter of those from the wealthiest fifth.
Many families have had to rely on savings or increase their debt to get by. However, the experience differed greatly among different sections of the community. The poorest fifth of households were twice as likely as the richest fifth to see their debts rise rather than fall during the crisis. Similarly, 50% of people with savings below £1,000 had to use their savings during the pandemic, compared with less than 20% of those with savings above £20,000.
Parents
During the first wave, within parent couples, more mothers than fathers reduced their working hours (21% versus 11% of fathers), quit or lost their job (16% versus 11% of fathers) and were furloughed (34% versus 30% of fathers). The risk of this differential effect is that mothers have had a larger reduction in earnings and employment to recover. If it is also harder to restore their economic position, there could be a prolonged widening in employment and pay outcomes between fathers and mothers.
Already likely to have lower income before the pandemic, almost half of single mothers reported struggling to make ends meet, compared with a third of mothers in couple households. In April 2020, 62% of single mothers reported struggling with going shopping for essentials due to childcare responsibilities, compared with half of mothers in a couple.
During the same month, one-third of mothers on a low income reported having nobody outside their household to help support them during the pandemic. This was higher than the average for all mothers and higher than the average for low-income fathers (29.4% and 25.6% respectively).
Disabled people, young people and ethnic minority communities were also particularly disadvantaged by the economic effects. The outcomes for these groups are explored further in Section 5.
Housing security and homelessness
Good-quality housing can contribute positively to people’s mental and physical health with recent research showing that in addition to quality and condition, the affordability and security of housing are key for ensuring health. Financial pressure can cause increased stress and anxiety and also increase the likelihood of overcrowding.
Due to the financial instability arising from the pandemic, the devolved governments introduced policies to protect families facing rental arrears and mortgage payments. From 26 March 2020 the Coronavirus Act 2020 protected tenants in England by requiring landlords to give extended notice of their intention to evict. Similar legislation was brought in to protect tenants in Wales, Scotland and Northern Ireland.
For homeowners struggling to pay their mortgages, the government announced the availability of a mortgage holiday in March 2020 (extended until the end of July 2021). Despite these schemes, 6% of mortgagors in the English Housing Survey reported being in arrears in July 2020, compared with 1% before the pandemic. Similarly, 7% of private renters were in arrears compared with 3% in arrears pre-pandemic. There was no significant change in arrears for social renters. By January 2021, the Resolution Foundation estimated that the pandemic had led to an extra 450,000 families falling behind on their housing costs. The Joseph Rowntree Foundation estimated that 400,000 renters were at risk of eviction in May 2021.
Rough sleeping
In March 2020 the UK government introduced its scheme ‘Everyone In’ to provide emergency accommodation for people experiencing homelessness. The intervention allowed homeless people to access essential services and enabled self-isolation, which helped to reduce COVID-19 infections and deaths among homeless populations compared with other countries internationally.
The National Audit Office found that by end of November 2020, 23,273 people had been moved into settled accommodation and 9,866 remained in emergency accommodation. However, local authorities and charities reported an ongoing increase in rough sleeping throughout the period.
Some groups disproportionately affected by the pandemic
Summary
Care home residents: Care home residents accounted for 40% of all COVID-19 deaths during the first wave. This was due to increased exposure to the virus, a high prevalence of underlying health conditions among this group and was compounded by a lack of access to PPE and a high turnover of social care staff due to insecure terms and conditions.
Disabled people: 6 out of 10 people who died with COVID-19 between January and November 2020 were disabled. Those with a learning disability were at even greater risk of dying than those with a physical disability. Many disabled people also experienced a decline in health due to cancellations of treatment, reduced access to health care, or a worsening of conditions from a drop in physical activity and were six times more likely to report feeling depressed than the general public (in June 2020).
Ethnic minority communities: People from ethnic minority communities are at higher risk of mortality due to COVID-19. During the first wave, black African men were 3.7 times more likely to die than white British men. During the second wave, Bangladeshi men were five times more likely than white men to die from COVID-19. People from ethnic minority communities also provided more hours of unpaid care, experienced higher levels of income loss and were twice as likely to have experienced food insecurity throughout the pandemic.
Young people: In April 2020, 2 million children experienced food insecurity. For many, school closures meant missed learning as well as the loss of important sources of emotional support. Levels of psychological distress among 18–24 year olds had almost doubled in April 2020 compared with 2017/18. Loss of employment was significantly higher among young people. Between March 2020 and February 2021, employment levels for those aged 16–24 had fallen by 9% compared with 0.4% for those aged 25–64. Young people from a black background were more likely to have reduced employment than their white peers.
Disproportionately affected groups summary
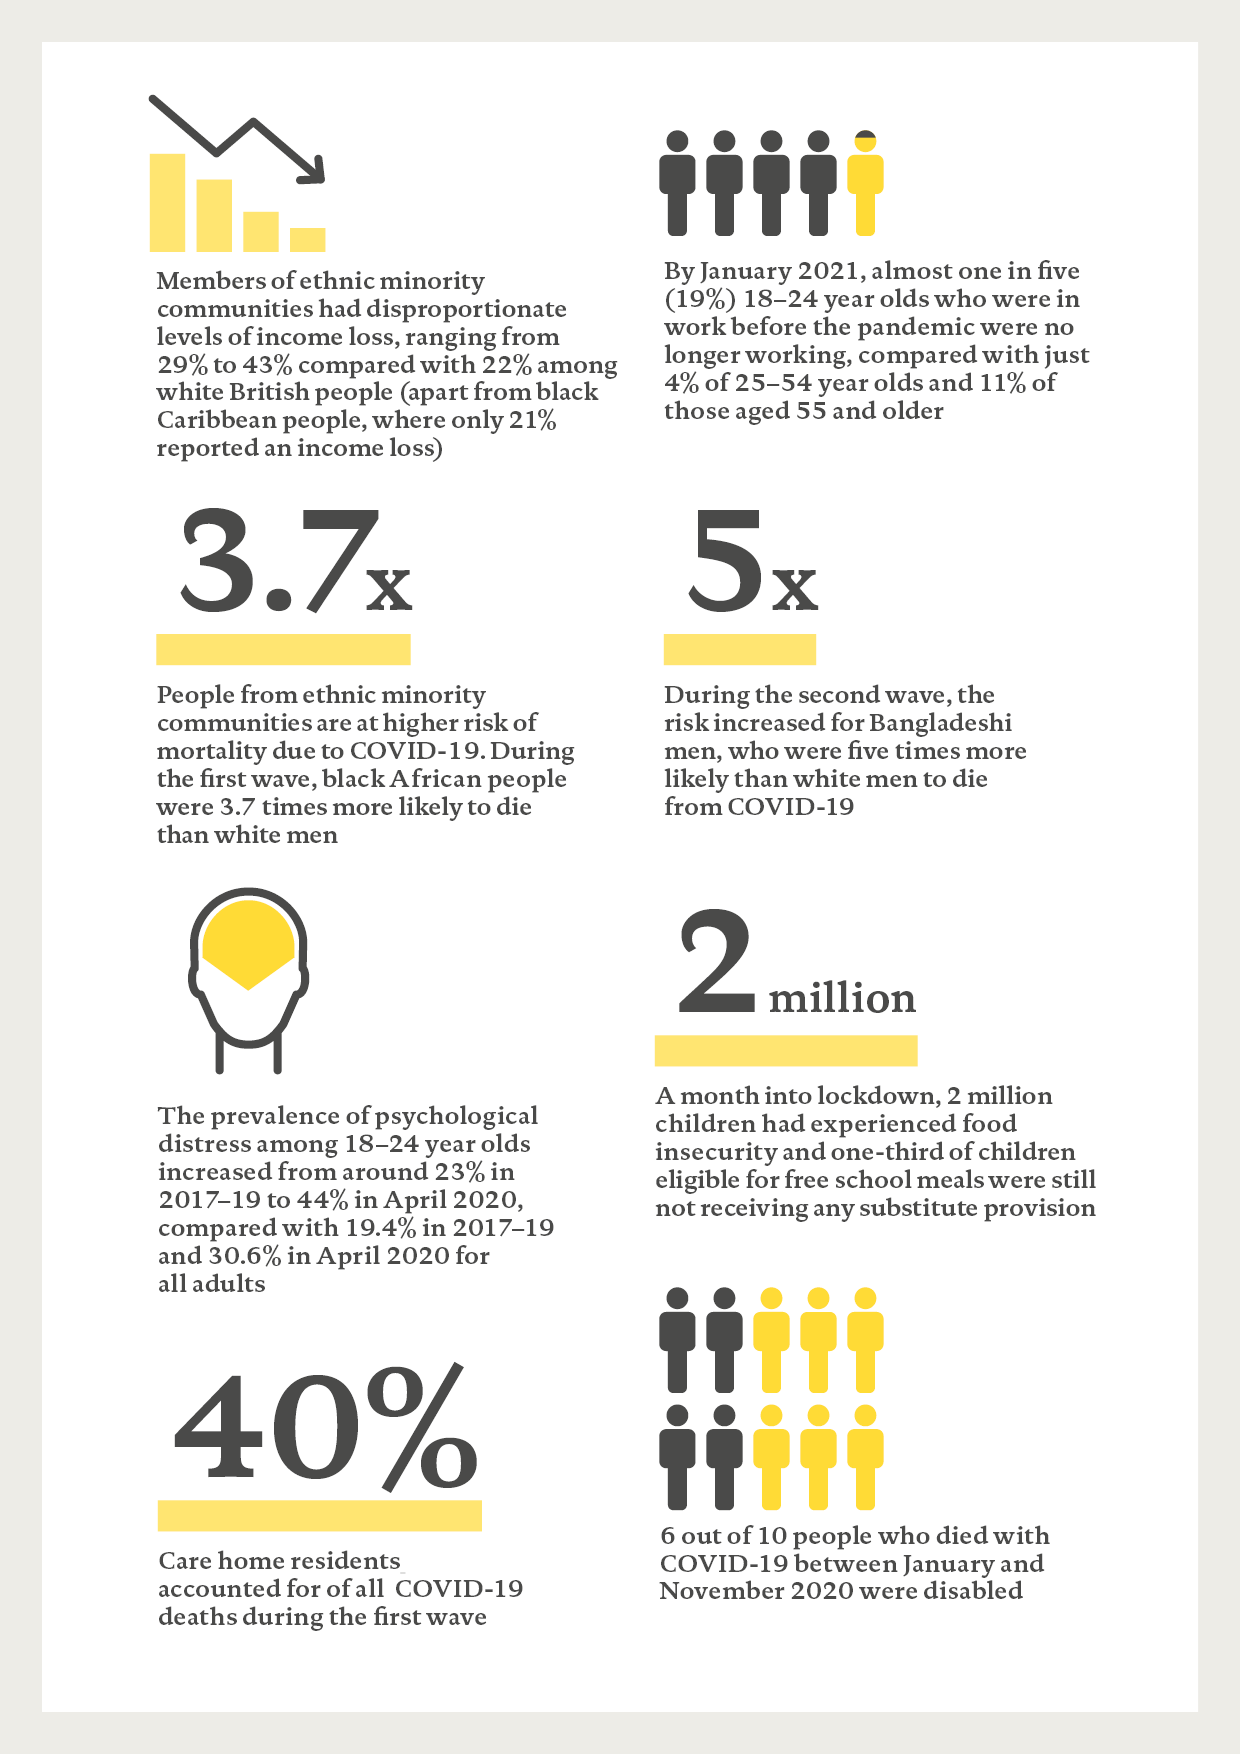
People’s experiences of the COVID-19 pandemic have varied widely. Some have faced disproportionate hardship and poorer health outcomes than others.
This section looks at how the pandemic has affected the lives of four groups whose experiences have been compounded by multiple factors:
- care home residents
- disabled people
- ethnic minority communities
- young people.
The section also covers the less documented experience of marginalised groups such as homeless communities, those facing sexual exploitation and people in prison.
Care home residents
COVID-19 impacts
Figure 11: Excess mortality in care homes, England and Wales, January 2020 to May 2021
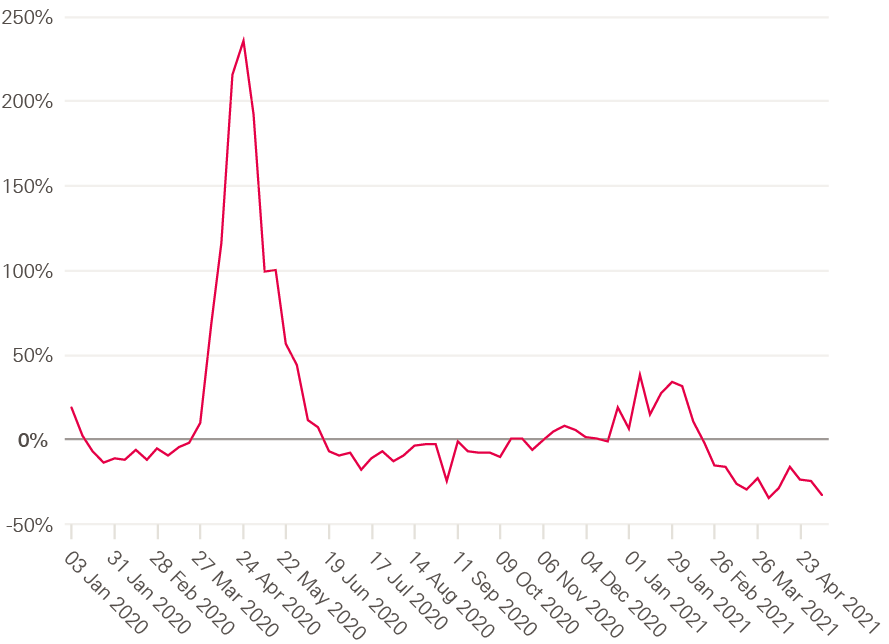
Source: Weekly provisional figures of care home resident deaths registered in England and Wales.
Care home residents accounted for 40% of all UK deaths attributed to COVID-19 during the first wave. The age and higher prevalence of underlying conditions among this group puts them at risk of worse outcomes once exposed to the virus: 90.4% of COVID-19-related deaths among care home residents in England and Wales had at least one pre-existing condition.
The same disproportionate impact was not seen during the second wave (as shown by Figure 11). This suggests that the biggest risk factor for this group was the initial exposure that resulted from the spread of the virus due to the timing of lockdown, discharge from hospital without tests, and the lack of protections such as availability and access to PPE.
Another factor that may have contributed is the difficulty of achieving effective infection control and isolation in this setting, where some residents require high levels of physical support for day-to-day activities. Infection control measures were introduced too slowly within social care, which led to further viral exposure and spread. Social care provision is highly fragmented, with many social care workers employed on insecure contracts with poorer financial support for those needing to self-isolate such as sick pay and access to isolation payments. This may have contributed to increased exposure, with more people coming into care homes due to a higher turnover of agency staff.
Health Foundation analysis in May 2020 found that care homes in different regions across England were affected differently. After accounting for care home beds in each region, care homes in northern England and London had more deaths relative to the number of care home beds than other areas. Another study shows that outbreaks in care homes had no relationship with deprivation. However, mortality in care homes did have a relationship with deprivation. This means that deprivation did not affect exposure but did affect severity of outcomes. This difference may be due to poorer underlying health among care home residents in more deprived areas.,
Wider health impacts
Access to health care
Between March and May 2020, emergency hospital admissions from care homes for conditions other than COVID-19 (including stroke and heart attack) decreased by 36%. Routine elective admissions for care home residents (including care such as cataract surgery, some cancer treatment and hip replacements) fell by 63%. Compared with the 56% reduction in routine admissions for the general population, this suggests that people living in care homes – who often have complex health needs and require high levels of hospital care – were particularly hard hit by reduced services with implications for their quality of life.
Wellbeing
To protect the health of older people, given their vulnerability, the UK government placed strict visiting restrictions on care homes. For an extended period, from March 2020 to March 2021, care home residents were generally not allowed to receive visitors leading to them feeling isolated and desperately missing their families., Some relatives were able to stay in touch with residents using the phone and digital technology. But for some less able to use technology effectively – particularly those with dementia – this was not always possible. For this reason, many care homes found innovative uses of technology to facilitate feelings of contact, such as using big screens, or recording and replaying the sound of relatives.
People living in care homes were also profoundly affected by the number of friends and other residents dying from COVID-19 around them. Infection control measures in care homes limited people’s ability to grieve effectively.
Disabled people
COVID-19 impacts
Disabled people have been among those most at risk of dying from COVID-19. In England between 24 January and 20 November 2020, 6 out of every 10 people who died with COVID-19 were disabled., The risk of death involving COVID-19 was 3.1 times greater for ‘more-disabled’ men compared with non-disabled men and 3.5 times greater for ‘more-disabled’ women than non-disabled women. This risk was even higher for people with a learning disability, who were 3.7 times more likely to die from COVID-19 than someone without a learning disability.
Figure 12: Age-standardised mortality rates for deaths related to COVID-19 among 30 to 100 year olds by self-rated disability status, England, January 2020 to November 2020
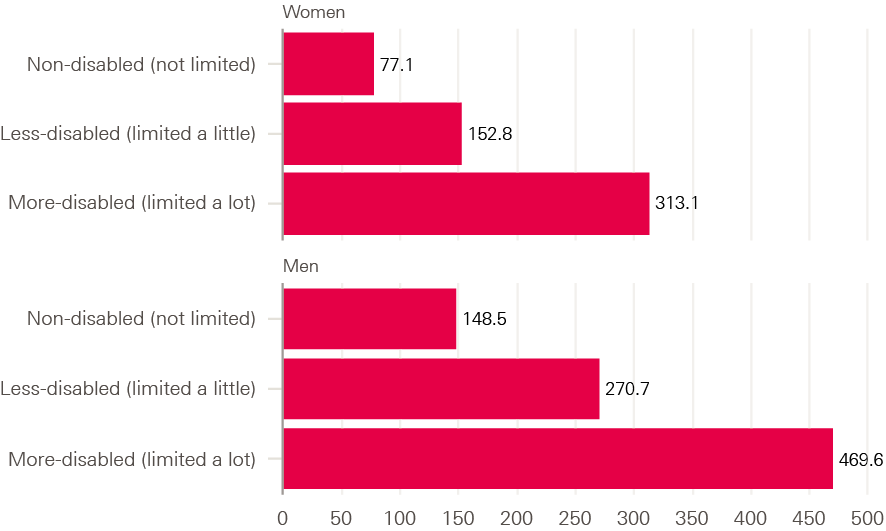
Source: ONS, Updated estimates of coronavirus (COVID-19) related deaths by disability status, England.
Many disabled people live in communal settings, placing them at increased risk of COVID-19 transmission and an increased risk of death. This risk was particularly stark for those with learning disabilities. One-third of those who died due to COVID-19 between 2 March and 9 June 2020 had been living in residential care.
Place of residence, socioeconomic and geographical circumstances, as well as pre-existing health conditions, all play a part in the increased risk experienced by disabled people. After adjusting for these, the risk reduced to 1.1 and 1.4 for more-disabled men and women respectively, and 1.7 for men and women with a learning disability. This unexplained difference in mortality risk is likely due to factors that affected exposure such as reliance on health and social care services placing disabled people at higher risk of exposure.
“In September 2020, 50% of disabled people reported experiencing reduced or no treatment, compared with 27% of non-disabled people.”
Access to PPE was an issue too. A survey of disabled people conducted in April 2020 found that many who needed PPE struggled to access it. This was particularly an issue for those who directly employ personal assistants and were responsible for providing protection for them.
Wider health impacts
Access to health care
Before the pandemic, studies had shown people living with severe disability were reporting worse access to health care, with the main barriers being transport, cost and long waiting lists. These prevailing inequalities in access persisted through the pandemic, increasing disabled people’s risk of worsening health outcomes.
Disabled people were more likely to experience reduced access to routine services. In September 2020, 50% of disabled people reported experiencing reduced or no treatment, compared with 27% of non-disabled people. By February 2021 there was a slight improvement, to 40% of disabled people versus 19% of non-disabled, but the disparity still remained.
Many of those whose planned treatments were cancelled struggled with pain management and people were often unable to access their usual physiotherapy or exercise activities.
Wellbeing
In February 2021, more disabled people than non-disabled people reported that the pandemic had adversely affected their health (35% compared with 12% for non-disabled people) and wellbeing (65% compared with 50%).
Many found it difficult to carry on with their usual activities and maintain physical activity during lockdown. Nearly a third (29%) of respondents to one survey said they were struggling to stay physically active. One-third of people with Parkinson’s reported that their health deteriorated and they experienced increased symptoms during lockdown, while one-third of people with multiple sclerosis felt that their symptoms worsened.
Mental health
In June 2020, disabled people were six times more likely to report moderate to severe depression. These unequal mental health impacts persisted through to March 2021. Families of children with disabilities reported that the pandemic had negatively affected their child’s health and wellbeing (93%), behaviour and emotions (87%), and mental health (82%).
Some disabled people reported that they felt pressured into agreeing to do not resuscitate (DNR) notices with little or no consultation.,
Figure 13: Wellbeing and effect of social restrictions by disability status, Great Britain, February 2021
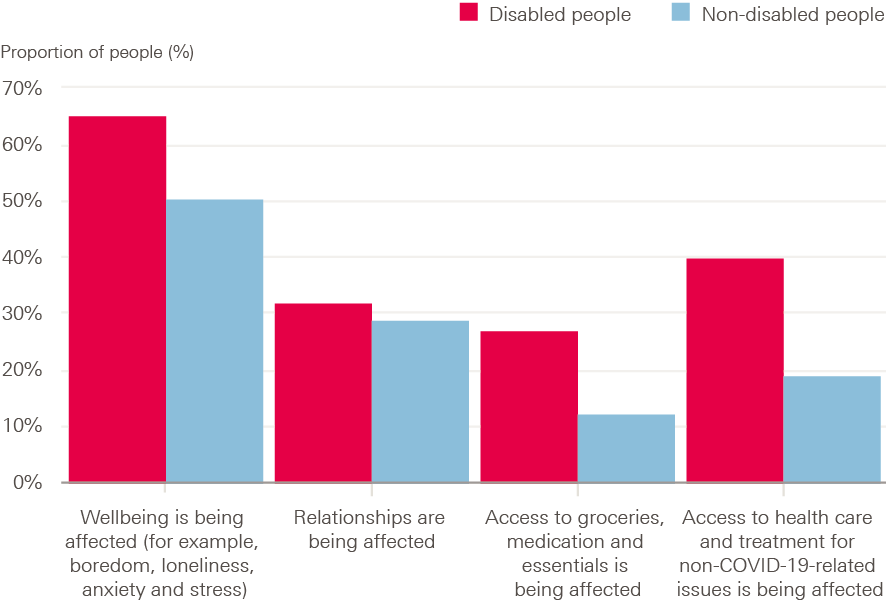
Source: ONS, Coronavirus and the social impacts on disabled people in Great Britain: February 2021.
Health and day-to-day living
Many disabled people reported difficulty obtaining essential items:, over 60% of respondents to one survey struggled to access food, medicine and necessities.
Disabled people were also more likely to experience food insecurity. In April 2020 over one-third (38%) of disabled mothers (compared with 17% of non-disabled mothers) said they were struggling to feed their children.
Lack of adjustments for disabled people’s needs and negative attitudes faced by those with sensory and invisible impairments added to difficulties leaving the house and shopping.
Longer term impacts
Access to government information and advice
Many disabled people felt that government information and guidance about COVID-19 restrictions was not specific enough and was not always disseminated in formats or languages that were accessible to all groups., More than three-quarters (78%) of deaf people found information shared by the government to be partly or completely inaccessible.
Income and employment
During the pandemic, the employment gap between disabled and non-disabled people persisted across the UK. By June 2020, 67% of disabled women and 65% of disabled men had their employment negatively affected by COVID-19, compared with 50% of women and 43% of men living without disability. This could have longer term implications for disabled people’s income and employment prospects, threatening financial resilience and the ability to live independently.
Ethnic minority communities
COVID-19 impacts
Ethnic minority communities have been among those most at risk of being exposed to and dying from COVID-19. During the first wave of the pandemic, age-standardised mortality rates for COVID-19-related deaths were more than three times higher for black African and Bangladeshi men and more than two times higher for black African and Bangladeshi women than their white counterparts (see Figure 14).
During the second wave (from 12 September 2020 onwards), the differences in COVID-19 mortality compared with the white British population increased for Bangladeshi and Pakistani people. Those from Bangladeshi ethnic backgrounds had the highest rates, 5 times and 4.1 times greater than for white British men and women respectively. Although the risk among people of black Caribbean and black African ethnicity still remained elevated in the second wave, the risk compared with white British people reduced compared with that in the first wave. ONS analysis shows that a large proportion of the difference in mortality observed between different ethnic groups is due to factors such as deprivation, occupation, living circumstances and pre-existing health.
Changes in the difference in mortality reported by ethnicity during the first and second waves require further examination. The improved outcomes for people from black backgrounds in the second wave suggests that the risk factors were modifiable – more likely to be the result of environmental rather than genetic factors for example – and can be addressed. Although a single factor cannot be identified to explain this improvement, it is a likely combined consequence of better access to public health messaging, the ability to self-isolate, better access to PPE and accessing health care services earlier. The increased mortality among those of Bangladeshi and Pakistani backgrounds needs careful further investigation to understand and ameliorate these inequalities.
Figure 14a: Risk of death involving COVID-19 relative to those of white ethnicity (men), England, 24 January 2020 to 31 March 2021
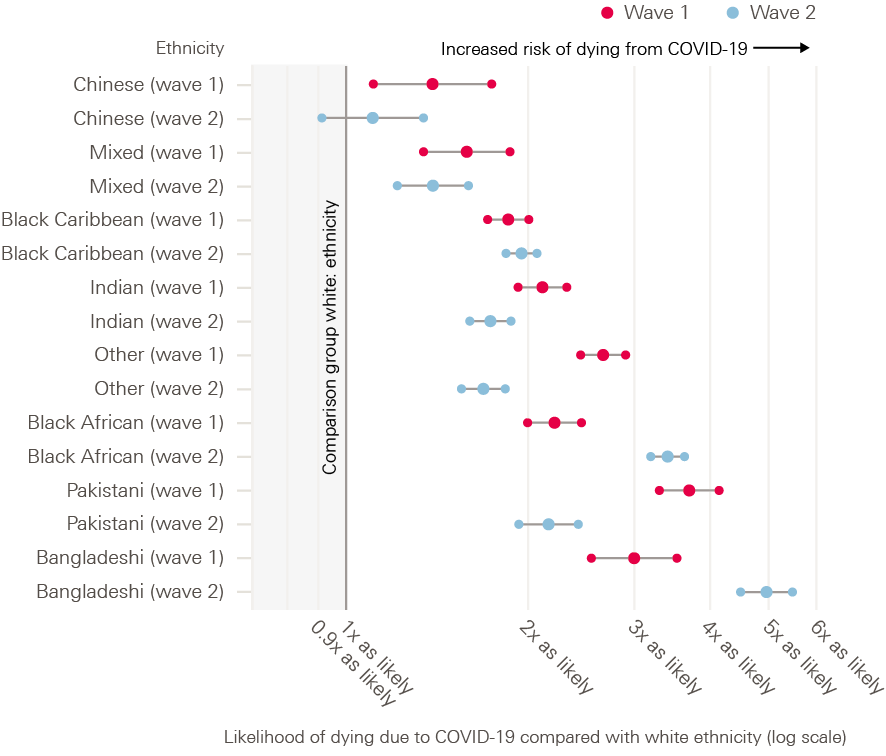
Source: ONS, Updating ethnic contrasts in deaths involving the coronavirus (COVID-19), England: 24 January 2020 to 31 March 2021.
One UK-based study showed that although obesity is an established risk factor for COVID-19 outcomes (such as increased hospitalisations and deaths) among all ethnic groups, the strength of association is strongest in those of black ethnicity. This means that people from black ethnic groups with obesity are at greater risk of being admitted to critical care, of being mechanically ventilated and of dying in hospital.
Wider evidence shows that the disproportionate number of COVID-19 hospitalisations and deaths among ethnic minority communities cannot be explained entirely by underlying health or comorbidities using existing data. Even after accounting for regional differences, residence type, socioeconomic factors and health measures such as pre-existing conditions, men of black African ethnicity had a 2.2 times higher risk of death from COVID-19 than those of white ethnicity in the first wave and 1.7 times higher in the second. Similarly, the risk for black African women 1.5 was times higher than for white women in the first wave and 1.2 times higher in the second.
Figure 14b: Risk of death involving COVID-19 relative to those of white ethnicity (women), England, 24 January 2020 to 31 March 2021
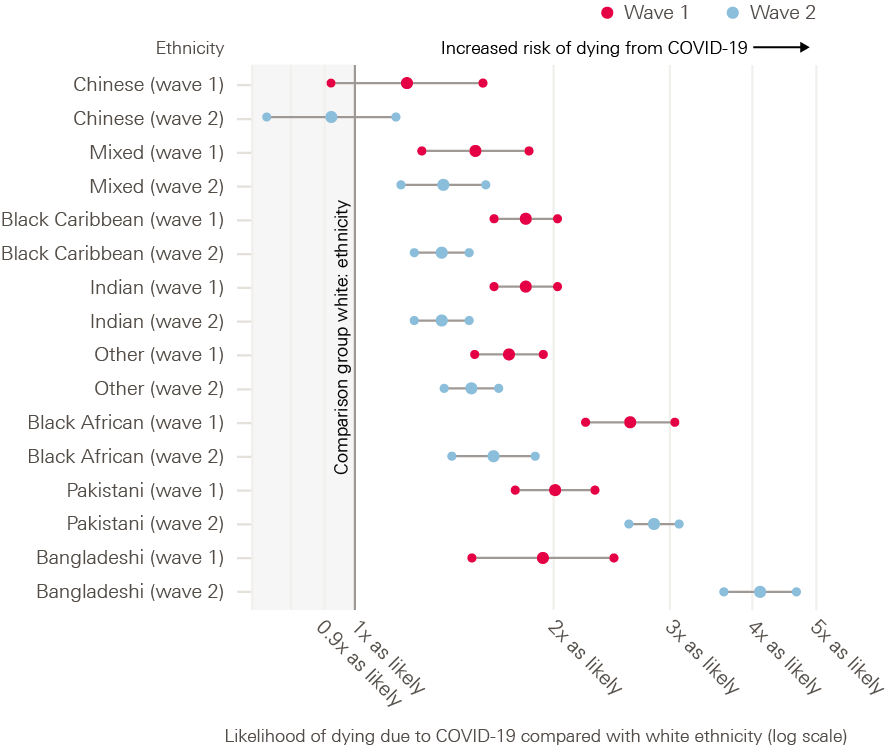
Source: ONS, Updating ethnic contrasts in deaths involving the coronavirus (COVID-19), England: 24 January 2020 to 31 March 2021.
Public Health England has reported some of these differences are due to racial discrimination, and that the associated stress has a negative effect on people’s long-term mental and physical health, as well as affecting COVID-19 exposure risk and outcomes.
A range of evidence details how people from ethnic minority communities have been more exposed to COVID-19, due to living and working conditions. Among minority ethnic communities, numbers were above the UK average for people:
- living in poor living environments (25% versus 8.6%)
- living in overcrowded housing (Bangladeshi 24%, Pakistani 18%, black African 16%, Arab 15%, mixed white and black African 14% and black Caribbean 8% versus 2% white British)
- unable to work from home in June 2020 (33% versus 27%)
- likely to be classed as key workers in June 2020 (28% versus 23%)
- likely to use public transport at least once a week in June 2020 (26% versus 10%)
- working in elementary occupations (black 16% versus 10% for all) and process, plant and machine operatives (Pakistani/Bangladeshi 15% versus 6%).
Survey data from June 2020 also reveals that discrimination may have reduced people’s ability to protect themselves from infection – for example, through having little choice but to do jobs with greater risk of exposure to COVID-19 or by not having fair access to PPE. A greater proportion of ethnic minority key workers (32%) said they were not given adequate PPE compared with white counterparts (20%). An even higher prevalence of inadequate PPE was reported within the following ethnic minority communities: Bangladeshi (50%), Pakistani (42%) and black African (41%).
Wider health impacts
Mental health
The gap in mental wellbeing between men from ethnic minority communities and white British men increased in April 2020. In particular, Bangladeshi, Pakistani and Indian men reported significantly greater increases in mental distress compared with men from other ethnic minority communities and those from white British backgrounds. Although women reported higher levels of and a higher increase in distress than men across ethnicities, the increase did not differ by ethnicity. The difference in mental wellbeing between men and women only increased among white British individuals.
“Employment worries negatively affected the mental health of 61% of people from ethnic minority communities, compared with 51% of white people.”
Existing inequalities, heightened in the context of the pandemic, contributed to deterioration in mental health. Almost one in three people from ethnic minority communities said problems with housing made their mental health worse. People from ethnic minority backgrounds were less likely to have good access to green spaces, with only 39% of adults saying that they lived close to green space, compared with 58% of those from white British backgrounds.
Employment worries also negatively affected the mental health of 61% of people from ethnic minority communities, compared with 51% of white people. Teachers reported that parental concerns over safety were highest in schools with higher proportions of pupils from ethnic minority communities.
Longer term impacts
Unpaid care
Ethnic minority communities are providing more hours of unpaid care, with 47% of those from black African backgrounds reporting providing unpaid care in winter 2020 compared with 32% across the population. A greater proportion of Indian, Pakistani, Bangladeshi and Caribbean ethnic groups reported providing more than 20 hours of care a week compared with white British and Irish groups.
Education
Pakistani and Bangladeshi children were overrepresented among those not receiving any distance teaching (12.1% versus 9.3% of those from white backgrounds) and among those who attended school during lockdown as children of key workers (7% versus 3%).
Income and financial support
Members of ethnic minority communities had greater levels of income loss, ranging from 29% to 43% compared with 22% among white British people (apart from black Caribbean people, where only 21% reported an income loss).
Just over two-thirds (69%) of people from ethnic minority communities had heard of the furlough scheme, dropping to 61% of people of Bangladeshi origin, compared with 88% of white people. Over half of ethnic minority women said that they were unsure where to turn for help as a result of the pandemic, compared with 18.7% of white respondents. Fewer than half of ethnic minority people were aware of the measure enabling people out of work due to the crisis to claim Universal Credit (44%, versus 62% of white people). In one survey, significantly more ethnic minority women and men reported that they had lost government financial support (43% and 48%) compared with white women and men (13% and 21%).
Food insecurity
People from ethnic minority communities were twice as likely to experience food insecurity throughout the pandemic (18.3% versus 9.6% from white backgrounds from March to August 2020, and 19.7% versus 8.8% from August to January 2021).
Young people
Young people are generally at least risk of poor health outcomes from COVID-19. But they have faced significant changes in education, employment and social support, impacting young people’s mental health and health behaviours. The pandemic will also have a bearing on their future health prospects.
Mental health and health risk behaviours
Mental health: The UKHLS found that the prevalence of psychological distress among 18–24 year olds increased from around 23% in 2017–19 to 44% in April 2020, compared with 19.4% in 2017–19 and 30.6% in April 2020 for all adults.
Drugs and alcohol: There were accounts of increases in health risk behaviours among young people, including increased use of drugs or alcohol. Nearly a third of young people were using alcohol or illegal drugs, with highest levels among 18–24 year olds. 2020 also saw the first increase in a decade in young adults aged 18 –24 starting to smoke for the first time.
Food security: There was great concern during the pandemic around food provision for those children and young people who would usually receive free school meals. Widespread media reports challenged the adequacy and nutritional value of the food parcels provided in their place. A month into lockdown, 2 million children had experienced food insecurity and one-third of children eligible for free school meals were still not receiving any substitute provision.
Exercise: Sport England found that in the 2019–20 summer term, less than half of boys and girls in years 9–11 engaged in 60 minutes of physical exercise each day, with almost 7% fewer boys engaging compared to the previous year, although there was an increase of 2.5% among girls. About 45% of those aged 18–29 were doing less exercise during the January 2021 lockdown than in the March 2020 lockdown, while only 15% were doing more.
Experiences with implications for future health
The Young people’s future health inquiry identified the following four ‘assets’ as important for the 12–24 age group in securing the foundations of future health:
- skills and qualifications
- emotional support
- personal connections
- financial and practical support.
The pandemic has adversely affected all four areas with implications for young people’s future health and prosperity.
Skills and qualifications
Engagement with and access to home education was extremely variable during periods of school closure and much harder for vulnerable groups to manage. In general, most children and young people spent fewer hours learning at home than they would have at school.
Although there was increased engagement in the second period of school closure from January 2021, the gap remained. This is because children from poor backgrounds received fewer active resources from schools, had less access to study space and were more likely to be less supported by their parents than those from wealthier households. Teachers reported some groups were less – sometimes significantly less – engaged in remote learning than their classmates. This included:
- pupils with limited access to IT or study space (81%)
- vulnerable pupils (62%)
- pupils with special educational needs and disabilities (58%)
- pupils eligible for Pupil Premium funding (52%), and
- young carers (48%).
Young people have expressed concern about the disruption to their education. The lockdown was particularly hard for those who missed exams and/or were transitioning to another phase of education. Only 17% of young people felt happy that exams had been cancelled and were more likely to feel uncertain (51%) or worried (18%).
Young people on vocational training were affected by the disruption on a practical level, but there has been less research on their transitions into work. In April 2020, only 39% of apprenticeships continued as normal, with 36% furloughed and 8% made redundant. Just under one-fifth (17%) of apprentices had their off-the-job learning suspended.
Emotional support
The experience of lockdown and spending more time at home was mixed for many young people. The majority (92%) in a YMCA survey from July 2020 said they enjoyed seeing more of their family. The majority (90%) also used digital communication to connect with people online.
However, lockdown and educational disruption took its toll. In April 2020, young people were three times more likely to report not enjoying day-to-day activities than they were in 2017–18. Young people reported decreased ability to concentrate, worse sleep, and loss of confidence. Young women (58%) reported lower moods than men (43%).
The situation was especially severe for young carers, with two-thirds (69%) reporting feeling less connected to others than they had before the pandemic. Many young people with mental health needs also reported feeling overwhelmed with heavy workloads when restarting school in September.
Financial and practical support
The Young people’s future health inquiry found a distinct difference between the outcomes of young people who had a safety net of financial and practical support and those who did not. This support was often from families but could come from the state or other sources.
Government action to mitigate some of the economic impacts of the pandemic has undoubtably helped a large proportion of young people. Many have also been able to fall back on the safety net provided by their families. However, different groups of young people have been affected in different ways.
Loss of employment: Between March 2020 and February 2021, employment levels for those aged 16–24 had fallen by 9% compared with 0.4% for those aged 25–64. While employment rates have reduced (to 51.9% at the end of 2020), unemployment (14.4%) and economic inactivity (6.2%) have increased alongside a decline in vacancies.
There have been stark differences in changes to employment among different ethnicities, widening inequalities that existed before the pandemic. The unemployment rate for young people aged 16–24 from black ethnic backgrounds rose 9% from 25% to 34% between March 2020 and January 2021 but only 3% for those from white backgrounds from 10% to 13%.
The Sutton Trust found that 79% of undergraduate students from working-class backgrounds and 76% of students from middle-class backgrounds were worried about gaining the skills and experience required for employment in February 2021. A Prince’s Trust survey found that one in five young people (21%) felt scared that their skills and training are no longer useful. Nearly a quarter (23%) said that retraining seemed pointless because ‘there are no jobs anyway’.
Coronavirus Job Retention Scheme: Young people are more likely to work in shutdown sectors such as hospitality and retail. This is reflected in the fact that 9% of young workers were furloughed, in comparison to 6% of all workers.,
“Between March 2020 and February 2021, employment levels for those aged 16–24 had fallen by 9% compared with 0.4% for those aged 25–64.”
The income security and broader certainty provided by furlough appears to have provided some mental health protection. More than a quarter (28%) of those furloughed reported poor mental health – comparable to those with no change in employment – in contrast to the 36% reporting poor mental health who had lost their job.
Housing: Young renters were no more likely to default on their rent than people in older age groups. However, 18–29 year olds were by far the most likely to have moved during the crisis. By May 2020, over 7% had moved compared with less than 2% across older age groups. This figure is partly explained by students moving from university (3% of the age group), leaving 4% moving for other reasons. This may be a result of some young people using the practical safety net provided by their families and moving back home.
There is likely to be a substantial number of young people in the private rental system who do not have this safety net and who are struggling to meet rent payments with reduced income. Private and social renters are now more than twice as likely as people with mortgages to have lost their jobs (8% of private renters and 7% of social renters, compared with 3% of homeowners).
Personal connections
The Young people’s future health inquiry described personal connections as whether young people had confidence in themselves, along with access to social networks or mentors able to offer them appropriate advice on navigating the adult world. These informal contacts and networks are more difficult to build in an online environment, with many of the usual routes to developing this social capital being less readily available during the pandemic.
Even when options were available for face-to-face contact between lockdowns, there was a reduction in uptake due to social distancing and concern about the virus. For example, in universities, participation in student societies fell from 54% in autumn 2019 to 39% in autumn 2020 and to 30% in January 2021.
Box 5: Experiences of homelessness, prison and sexual exploitation during the pandemic
The pandemic has made life harder for many people across the UK, including those in the criminal justice system, people experiencing homelessness and sexual exploitation prior to the pandemic.
In response to COVID-19, government and local authorities cooperated to move people experiencing homelessness into hotel or B&B accommodation (via the ‘Everyone In’ scheme). While this move was welcomed by many and presented opportunities to support people into permanent accommodation or employment, living in close proximity and sharing facilities made social distancing and isolating difficult. Groundswell, a homelessness charity, reported that 38% of London hostels had suspected COVID-19 cases, with 41% of unwell residents sharing bathrooms and 35% of affected hostels using communal dining rooms. The charity estimated the death rate for people living in London hostels to be 25% higher than among the general population.
For many migrants experiencing homelessness, COVID-19 brought the unprecedented experience of statutory support. In suspending all immigration-based eligibility criteria attached to welfare, the UK government provided – for the first time – a response to the crisis of migrant homelessness. Regardless of immigration status, people experiencing homelessness were given access to a private room, washing facilities, three meals a day, and – crucially for those previously ineligible for statutory support – engagement with a homelessness response service. However, despite the call to accommodate all homeless people, rough sleeping continued in London between April and June 2020 and 49% of those identified were non-UK nationals.,
People in prison and their families
At the beginning of the pandemic, there were widespread fears that prison populations would be impacted significantly by the virus. Prisons tend to be overcrowded, with many shared facilities, and prisoners are exposed to a large number of staff. Data up to early 2021 showed that people in prison experienced three times the death rate from COVID-19 than people of the same age and sex in the general population.
For prisoners, visits from friends and family are considered a lifeline: a protective factor for mental health and suicide and key to rehabilitation. However, for many people in prison during the pandemic these visits were not allowed. Restrictions on visits also impacted the right to family life of up to 17,000 children with mothers in prison. This prolonged separation is likely to have influenced these parent-child relationships and caused some degree of trauma for children and the families who support them.,
Prison restrictions also led to education, support visits, therapies and rehabilitation programmes being withdrawn. Research indicates that the loss of offender behaviour programmes caused significant stress for prisoners, in some cases disrupting sentence plans and hampering prospects of release.
The pandemic has worsened health and wellbeing among people experiencing complex challenges – not least by reducing already limited incomes, leaving people without basic supplies including food and clothing. For many vulnerable women, this has led to an increased risk of sexual exploitation.
Reports suggest an increase in the number of women using sex work to survive during the pandemic. Between March 2020 and July 2020, the national charity Changing Lives saw an 83% increase in women accessing its specialist support for people selling sex – driven by the need for food and rent, and to provide for children. It also saw a 62% rise in women saying they had experienced sexual violence during the same period.
With social distancing measures in place, much sex work moved away from the street and into private homes. This is more dangerous as the women are out of sight of services, harder to access and often alone. People new to sex work are often unaware of the risks they face or the support available.
† Disability was defined based on self-reported answers to the 2011 census question: ‘Are your day-to-day activities limited because of a health problem or disability which has lasted, or expected to last, at least 12 months?’ More-disabled people are those who responded ‘Yes, limited a lot’, whereas less-disabled people are those who responded ‘Yes, limited a little’.
‡ This is based on the living environment deprivation domain of the Index of Multiple Deprivation (IMD). This includes houses without central heating; houses that fail to meet the Decent Homes standard; poor air quality; road traffic accidents involving injury to pedestrians and cyclists.
§ This information was provided by the University of Portsmouth (Principal Investigator: Dr Simon Stewart) which is part of a larger study funded by the ESRC and UKRI.
¶ This information was provided by Chantal Edge as part of an evidence review commissioned by the Health Foundation.
** This information was provided by Nadine Smith who conducted interviews with workers at Changing Lives charity as part of research commissioned by the Health Foundation.
Public perceptions
Approach to engaging with the public
The pandemic has significantly enhanced a national conversation about the health of the nation, including the wider factors that influence health and how outcomes are experienced unequally by different groups. The pandemic has led to some of the widest and most sustained polling to track people’s changing attitudes., To inform this inquiry, the Health Foundation worked with consulting company Kantar Public to explore public attitudes to, and experiences of, health inequalities and the COVID-19 pandemic.
Engagement with members of the public took place through:
- A nationally representative survey comprising 1,228 interviews, undertaken during October and November 2020.
- A two-stage qualitative dialogue with 72 participants taking part in virtual workshops across five regions: Northern Ireland, Scotland, Wales, northern England and the Midlands, and the south east of England.
Views on government responses
Over the course of the research, public opinion on the government’s response to the pandemic seemed to shift. In October and November 2020, half the people surveyed felt that the UK government’s response to the pandemic was ‘fair’. But by the time of the workshops in February and March 2021, this had changed. This may reflect a shift in the public view of the pandemic over the Christmas period as the third round of lockdown restrictions were brought in across the country.
Where study participants lived also affected their perceptions of the government response. Some in the north of England felt that government decisions were London-centric and designed to protect the capital’s economy without enough consideration for other regions. In Wales and Scotland, the responses of devolved government were generally seen more positively.
Differential COVID-19 outcomes and impacts
At public workshops held in February and March 2021, participants were presented with statistics outlining the number of COVID-19 cases, hospitalisations and deaths. Many were shocked by the differential outcomes for older people, those from deprived areas and people from ethnic minority communities, but responses varied:
- Age: Differences by age were the easiest for people to understand as they found it intuitive that the COVID-19 mortality rate would be higher among older people.
- Deprivation: Most workshop participants generally understood why deprived areas might be worse affected by COVID-19 and assumed this was due to them having a greater population density and more social housing. 85% of survey participants identified the pandemic as having a greater negative impact on those in poorer areas of the UK.
- Ethnicity: While 71% of survey participants assumed ethnic minority groups had had worse outcomes from COVID-19 because of factors relating to their physical health, when presented with the data most were unsure what was affecting the mortality rate among these groups.
The public appetite for action
Participants were surprised by wider information presented about the extent of current inequalities in life expectancy and health life expectancy in the UK. They saw addressing health inequalities as an important part of the government’s role in recovery. In general, participants saw three areas of policy as being particularly important.
“Participants were concerned by the disruption to children and young people’s education and saw funding catch-up tuition as a vital short-term policy response.”
- Education: Participants were concerned by the disruption to children and young people’s education and saw funding catch-up tuition as a vital short-term policy response – especially for secondary school-aged children close to sitting exams. In the long term, workshop participants (more often, those without a university education themselves) were particularly interested in strengthening vocational alternatives to university. Some wanted to improve vocational training, which they often thought was more applicable to work contexts than degrees. Changing syllabuses to include more life skills, such as healthy eating and managing finances, was another popular long-term policy among participants.
- Income: This was seen by many participants as a way of empowering individuals to make choices about their own lives in order to improve their health. There was strong support for a short-term policy of providing food aid for people unable to cover food bills. There were mixed opinions on making some temporary measures permanent, such as raising the level of Universal Credit. Some felt this would disincentivise work and not guarantee a better quality of life if the recipients spent funds inappropriately. Others thought that current Universal Credit rates were unable to support a good quality of life and that increasing them was important.
- Work: Some participants felt that continuing the furlough scheme was vitally important in the short term to ensure that people unable to work still receive an income and some level of job security. However, some raised concerns about how this would be paid for. Other popular long-term policies focused on reducing or eliminating zero-hours contracts and raising the living wage.
Recovery: risks and opportunities
Summary
The pandemic has left people facing long delays in access to health care and poorer mental health. As well as the significant toll on people’s health, there are substantial financial implications of tackling the backlog of unmet need.
Further risks to people’s health may come from a decline in living conditions. Pandemic restrictions have led to reduced social activities, changing work conditions and loss of work and income for some. In addition, gaps in education due to school closures, and loss of work and income, are likely to have longer term implications for people’s health.
The UK entered the pandemic following a decade of stalling life expectancy. Factors such as the fragility of the welfare state and inequalities in jobs, housing and education have all contributed to declining health. These same factors also led to increased exposure to COVID-19.
The recovery presents an opportunity to ensure no one is left behind. Greater investment and government action to build economic and social resilience, harnessing the economic, social and political changes of the pandemic, could address these risks. While the effects of the pandemic present clear risks to people’s future health, these will only prevail if there is failure to act.
The pandemic has been a major assault on the health of the population and risks casting a long shadow on the nation’s future health. Good health is an asset – and a healthy society will be essential to a fair and lasting recovery.
This section reflects on conditions in the UK prior to the pandemic, how this has contributed to outcomes and explores the pandemic’s likely future consequences for health, highlighting the main risks and how these might be mitigated.
Risks to future health
Rising physical and mental ill health
The need to reprioritise resources within the health care system to deal with the pandemic has led to cancelled or postponed consultations, referrals and planned admissions. This has resulted in reduced diagnosis and management of new conditions as well as support for existing conditions.
Health Foundation analysis shows that there are 6 million ‘missing patients’ who did not seek treatment in 2020, suggesting poor health is going untreated and is likely to require more extensive care when people present at GPs or in hospitals. In cases of acute need, such as cancer care, where treatments have been delayed, there will be a higher number of avoidable deaths.
Government restrictions, although needed to limit the spread of the virus, have also led to higher prevalence of poor mental health with a sustained deterioration in mental health for one-fifth of the population by September 2020.
Long COVID has emerged as a new condition that is leading to disruptions in employment and a further reduction in quality of life. The duration and extent of this condition is yet to be understood.
Before the pandemic, the NHS and social care already required substantial investment to provide adequate services. In November 2020, Health Foundation analysis estimated that an additional £10bn will be needed in the next year to deal with the backlog of health care, the rising demand for mental health services and the service improvements set out in the NHS Long Term Plan.
Decline in the conditions needed for good health
The pandemic risks having a further impact on people’s longer term health through the decline in living conditions. This is being seen more immediately through the increases in poor mental health. However, the gaps in education due to school closures and remote learning, and the effects on work and income due to the economic shock, are likely to have longer term implications for health.
The loss of education during the pandemic risks widening the gap in future health outcomes in two ways. First, the cohort of children and young people who have missed periods of education could lag behind older cohorts who had finished education before the pandemic. Second, the loss of education has not fallen evenly. By autumn 2020 children from more disadvantaged backgrounds experienced a greater deterioration in their educational outcomes – 2.2 months of learning loss compared with 1.5 months – creating an inequality between children of the same age.
Government support measures have helped to reduce the scale of the economic shock people have experienced so far. Some people whose income reduced may see it rise once restrictions are lifted – but they will still have endured a sustained period of reduced resources.
In May 2021, 2.8 million fewer people were estimated to be in employment than prior to the pandemic. The Coronavirus Job Retention Scheme has prevented a significant rise in unemployment so far though once the scheme is phased out in the autumn, unemployment is expected to rise. For lower income families, assuming the Universal Credit uplift ends in September 2021, around 6 million families will experience a drop in income.
“In May 2021, 2.8 million fewer people were estimated to be in employment than prior to the pandemic.”
Unemployment is a key risk to health. Periods of unemployment are associated with poorer physical and mental health. This is due to the experience of not having work – lacking the status and structure it brings – as well as loss of income.
Income, and having other financial resources to draw on, are also key determinants of health. Many families, particularly those with lower income, have increased their debt to manage during the crisis. Repaying these debts will create continued financial strain after restrictions have lifted.
At the same time, rental arrears have been mounting for some families and the measures introduced to prevent evictions were removed at the end of May. Without additional support there is likely to be an increase in homelessness. Such an outcome will have important implications for health, while also placing greater financial strain on local authorities to provide new accommodation.
Managing the risk to future health
The prolonged weak economic recovery following the 2008 financial crisis led to a fragility in public services and the economy.
Many people have boosted their incomes by working more and for some, increasing personal debt. Forms of insecure work have increased since the financial crisis. This has left some in a precarious position, less able to deal with a sudden shock to income. This insecurity has been compounded by the residualisation of social security over the past decade: the long-term shift towards a means-tested rather than universal or contributory system which has reduced benefit entitlements, including support with housing.,
From 2010, a programme of significant cuts in government spending had helped reduce the annual deficit to pre-financial crisis levels with day-to-day government spend reduced by approximately 15% on a real-terms per capita basis between 2009/10 and 2018/19. While the Department of Health and Social Care was the main protected department, in other areas of ‘unprotected’ government spending budgets fell by over a quarter. In education, per pupil funding was cut by 8% in real terms between 2009/10 and 2019/20.
The overall shape of these cuts has led to the prioritisation of services that meet acute need rather than prevention. This channelled resources towards older people and pensioners, and away from working-age families and children. Longer term investments in services that help to maintain good health, such as Surestart or housing support, were reduced.
Despite relatively better funding, health and social care services were also under strain. Analysis by the Health Foundation and the REAL Centre has shown that in the decade leading up to the pandemic there was a reduction in hospital capacity and staff shortages – particularly in full-time nurses. Reform of the social care sector has been delayed for years, with provision remaining fragmented and underfunded. These systemic vulnerabilities made it harder for the UK to adapt and cope with COVID-19.
Opportunities to improve health in the recovery
Good health is an asset. It is necessary for a prosperous and flourishing society as it enables people to participate in and contribute to society in different ways. The potential economic benefits of ensuring the best possible health of the population are substantial.
Poor health has been estimated to cost the UK economy £100bn a year in reduced productivity. For those in the workplace, developing a ‘physical impairment’ doubles the probability that a person will experience a reduction in productivity, while the onset of clinically poor mental health leads to a threefold increase in reduced productivity. The presence of a health condition is associated with poorer educational attainment and greater school absence – affecting long-term earnings potential.
Building on the economic, social and political changes that have occurred through the pandemic, the recovery presents an opportunity to address these issues through greater investment and government action.
The pandemic has increased awareness of pre-existing inequalities and the disproportionate effect on some groups, including disabled people, ethnic minority communities, care home residents, people in forms of insecure work and people experiencing homelessness. This awareness can open new debates about how to address inequalities and clear the way for employers, service providers, local communities and governments to take more action to support these groups.
There has also been greater political acceptance for government action and spend to support recovery, through job creation schemes and capital investment projects. These will be crucial for younger people as they enter the job market, as well as those reskilling and entering new types of employment.
There has been greater recognition of the potential power of different levels of governance as the varying roles played by UK, national, regional and local government have become more prominent. This could accelerate the move towards greater devolution of power and increase public recognition of the important role local government can play in shaping the conditions in which we live.
Strengthened local communities can help increase local social and economic resilience. If sustained, the increase in community-based organisations, mutual aid groups and people home working and spending more time locally could build long-term social resilience. It could create novel ways to adapt and deliver services to meet local needs – particularly for those at risk of isolation, such as older people and disabled people. There is also potential for greater investment in local economies due to increased spend by home workers, leading to longer term support for local and smaller businesses and support for local economic growth.
Increased flexibility around remote working and remote access to services will be especially important for working mothers, families and disabled people. Such adaptations could lead to new employment opportunities for these groups, as well as more inclusive working environments and services. Flexible working also enables employers to look beyond their usual geographical markets and access a wider labour pool.
The pandemic saw greater use of new and collaborative data sources and rapid data and evidence collection to inform policy, as well as the high-profile use of scientific expertise in making key policy decisions. An expansion of collaborative data sources has the potential to offer linked data and address data gaps that are currently hampering efforts to fully map the needs of groups that lie below the data line – for example, some ethnic minority communities and people experiencing homelessness.
Conclusions
As the success of the vaccination programme sets the UK on the course towards recovery, it is essential to learn the lessons from the past 18 months. The UK experienced some of the poorest outcomes from the pandemic when compared with similar and neighbouring countries, along with some of the worst economic impacts. The timing of pandemic restrictions and the UK’s regional and international connectedness were leading factors in determining the extent to which the virus spread. But the way COVID-19 has affected different parts of the UK and various populations has seared public consciousness and is a result of pre-existing health and socioeconomic conditions.
It was necessary to impose far-reaching restrictions during the pandemic to suppress the spread of the virus in advance of the population being fully vaccinated. Without these measures, deaths from COVID-19 would have been of an even greater magnitude. The government also took unprecedented action to help mitigate the economic consequences of the restrictions.
Other parts of society also stepped in to support the most vulnerable, from mutual aid groups to food suppliers. However, many services – from education, health and social care to child protection services – were put on hold, or became harder to access. This has meant many people went without the help they urgently needed and are at risk of facing erosions to their immediate and longer term health.
The conclusions of the inquiry points to the need for action in two areas. First, the need for immediate action to address the harm caused by the pandemic. And second, supporting longer term change to prevent future deterioration of health. Ensuring progress will require robust mechanisms for an ongoing assessment of the state of the nation’s health by an independent body and implementation of a cross-government health inequalities strategy.
A legacy of the last crisis
The shape of the UK’s society and economy before the pandemic hit was a consequence of past events and policy choices of successive governments. Decades of reform have led to the benefit system acting as a last resort form of financial support. Growth in productivity, pay and incomes were weak by historical standards even before the financial crisis and there has been growth in forms of insecure work – all of which have reduced the financial resilience of households.
The previous decade of disinvestment in public services meant that their levels of resilience were already low. The shift in provision towards tackling acute need rather than dealing with root causes meant that many of the inequalities highlighted during the aftermath of the financial crisis had not been addressed. These have come to the fore again during the pandemic and further compromised people’s health.
A new approach
Another fragile recovery from the current crisis is avoidable. The pandemic has shown the leading role that government will play in the face of an emergency. A recovery that puts increasing – and fair – opportunities for good health as a priority will need action to deal with the conditions that lead to poor health in the first place. The scale and pace of intervention has continued a shift in public expectations that began towards the end of the last decade. Today, there is a far greater sense that increased government action will be crucial to the recovery and greater public support for increased spend on public services.
Recent public polling has shown that over half (55%) of the UK public were concerned that the COVID-19 pandemic has worsened inequalities, with 8 in 10 people in the UK agreeing that government must address these unequal health outcomes between those living in richer and poorer areas.
“The UK government’s levelling up agenda provides the basis for action to address the differences in outcome and opportunity between places and people.”
The recovery from the pandemic presents a landmark opportunity for a new settlement between the state, individuals, the third sector and business. Putting the goal of improving health and reducing inequalities at the heart of the economic recovery can help remove barriers to future prosperity and create a more secure future. This inquiry did not set out to formulate specific policy recommendations. However, the review of the evidence points to the need for action within two areas:
- Immediate action to address the harm caused by the pandemic and prevent longer term scarring effects. This includes tackling the health care backlog, increasing mental health support to help people back into work, protecting family finances, creating jobs, and ‘catching up’ education and training.
- Building resilience for the longer term. This includes putting in place an adequate safety net to cope with future income and health shocks, providing greater protections for low-paid workers, designing better quality jobs, creating stronger communities and investing in higher quality public services to put prevention first through the government’s levelling up agenda.
Supporting change
The UK government’s levelling up agenda and the associated Build Back Better plan for growth provide the basis for action to address the differences in outcome and opportunity between places and people. Many existed before the pandemic and some have worsened or are at risk of worsening.
When the pandemic hit, the government was already facing difficult fiscal decisions, with growing pressure from an ageing society, the uncertainty of Brexit, a prolonged period of weak growth and an intention to ‘turn the page on austerity’.
Providing quality public services and ensuring a sustainable recovery in the aftermath of the pandemic will require significant investment. Reducing the national debt too quickly will risk undermining the recovery and leave the country vulnerable in another crisis. In the medium term spending to sustain resilient public services will need to be matched by additional revenue – a national conversation is needed about doing so in a way that is fair by income and between young and old.
But change is not purely about additional spend. Government can place a greater focus on using resources wisely, joining up initiatives across government and taking a ‘prevention first’ approach to enable better spending through local government.
Mechanisms are needed to support coordinated, long-term strategic action at national and local level. A cross-government health inequalities strategy with explicit targets for improvement can ensure a sustained focus on the range of government activity that influences health in the short and longer term. In doing so, government will need to look beyond capital investment projects, which have tended to dominate the levelling up agenda, to incorporate investments in human and health capital. In making decisions about allocating spend, greater weight needs to be placed on longer term, preventative measures and health and wellbeing gains.
A comprehensive set of metrics – such as the ONS Health Index – can be used to set goals and assess wider progress than simply the deliverables from specific initiatives. The index provides a framework for action on factors that have both short and long-term effects on people’s health and can incentivise action that will lead to improvements now as well as building resilience for the future. Ensuring improvements are made in the nation’s health, and avoiding further decline, will require an independent body to give parliament a robust assessment of progress.
Building a more resilient society
For years, tension has been growing between maintaining public services and the political desire to keep taxes low and reduce national debt. The resulting strategy has focused on tackling acute need without preventing issues arising in the first place. The experience of the pandemic has laid bare the weaknesses of this approach. There is now more evidence than ever of the crucial role that a healthy population plays in the success of the economy and prosperity of a nation.
In many ways the pandemic has acted as an accelerant to the long-term consequences of policy decisions made over the past decade. The present moment represents an opportunity to make sure this recovery is managed better than the last one: investing in, rather than eroding, the conditions needed for sustaining a healthy population and, with it, a healthy economy.
References
- Office for National Statistics. Coronavirus and the impact on output in the UK economy: December 2020 [Webpage]. Office for National Statistics; 2021 (www.ons.gov.uk/economy/grossdomesticproductgdp/articles/coronavirusandtheimpactonoutputintheukeconomy/december2020)
- UK government. Coronavirus (COVID-19) in the UK. Deaths in the UK [Webpage]. Gov.uk. (https://coronavirus.data.gov.uk/details/deaths)
- UK government. Coronavirus (COVID-19) in the UK. Healthcare in the UK [Webpage]. Gov.uk. (https://coronavirus.data.gov.uk/details/healthcare)
- Office for National Statistics. Coronavirus (COVID-19) related deaths by disability status, England methodology [Webpage]. Office for National Statistics; 2021 (www.ons.gov.uk/peoplepopulationandcommunity/birthsdeaths andmarriages/deaths/methodologies/coronaviruscovid19relateddeathsbydisabilitystatusenglandmethodology)
- Tallack C, Finch D, Mihaylova N, Barclay C, Watt T. Understanding excess deaths: variation in the impact of COVID-19 between countries, regions and localities [Webpage]. Health Foundation; 2020 (www.health.org.uk/news-and-comment/charts-and-infographics/understanding-excess-deaths-countries-regions-localities)
- Flaxman S, Mishra S, Gandy A, Unwin HJT, Mellan TA, Coupland H, et al. Estimating the effects of non-pharmaceutical interventions on COVID-19 in Europe. Nature. 2020;584(7820):257–61. (https://doi.org/10.1038/s41586-020-2405-7)
- Office for National Statistics. Prevalence of ongoing symptoms following coronavirus (COVID-19) infection in the UK [Webpage]. Office for National Statistics; 2021 (www.ons.gov.uk/peoplepopulationandcommunity/ healthandsocialcare/conditionsanddiseases/bulletins/prevalenceofongoingsymptomsfollowingcoronavirus covid19infectionintheuk/4june2021)
- Myers R, Chand M. Disease Detectives – Finding the UK’s dominant COVID-19 variant and the race to understand its impact [Webpage]. Public Health Matters; 2021 (https://publichealthmatters.blog.gov.uk/2021/04/22/disease-detectives-finding-the-uks-dominant-covid-19-variant-and-the-race-to-understand-its-impact)
- Balmford B, Annan JD, Hargreaves JC, Altoè M, Bateman IJ. Cross-Country Comparisons of Covid-19: Policy, Politics and the Price of Life. Environ Resour Econ. 2020;76(4):525–51 (www.ncbi.nlm.nih.gov/pubmed/32836862)
- Balmford A, Fisher B, Mace GM, Wilcove DS, Balmford B. Analogies and lessons from COVID-19 for tackling the extinction and climate crises. Curr Biol. 2020;30(17):R969–71 (www.ncbi.nlm.nih.gov/pubmed/32898490)
- Kontopantelis E, Mamas MA, Deanfield J, Asaria M, Doran T. Excess mortality in England and Wales during the first wave of the COVID-19 pandemic. J Epidemiol Community Health. 2021;75(3):213–23 (https://jech.bmj.com/content/early/2021/01/18/jech-2020-215505)
- Rae A. Think your country is crowded? These maps reveal the truth about population density across Europe [Webpage]. The Conversation; 2018 (https://bit.ly/36O2ARN)
- Tammes P. Social distancing, population density, and spread of COVID-19 in England: a longitudinal study. BJGP Open. 2020 (https://doi.org/10.3399/bjgpopen20X101116)
- OECD. Domestic tourism [Webpage]. OECD.Stat. (https://stats.oecd.org/Index.aspx?DataSetCode=TOURISM_DOMESTIC#)
- Scortichini M, Schneider dos Santos R, De’ Donato F, De Sario M, Michelozzi P, Davoli M, et al. Excess mortality during the COVID-19 outbreak in Italy: a two-stage interrupted time-series analysis. Int J Epidemiol. 2021;49(6):1909–17 (https://doi.org/10.1093/ije/dyaa169)
- Office for National Statistics. Deaths registered weekly in England and Wales, provisional [Webpage]. Office for National Statistics; 2021 (www.ons.gov.uk/peoplepopulationandcommunity/birthsdeathsandmarriages/deaths/bulletins/deathsregisteredweeklyinenglandandwalesprovisional/latest)
- The World Bank. Population ages 80 and above, male (% of male population) [Webpage]. The World Bank; 2019 (https://data.worldbank.org/indicator/SP.POP.80UP.MA.5Y)
- Office for National Statistics. Health state life expectancies, UK [Webpage]. Office for National Statistics; 2018 (www.ons.gov.uk/peoplepopulationandcommunity/healthandsocialcare/healthandlifeexpectancies/bulletins/healthstatelifeexpectanciesuk/2015to2017#healthy-life-expectancy-fails-to-keep-pace-with-life-expectancy-for-males-and-females)
- Raleigh V. What is happening to life expectancy in England? [Webpage]. King’s Fund; 2021 (www.kingsfund.org.uk/publications/whats-happening-life-expectancy-england)
- Atkins JL, Masoli JAH, Delgado J, Pilling LC, Kuo CL, Kuchel GA, et al. Preexisting Comorbidities Predicting COVID-19 and Mortality in the UK Biobank Community Cohort. Newman AB, editor. Journals Gerontol – Ser A Biol Sci Med Sci. 2020;75(11):2224–30 (https://doi.org/10.1093/gerona/glaa183)
- Williamson EJ, Walker AJ, Bhaskaran K, Bacon S, Bates C, Morton CE, et al. Factors associated with COVID-19-related death using OpenSAFELY. Nature. 2020;584(7821):430–6 (https://doi.org/10.1038/s41586-020-2521-4)
- Biswas M, Rahaman S, Biswas TK, Haque Z, Ibrahim B. Association of Sex, Age, and Comorbidities with Mortality in COVID-19 Patients: A Systematic Review and Meta-Analysis. Intervirology. 2021;64(1):36–47 (www.karger.com/Article/FullText/512592)
- Cho SI, Yoon S, Lee HJ. Impact of comorbidity burden on mortality in patients with COVID-19 using the Korean health insurance database. Sci Rep. 2021;11(1):1–9 (https://doi.org/10.1038/s41598-021-85813-2)
- Ritchie H, Roser M. Our World in Data. Obesity. [Webpage]. OurWorldinData.org; 2017 (https://ourworldin data.org/obesity)
- Yang H, Chen W, Hu Y, Chen Y, Zeng Y, Sun Y, et al. Pre-pandemic psychiatric disorders and risk of COVID-19: a UK Biobank cohort analysis. Lancet Heal Longev. 2020;1(2):e69–79 (https://doi.org/10.1016/S2666-7568(20)30013-1)
- Das-Munshi J, Ashworth M, Dewey ME, Gaughran F, Hull S, Morgan C, et al. Type 2 diabetes mellitus in people with severe mental illness: inequalities by ethnicity and age. Cross-sectional analysis of 588,408 records from the UK. Diabet Med. 2017;34(7):916–24 (https://onlinelibrary.wiley.com/doi/full/10.1111/dme.13298)
- Shinn AK, Viron M. Perspectives on the COVID-19 pandemic and individuals with serious mental illness. J Clin Psychiatry. 2020;81(3) (https://pubmed.ncbi.nlm.nih.gov/32369691)
- Wang QQ, Xu R, Volkow ND. Increased risk of COVID-19 infection and mortality in people with mental disorders: analysis from electronic health records in the United States. World Psychiatry. 2021;20(1):124–30 (https://onlinelibrary.wiley.com/doi/10.1002/wps.20806)
- Office for National Statistics. Comparisons of all-cause mortality between European countries and regions [Webpage]. Office for National Statistics; 2020 (www.ons.gov.uk/peoplepopulationandcommunity/birthsdeaths andmarriages/deaths/articles/comparisonsofallcausemortalitybetweeneuropeancountriesandregions/january tojune2020)
- Office for National Statistics. Coronavirus (COVID-19) and the different effects on men and women in the UK [Webpage]. Office for National Statistics; 2021 (https://www.ons.gov.uk/peoplepopulationandcommunity/healthandsocialcare/conditionsanddiseases/articles/coronaviruscovid19andthedifferenteffectsonmenand womenintheukmarch2020tofebruary2021/2021-03-10)
- National Records of Scotland. National Records of Scotland. Deaths involving coronavirus (COVID-19) in Scotland. [Webpage]. National Records of Scotland; 2021 (https://www.nrscotland.gov.uk/covid19stats)
- Northern Ireland Statistics and Research Agency. Covid-19 Related Deaths in Northern Ireland: Deaths Occurring During March 2020 to January 2021. 2021 (www.nisra.gov.uk/sites/nisra.gov.uk/files/publications/COVID-19%20deaths%20-%20March%202020%20-%20January%202021%20-%20Bulletin.pdf)
- Islam N, Shkolnikov VM, Acosta RJ, Klimkin I, Kawachi I, Irizarry RA, et al. Excess deaths associated with covid-19 pandemic in 2020: age and sex disaggregated time series analysis in 29 high income countries. BMJ. 2021;373:n1137 (www.ncbi.nlm.nih.gov/pubmed/34011491)
- NHS Digital. Health Survey for England 2017 Multiple risk factors. Digital.Nhs.Uk; 2018 (https://digital.nhs.uk/data-and-information/publications/statistical/health-survey-for-england/2017)
- Diabetes prevalence [Webpage]. Diabetes.co.uk; 2018 (https://www.diabetes.co.uk/diabetes-prevalence.html)
- Pradhan A, Olsson PE. Sex differences in severity and mortality from COVID-19: are males more vulnerable? Biol Sex Differ. 2020;11(1) (https://pubmed.ncbi.nlm.nih.gov/32948238)
- Office for National Statistics. Coronavirus (COVID-19) related deaths by occupation, England and Wales [Dataset]. Office for National Statistics; 2021 (www.ons.gov.uk/peoplepopulationandcommunity/healthandsocialcare/causes ofdeath/datasets/coronaviruscovid19relateddeathsbyoccupationenglandandwales)
- Office for National Statistics. Coronavirus (COVID-19) related deaths by occupation, England and Wales [Webpage]. Office for National Statistics; 2021 (www.ons.gov.uk/peoplepopulationandcommunity/healthand socialcare/causesofdeath/bulletins/coronaviruscovid19relateddeathsbyoccupationenglandandwales/deaths registeredbetween9marchand28december2020)
- Shah ASV, Wood R, Gribben C, Caldwell D, Bishop J, Weir A, et al. Risk of hospital admission with coronavirus disease 2019 in healthcare workers and their households: Nationwide linkage cohort study. BMJ. 2020;371 (https://pubmed.ncbi.nlm.nih.gov/33115726)
- HM Revenue & Customs. Coronavirus Job Retention Scheme statistics: 3 June 2021 [Webpage]. Gov.uk; 2021 (www.gov.uk/government/statistics/coronavirus-job-retention-scheme-statistics-3-june-2021/coronavirus-job-retention-scheme-statistics-3-june-2021)
- Reed S, Palmer B, Brewer M, Gustafsson M. Tackling Covid-19: A case for better financial support to self-isolate. Nuffield Trust; 2021. (www.nuffieldtrust.org.uk/research/tackling-covid-19-a-case-for-better-financial-support-to-self-isolate)
- Butcher B, Cowling P. Covid: How many people get self-isolation payments? – BBC News [Webpage]. BBC; 2021 (www.bbc.co.uk/news/56201754)
- OECD. Net replacement rate in unemployment [Webpage]. OECD.stat. (https://stats.oecd.org/Index.aspx?Data SetCode=NRR#)
- Smith L, Potts HW, Amlôt R, Fear N, Michie S, Rubin GJ. Adherence to the test, trace and isolate system: results from a time series of 21 nationally representative surveys in the UK (the COVID-19 Rapid Survey of Adherence to Interventions and Responses [CORSAIR] study). Bmj; 2020 (www.bmj.com/content/372/bmj.n608)
- Comptroller & Auditor General. Supply of personal protective equipment (PPE) during the covid-19 pandemic. National Audit Office; 2020 (www.nao.org.uk/report/supplying-the-nhs-and-adult-social-care-sector-with-personal-protective-equipment-ppe)
- Health Foundation. What has been the impact of COVID-19 on care homes and the social care workforce? [Webpage]. Health Foundation; 2020 (www.health.org.uk/news-and-comment/charts-and-infographics/what-has-been-the-impact-of-covid-19-on-care-homes-and-social-care-workforce)
- Finch D. The healthy life expectancy gap [Webpage]. Health Foundation; 2018 (https://health.org.uk/blogs/the-healthy-life-expectancy-gap)
- Watt T, Raymond A. Unpublished analysis (see technical supplement for details). Health Foundation; 2021.
- Tinson A, Clair A. Better housing is crucial for our health and the COVID-19 recovery. Health Foundation; 2020. (www.health.org.uk/sites/default/files/2021-01/2020%20-%20Better%20housing%20is%20crucial.pdf)
- Ministry of Housing, Communities and Local Government. English Housing Survey. MHCLG; 2020 (https://assets.publishing.service.gov.uk/government/uploads/system/uploads/attachment_data/file/945013/2019-20_EHS_Headline_Report.pdf)
- Raisi-Estabragh Z, McCracken C, Bethell MS, Cooper J, Cooper C, Caulfield MJ, et al. Greater risk of severe COVID-19 in black, asian and minority ethnic populations is not explained by cardiometabolic, socioeconomic or behavioural factors, or by 25(OH)-vitamin D status: Study of 1326 cases from the UK biobank. J Public Heal (United Kingdom). 2020;42(3):451–60 (https://academic.oup.com/jpubhealth/article/42/3/451/5859581)
- Joy M, Hobbs FDR, Bernal JL, Sherlock J, Amirthalingam G, McGagh D, et al. Excess mortality in the first COVID pandemic peak: Cross-sectional analyses of the impact of age, sex, ethnicity, household size, and long-term conditions in people of known SARS-CoV-2 status in England. Br J Gen Pract. 2020;70(701):E890–8 (https://doi.org/10.3399/bjgp20X713393)
- Nafilyan V, Islam N, Ayoubkhani D, Gilles C, Katikireddi SV, Mathur R, et al. Ethnicity, Household Composition and COVID-19 Mortality: A National Linked Data Study. J R Soc Med. 2020;014107682199997 (http://journals.sagepub.com/doi/10.1177/0141076821999973)
- Kenway P, Holden J. Accounting for the Variation in the Confirmed Covid-19 Caseload across England: An analysis of the role of multi-generation households, London and time. 2020 (www.npi.org.uk/publications/housing-and-homelessness/accounting-variation-confirmed-covid-19-caseload-across-england-analysis-role-multi-generation-households-london-and-time)
- UK Government. Coronavirus (Covid-19) in the UK. Vaccinations in United Kingdom [Webpage]. Gov.uk; 2021 (https://coronavirus.data.gov.uk/details/vaccinations)
- Public Health England. COVID-19 vaccine surveillance report – week 19. Gov.uk; 2021 (www.gov.uk/government/publications/covid-19-vaccine-surveillance-report)
- Local Government Association. Case studies [Webpage] (https://local.gov.uk/case-studies)
- The health impact of the pandemic: NHS hospital treatments for long-term health conditions fall by over 60% in April [Webpage]. Understanding Society; 2020 (www.understandingsociety.ac.uk/2020/06/08/the-health-impact-of-the-pandemic-nhs-hospital-treatments-for-long-term-health-conditions-fall-by)
- The Nuffield Trust. Vaccination coverage for children and mothers [Webpage]. The Nuffield Trust; 2021 (www.nuffieldtrust.org.uk/resource/vaccination-coverage-for-children-and-mothers-1)
- Public Health England. Impact of COVID-19 on childhood vaccination counts up to week 49, 2020 [Webpage].Gov.uk; 2021 (www.gov.uk/government/publications/covid-19-impact-on-vaccination-programmes/impact-of-covid-19-on-childhood-vaccination-counts-up-to-week-49-2020)
- Thorlby R, Fraser C, Gardner T. Non-COVID-19 NHS care during the pandemic [Webpage]. Health Foundation; 2020 (www.health.org.uk/news-and-comment/charts-and-infographics/non-covid-19-nhs-care-during-the-pandemic)
- Ray A, Stevens A, Thirunavukarasu A. Offline and left behind: how digital exclusion has impacted health during the covid-19 pandemic. theBMJopinion. 2020;1 (https://blogs.bmj.com/bmj/2020/07/03/offline-and-left-behind- how-digital-exclusion-has-impacted-health-during-the-covid-19-pandemic/?utm_source=twitter&utm_medium=social&utm_term=hootsuite&utm_content=sme&utm_campaign=usage)
- Watts G. COVID-19 and the digital divide in the UK. Lancet Digit Heal. 2020;2(8):e395–6 (http://dx.doi.org/10.1016/S2589-7500(20)30169-2)
- Watt T, Kelly E, Fisher R. Use of primary care during the COVID-19 pandemic: May 2021 update [Webpage]. Health Foundation; 2021 (www.health.org.uk/news-and-comment/charts-and-infographics/use-of-primary-care-during-the-covid-19-pandemic-may-2021)
- Watt T, Firth Z, Fisher R, Thorlby R, Kelly E. Use of primary care during the COVID-19 pandemic [Webpage]. Health Foundation; 2020 (www.health.org.uk/news-and-comment/charts-and-infographics/use-of-primary-care-during-the-covid-19-pandemic)
- McConkey R, Wyatt S. Exploring the fall in A&E visits during the pandemic [Webpage]. Health Foundation; 2020 (www.health.org.uk/news-and-comment/charts-and-infographics/exploring-the-fall-in-a-e-visits-during-the-pandemic)
- Burn S, Propper C, Stoye G, Warner M, Aylin P, Bottle A. What happened to English NHS hospital activity during the COVID-19 pandemic? lnstitute for Fiscal Studies; 2021 (https://ifs.org.uk/uploads/BN328-What-happened-to-English-NHS-hospital-activity-during-the-COVID-19-pandemic.pdf)
- Gardner T, Fraser C. Longer waits, missing patients and catching up [Webpage]. Health Foundation; 2021 (www.health.org.uk/news-and-comment/charts-and-infographics/how-is-elective-care-coping-with-the- continuing-impact-of-covid-19)
- Health Foundation. Elective care in England [Webpage]. Health Foundation; 2020 (www.health.org.uk/publications/long-reads/elective-care-in-england-assessing-the-impact-of-covid-19-and-where-next)
- Rutter MD, Brookes M, Lee TJ, Rogers P, Sharp L. Impact of the COVID-19 pandemic on UK endoscopic activity and cancer detection: A National Endoscopy Database Analysis. Gut. 2021;70(3):537–43 (http://dx.doi.org/10.1136/gutjnl-2020-322179)
- Morris EJA, Goldacre R, Spata E, Mafham M, Finan PJ, Shelton J, et al. Impact of the COVID-19 pandemic on the detection and management of colorectal cancer in England: a population-based study. Lancet Gastroenterol Hepatol. 2021;6(3):199–208 (www.thelancet.com/journals/langas/article/PIIS2468-1253(21)00005-4/fulltext)
- Diabetes prevalence [Webpage]. Diabetes UK; 2018 (www.diabetes.org.uk/professionals/position-statements-reports/statistics/diabetes-prevalence-2019)
- Sauchelli S, Bradley J, England C, Searle A, Whitmarsh A, Hotopf M, et al. Exploring support needs of people living with diabetes during the coronavirus COVID-19 pandemic: insights from a UK survey. BMJ Open Diabetes Res Care. 2021;9(1) (https://pubmed.ncbi.nlm.nih.gov/34099440)
- Eating disorders: How common is it? [Webpage]. National Institute for Health and Care Excellence; 2019 (https://cks.nice.org.uk/topics/eating-disorders/background-information/prevalence)
- Vuillier L, May L, Greville-Harris M, Surman R, Moseley RL. The impact of the COVID-19 pandemic on individuals with eating disorders: the role of emotion regulation and exploration of online treatment experiences. J Eat Disord. 2021;9(1) (https://jeatdisord.biomedcentral.com/articles/10.1186/s40337-020-00362-9)
- Joint Epilepsy Council of the UK and Ireland. Epilepsy prevalence, incidence and other statistics [Webpage]. Joint Epilepsy Council of the UK and Ireland; 2011 (www.epilepsyscotland.org.uk/wp-content/uploads/2019/05/Joint_Epilepsy_Council_Prevalence_and_Incidence_September_11_3.pdf)
- Reilly C, Muggeridge A, Cross JH. The perceived impact of COVID-19 and associated restrictions on young people with epilepsy in the UK: Young people and caregiver survey. Seizure. 2021;85:111–4 (www.ncbi.nlm.nih.gov/pubmed/33453591)
- [MI] Tracking Healthcare Activity and Outcomes for Shielded Patients, England – up to 28 September 2020 [Webpage]. NHS Digital; 2020 (https://digital.nhs.uk/data-and-information/publications/statistical/mi-tracking-healthcare-activity-and-outcomes-for-shielded-patients-england/latest)
- Marszalek K, Peytrignet S. Understanding the needs of those most clinically vulnerable to COVID-19 [Webpage]. Health Foundation; 2020 (www.health.org.uk/news-and-comment/charts-and-infographics/understanding-the-needs-and-experiences-of-those-most-clinic)
- Hodgson K, Peytrignet S, Marszalek K. How has hospital use among those clinically extremely vulnerable to COVID-19 been impacted by the pandemic? [Webpage]. Health Foundation; 2021 (www.health.org.uk/news-and-comment/charts-and-infographics/hospital-use-clinically-extremely-vulnerable-population)
- Karavadra B, Stockl A, Prosser-Snelling E, Simpson P, Morris E. Women’s perceptions of COVID-19 and their healthcare experiences: A qualitative thematic analysis of a national survey of pregnant women in the United Kingdom. BMC Pregnancy Childbirth. 2020;20(1):600 (https://bmcpregnancychildbirth.biomedcentral.com/articles/10.1186/s12884-020-03283-2)
- Vazquez-Vazquez A, Dib S, Rougeaux E, Wells JC, Fewtrell MS. The impact of the Covid-19 lockdown on the experiences and feeding practices of new mothers in the UK: Preliminary data from the COVID-19 New Mum Study. Appetite. 2021;156(January):104985 (www.ncbi.nlm.nih.gov/pmc/articles/PMC7538871/?report=abstract)
- Kirk S, Morgan L, McDermott S, McLaughlin L, Hunter C, Farrington T. Introduction of the National Health Service early medical abortion service in Northern Ireland – An emergency response to the COVID-19 pandemic. BMJ Sexual and Reproductive Health; 2021 (https://srh.bmj.com/content/early/2021/01/12/bmjsrh-2020-200920)
- Dunn P, Allen L, Alarilla A, Grimm F, Humphries R, Alderwick H. Adult social care and COVID-19 after the first wave: assessing the policy response in England. Health Foundation; 2021. (www.health.org.uk/publications/reports/adult-social-care-and-covid-19-after-the-first-wave)
- Office for National Statistics. Coronavirus and depression in adults, Great Britain: January to March 2021 [Webpage]. Office for National Statistics. 2021. p. 1–18 (www.ons.gov.uk/peoplepopulationandcommunity/wellbeing/articles/coronavirusanddepressioninadultsgreatbritain/januarytomarch2021)
- Fancourt D, Bu F, Mak HW, Paul E, Steptoe PA. Covid-19 Social Study: Results Release 33. UCL; 2021 (https://b6bdcb03-332c-4ff9-8b9d-28f9c957493a.filesusr.com/ugd/3d9db5_9d55b4ff686744cdae69e72cd1 41ecfb.pdf)
- Banks J, Fancourt D, Xu X. Mental Health and the COVID-19 Pandemic. World Happiness Report; 2021 (https://worldhappiness.report/ed/2021)
- Sehmi R, Slaughter H. Double trouble: Exploring the labour market and mental health impact of Covid-19 on young people. Resolution Foundation; 2021 (www.resolutionfoundation.org/app/uploads/2021/05/Double-trouble.pdf)
- Carr MJ, Steeg S, Webb RT, Kapur N, Chew-Graham CA, Abel KM, et al. Effects of the COVID-19 pandemic on primary care-recorded mental illness and self-harm episodes in the UK: a population-based cohort study. Lancet Public Heal. 2021;6(2):e124–35 (www.ncbi.nlm.nih.gov/pubmed/33444560)
- Avon Longitudinal Study of Parents and Children [Webpage]. University of Bristol (www.bristol.ac.uk/alspac)
- Generation Scotland [Webpage]. The University of Edinburgh (www.ed.ac.uk/generation-scotland)
- Kwong A, Pearson R, Adams M, Northstone K, Tilling K, Smith D, et al. Mental health during the COVID-19 pandemic in two longitudinal UK population cohorts. medRxiv. 2020;2020.06.16.20133116 (https://doi.org/10.1101/2020.06.16.20133116)
- Wilson H, Finch D. Unemployment and mental health [Webpage]. Health Foundation; 2021 (www.health.org.uk/publications/long-reads/unemployment-and-mental-health)
- Niedzwiedz CL, Green MJ, Benzeval M, Campbell D, Craig P, Demou E, et al. Mental health and health behaviours before and during the initial phase of the COVID-19 lockdown: Longitudinal analyses of the UK Household Longitudinal Study. J Epidemiol Community Health. 2021;75(3):224–31 (www.ncbi.nlm.nih.gov/pubmed/32978210)
- Xue B, McMunn A. Gender differences in unpaid care work and psychological distress in the UK Covid-19 lockdown. Tran TD, editor. PLoS One. 2021;16(3 March):e0247959 (https://dx.plos.org/10.1371/journal.pone.0247959)
- Etheridge B, Spantig L. The gender gap in mental well-being during the Covid-19 outbreak: evidence from the UK. Institute for Social and Economic Research; 2020 (www.iser.essex.ac.uk/research/publications/working-papers/iser/2020-08)
- Ivandic R. Domestic abuse in times of quarantine. Centre for Economic Performance: CentrePiece; 2020 (https://cep.lse.ac.uk/_NEW/PUBLICATIONS/abstract.asp?index=7134)
- Davidge S. A perfect storm: the impact of Covid-19 pandemic on domestic abuse survivors and the services supporting them. Women’s Aid; 2020 (www.womensaid.org.uk/wp-content/uploads/2020/08/A-Perfect-Storm-August-2020-1.pdf)
- Kelly J. Coronavirus: Domestic abuse an “epidemic beneath a pandemic” [Webpage]. BBC News; 2021 (www.bbc.co.uk/news/uk-56491643)
- Calls to NSPCC about children living in violent homes rise by over 50% as we urge government to support all children [Webpage]. NSPCC; 2021 (www.nspcc.org.uk/about-us/news-opinion/2021/calls-to-nspcc-about- children-living-in-violent-homes-rise-by-over-50-as-we-urge-government-to-support-all-children)
- Garstang J, Debelle G, Anand I, Armstrong J, Botcher E, Chaplin H, et al. Effect of COVID-19 lockdown on child protection medical assessments: A retrospective observational study in Birmingham, UK. BMJ Open. 2020;10(9):42867 (https://bmjopen.bmj.com/content/10/9/e042867)
- Tinson A, Bunbury S. Unpublished analysis (see Technical supplement 2 for details); 2021
- Stevely AK, Sasso A, Alava MH, Holmes J. Changes in alcohol consumption in Scotland during the early stages of the COVID-19 pandemic: Descriptive analysis of repeat cross-sectional survey data. Public Health Scotland; 2021 (www.publichealthscotland.scot/media/2983/changes-in-alcohol-consumption-in-scotland-during-the-early-stages-of-the-covid-19-pandemic.pdf)
- Addiction services not equipped to treat the 8 million people drinking at high risk during pandemic, warns Royal College [Webpage]. Royal College of Psychiatrists; 2020 (www.rcpsych.ac.uk/news-and-features/latest-news/detail/2020/09/14/addiction-services-not-equipped-to-treat-the-8-million-people-drinking-at-high-risk-during-pandemic-warns-royal-college)
- Office for National Statsitics. Quarterly alcohol-specific deaths in England and Wales [Webpage]. Office for National Statistics; 2021 (www.ons.gov.uk/peoplepopulationandcommunity/birthsdeathsandmarriages/deaths/ bulletins/quarterlyalcoholspecificdeathsinenglandandwales/2001to2019registrationsandquarter1jantomarto quarter4octtodec2020provisionalregistrations)
- Sport England. Active Lives Adult Survey November 2019/20 Report. Sport England; 2021 (https://sportengland-production-files.s3.eu-west-2.amazonaws.com/s3fs-public/2021-04/Active%20Lives%20Adult%20November %202019-20%20Report.pdf?VersionId=OjWdwCLnI3dNgDwp3X4ukcODJIDVG7Kd)
- Health Foundation. Healthy lives for people in the UK. Health Foundation; 2017 (www.health.org.uk/sites/default/files/HealthyLivesForPeopleInTheUK.pdf)
- Abrams D, Lalot F, Broadwood J, Platts-Dunn I. Beyond Us and Them: Perception of Covid-19 and Social Cohesion. Belong; 2020 (www.belongnetwork.co.uk/resources/beyond-us-and-them-perception-of-covid-19-and-social-cohesion-july-2020-report)
- Office for National Statistics. Mapping loneliness during the coronavirus pandemic [Webpage]. Office for National Statistics; 2021 (www.ons.gov.uk/peoplepopulationandcommunity/wellbeing/articles/mappinglonelinessduringthe coronaviruspandemic/2021-04-07)
- Office for National Statistics. Coronavirus and loneliness, Great Britain [Webpage]. Office for National Statistics; 2021 (www.ons.gov.uk/peoplepopulationandcommunity/wellbeing/bulletins/coronavirusandlonelinessgreat britain/3aprilto3may2020)
- Copps J. Local authorities can help make mutual aid a positive legacy of COVID-19. The MJ. 2020. (https://themj.co.uk/Local-authorities-can-help-make-mutual-aid-a-positive-legacy-of-COVID-19/217533)
- Stansfield J, Mapplethorpe T, South J. The community response to coronavirus (COVID-19) – Public health matters [Webpage]. PHE Blog; 2020 (https://publichealthmatters.blog.gov.uk/2020/06/01/the-community-response-to-coronavirus-covid-19)
- NHS army of volunteers to start protecting vulnerable from coronavirus in England [Webpage]. NHS England; 2020 (www.england.nhs.uk/2020/04/nhs-volunteer-army-now-ready-to-support-even-more-people)
- Borkowska M, Laurence J. Coming together or coming apart? Changes in social cohesion during the Covid-19 pandemic in England. Eur Soc. 2021;23(S1):S618–36 (www.tandfonline.com/doi/full/10.1080/14616696.2020.1833067)
- Fancourt D, Bu F, Mak HW, Steptoe PA. Covid-19 Social Study: Results Release 27. UCL (https://b6bdcb03-332c-4ff9-8b9d-28f9c957493a.filesusr.com/ugd/3d9db5_56829e7218df4524b304636d226a6198.pdf)
- The British Academy. The COVID decade: understanding the long-term societal impacts of COVID-19. British Academy for the Humanities and Social Sciences; 2021 (www.thebritishacademy.ac.uk/documents/3238/COVID-decade-understanding-long-term-societal-impacts-COVID-19.pdf)
- Office for National Statistics. Coronavirus and the social impacts on Great Britain [Webpage]. Office for National Statistics; 2020 (www.ons.gov.uk/peoplepopulationandcommunity/healthandsocialcare/healthandwellbeing/ bulletins/coronavirusandthesocialimpactsongreatbritain/14may2020#unity-equality-and-kindness)
- Office for National Statistics. Unity and division in Great Britain [Webpage]. Office for National Statistics; 2020 (www.ons.gov.uk/peoplepopulationandcommunity/wellbeing/bulletins/unityanddivisioningreatbritain/24april to28june2020)
- Bom J, Stöckel J. Is the grass greener on the other side? The health impact of providing informal care in the UK and the Netherlands. Soc Sci Med. 2021;269 (https://pubmed.ncbi.nlm.nih.gov/33339683)
- Bom J, Bakx P, Schut F, Van Doorslaer E. The Impact of Informal Caregiving for Older Adults on the Health of Various Types of Caregivers: A Systematic Review. Gerontologist. 2019;59(5) (https://academic.oup.com/gerontologist/article/59/5/e629/5159652)
- YouGov. A forgotten army: coping as a carer. Future Care Capital; 2019 (https://futurecarecapital.org.uk/research/4th-june-2019-a-forgotten-army-coping-as-a-carer)
- Lacey RE, McMunn A, Webb E. Informal caregiving patterns and trajectories of psychological distress in the UK Household Longitudinal Study. Psychol Med. 2019;49(10):1652–60 (https://doi.org/10.1017/S0033291718002222)
- Dymond-Green N. What happened to unpaid caring during the COVID-19 pandemic? [Webpage]. Data Impact Blog; 2021 (https://blog.ukdataservice.ac.uk/unpaid-caring-during-covid19)
- Bennett MR, Zhang Y, Yeandle S. Caring and COVID-19: hunger and mental wellbeing. Centre for International Research on Care, Labour and Equalities; 2020 (http://circle.group.shef.ac.uk/wp-content/uploads/2020/06/Caring-and-COVID-19_Hunger-and-mental-wellbeing-2.pdf)
- Bennett MR, Zhang Y, Yeandle S. Caring and COVID-19 – Loneliness and use of services. Centre for International Research on Care, Labour and Equalities; 2020 (http://circle.group.shef.ac.uk/wp-content/uploads/2020/08/CARING-and-COVID-19-Loneliness-and-use-of-services_04.08.20.pdf)
- Carers UK. Caring behind closed doors: six months on. Carers UK; 2020 (www.carersuk.org/images/News_and_campaigns/Behind_Closed_Doors_2020/Caring_behind_closed_doors_Oct20.pdf)
- Lorenz-Dant K, Comas-Herrera A. The Impacts of COVID-19 on Unpaid Carers of Adults with Long-Term Care Needs and Measures to Address these Impacts: A Rapid Review of Evidence up to November 2020. J Long Term Care. 2021;124–53 (https://journal.ilpnetwork.org/articles/10.31389/jltc.76)
- Gallagher S, Wetherell MA. Risk of depression in family caregivers: unintended consequence of COVID-19. BJPsych Open. 2020;6(6) (www.ncbi.nlm.nih.gov/pmc/articles/PMC7550870)
- Marmot M, Allen J, Goldblatt P, Herd E, Morrison J. Build Back Fairer: The COVID-19 Marmot Review. Health Foundation; 2020 (www.health.org.uk/publications/build-back-fairer-the-covid-19-marmot-review)
- Pascal C, Bertram T, Cullinane C, Holt-White E. COVID-19 and social mobility impact brief #4: Early years. Sutton Trust; 2020 (www.suttontrust.com/wp-content/uploads/2020/06/Early-Years-Impact-Brief.pdf)
- Education Policy Institute. Coronavirus impact on the early years sector. National Day Nurseries Association; 2021 (www.ndna.org.uk/NDNA/News/Reports_and_surveys/Coronavirus_impact_on_the_early_years_sector_ndna_epi_study.aspx)
- Ofsted. COVID-19 series – briefing on early years – October 2020. Gov.uk; 2020 (www.gov.uk/government/publications/covid-19-series-briefing-on-early-years-october-2020)
- Renaissance Learning, Education Policy Institute. Understanding progress in the 2020/21 academic year: Interim findings. Department for Education; 2021 (www.gov.uk/government/publications/pupils-progress-in-the-2020-to-2021-academic-year-interim-report)
- Juniper. The impact of the COVID-19 pandemic on primary school children’s learning. Juniper; 2021 (https://21e8jl3324au2z28ej2uho3t-wpengine.netdna-ssl.com/wp-content/uploads/juniper_folder/Juniper-Education-National-Benchmark-Dataset-Report.pdf)
- Renaissance Learning & Education Policy Institute. Understanding Progress in the 2020/21 Academic Year: Initial findings from the spring term. Department for Education; 2021 (https://assets.publishing.service.gov.uk/government/uploads/system/uploads/attachment_data/file/991230/Understanding_Progress_in_the_2020_21_Academic_Year_Initial_Report_3_.pdf)
- Renaissance Learning, Education Policy Institute. Understanding progress in the 2020/21 academic year: Complete findings from the autumn term. Department for Education; 2021 (https://assets.publishing.service.gov.uk/government/uploads/system/uploads/attachment_data/file/991576/Understanding_Progress_in_the_2020_21_Academic_Year_Report_2.pdf#page=12)
- Office for National Statistics. Exploring the UK’s digital divide [Webpage]. Office for National Statistics; 2019 (www.ons.gov.uk/peoplepopulationandcommunity/householdcharacteristics/homeinternetandsocialmediausage/articles/exploringtheuksdigitaldivide/2019-03-04)
- Lloyds Bank. UK Consumer Digital Index 2020. Lloyds Bank; 2020 (www.lloydsbank.com/assets/media/pdfs/banking_with_us/whats-happening/lb-consumer-digital-index-2020-report.pdf)
- OfCOM. Digital divide narrowed by pandemic, but around 1.5m homes remain offline [Webpage]. OfCOM News; 2021. p. 5 (www.ofcom.org.uk/about-ofcom/latest/media/media-releases/2021/digital-divide-narrowed- but-around-1.5m-homes-offline?utm_medium=email&utm_campaign=Digital divide narrowed by pandemic but around 15m homes remain offline&utm_content=Digital divide)
- Centre for Ageing Better. How has COVID-19 changed the landscape of digital inclusion? Centre for Ageing Better; 2020 (www.ageing-better.org.uk/publications/how-has-covid-19-changed-landscape-digital-inclusion)
- Sharp C, Nelson J, Lucas M, Julius J, McCrone T, Sims D. The challenges facing schools and pupils in September 2020. NFER; 2020 (https://mk0nuffieldfounpg9ee.kinstacdn.com/wp-content/uploads/2020/09/schools_responses_to_covid_19_the_challenges_facing_schools_and_pupils_in_september_2020.pdf)
- Hanushek EA, Woessmann L. The Economic Impacts of Learning Losses. Vol. 225, OECD Education Working Papers; 2020 (https://www.oecd-ilibrary.org/education/the-economic-impacts-of-learning-losses_21908d74-en)
- Bell T, Brewer M. The 12-month stretch: Where the Government has delivered – and where it has failed – during the Covid-19 crisis. Resolution Foundation; 2021 (www.resolutionfoundation.org/publications/the-12-month-stretch)
- Cominetti N, Henehan K, Slaughter H, Thwaites G. Long Covid in the labour market: The impact on the labour market of Covid-19 a year into the crisis, and how to secure a strong recovery. Resolution Foundation; 2021. (www.resolutionfoundation.org/publications/long-covid-in-the-labour-market)
- Cominetti N. A U-shaped crisis. Resolution Foundation; 2021 (www.resolutionfoundation.org/app/uploads/2021/ 04/A-U-shaped-crisis.pdf)
- Delestre I, Joyce R, Rasul I, Waters T. Income protection policy during COVID-19: evidence from bank account data. Institute for Fiscal Studies; 2020 (www.ifs.org.uk/publications/15002)
- Handscomb K, Judge L. Caught in a (Covid) trap: Incomes, savings and spending through the coronavirus crisis. Resolution Foundation; 2020 (www.resolutionfoundation.org/app/uploads/2020/11/Caught-in-a-Covid-trap.pdf)
- Andrew A, Cattan S, Dias MC, Farquharson C, Kraftman L, Krutikova S, et al. How are mothers and fathers balancing work and family under lockdown? Institute for Fiscal Studies; 2020 (www.ifs.org.uk/publications/14860)
- Turn2Us. Coronavirus: Exacerbating structural inequalities in the labour market and a looming rental crisis. Turn2Us; 2020 (https://www.turn2us.org.uk/T2UWebsite/media/Documents/Communications documents/Coronavirus-widening-structural-inequalities-June-2020.pdf)
- Fawcett Society, LSE and Queen Mary University. Parenting and Covid-19-Research evidence. Women’s Budget Group; 2020 (https://wbg.org.uk/wp-content/uploads/2020/08/Coronavirus-the-impact-on-parents-20.08.2020.pdf)
- Guidance for Landlords and Tenants [Webpage]. Ministry of Housing, Communities & Local Government; 2020. p. 1–21 (www.gov.uk/government/publications/covid-19-and-renting-guidance-for-landlords-tenants-and-local-authorities/coronavirus-covid-19-guidance-for-landlords-and-tenants)
- FCA. Mortgages and coronavirus: information for consumers [Webpage]. Financial Conduct Authority; 2021 (www.fca.org.uk/consumers/mortgages-coronavirus-consumers)
- English Housing Survey: Household Resilience Study: Wave 1. 2020 (www.gov.uk/government/statistics/household-resilience-study-wave-1)
- Judge L. Getting ahead on falling behind: Tackling the UK’s building arrears crisis [Webpage]. Resolution Foundation; 2021 (www.resolutionfoundation.org/publications/getting-ahead-on-falling-behind)
- Earwaker R, Elliott J. We can’t allow renters to be locked out of our post-pandemic recovery [Webpage]. Joseph Rowntree Foundation; 2021 (www.jrf.org.uk/report/we-cant-allow-renters-be-locked-out-our-post-pandemic-recovery)
- Comptroller & Auditor General. Investigation into the housing of rough sleepers during the COVID-19 pandemic. National Audit Office; 2021 (www.nao.org.uk/wp-content/uploads/2021/01/Investigation-into-the-housing-of-rough-sleepers-during-the-COVID-19-pandemic.pdf)
- Bell D, Comas-Herrera A, Henderson D, Jones S, Lemmon E, Moro M, Murphy S, et al. OD and PP. COVID-19 mortality and long-term care: a UK comparison. Article in LTCcovid.org, International LongTerm Care Policy Network, CPEC-LSE, August 2020. 2020 (https://ltccovid.org/wp-content/uploads/2020/08/COVID-19-mortality-in-long-term-care-final-Sat-29-1.pdf)
- Office for National Statistics. Deaths involving COVID-19 in the care sector, England and Wales [Webpage]. Office for National Statistics; 2020 (www.ons.gov.uk/peoplepopulationandcommunity/birthsdeathsandmarriages/deaths/articles/deathsinvolvingcovid19inthecaresectorenglandandwales/deathsoccurringupto12june2020andregistered upto20june2020provisional)
- Scobie S. Covid-19 and the deaths of care home residents [Webpage]. The Nuffield Trust; 2021 (www.nuffieldtrust.org.uk/news-item/covid-19-and-the-deaths-of-care-home-residents)
- Dunn P, Allen L, Humphries R, Alderwick H. Adult social care and COVID-19: Assessing the policy response in England so far. Health Foundation; 2020 (www.health.org.uk/publications/reports/adult-social-care-and-covid-19-assessing-the-policy-response-in-england)
- Health Foundation. What has been the impact of COVID-19 on care homes and the social care workforce? [Webpage]. Health Foundation; 2020 (www.health.org.uk/news-and-comment/charts-and-infographics/what-has-been-the-impact-of-covid-19-on-care-homes-and-social-care-workforce)
- Brainard J, Rushton S, Winters T, Hunter PR. Introduction to and spread of COVID-19-like illness in care homes in Norfolk, UK. J Public Health. 2021;43(2) (https://pubmed.ncbi.nlm.nih.gov/33367852)
- Health Foundation. Do all care home residents face an equal risk of dying from COVID-19? [Webpage]. Health Foundation. (www.health.org.uk/news-and-comment/charts-and-infographics/do-all-care-home-residents-face-an-equal-risk-covid-19)
- Bach-Mortensen AM, Degli Esposti M. Is area deprivation associated with greater impacts of COVID-19 in care homes across England? A preliminary analysis of COVID-19 outbreaks and deaths. J Epidemiol Community Health. 2021;75(7):624–627 (https://jech.bmj.com/content/75/7/624)
- Grimm F, Hodgson K, Brine R, Deeny SR. Hospital admissions from care homes in England during the COVID-19 pandemic: a retrospective, cross-sectional analysis using linked administrative data. 2021 (www.preprints.org/manuscript/202102.0593/v1)
- Health Foundation. Research reveals scale of reduction in hospital treatment for care home residents and warns of backlog of pent-up demand for NHS care [Webpage]. Health Foundation; 2021 (www.health.org.uk/news-and-comment/news/research-reveals-scale-of-reduction-in-hospital-treatment-fo)
- Age NI. Lived Experience - Voices of older people on the COVID-19 Pandemic 2020. Age NI; 2020 (www.ageuk.org.uk/globalassets/age-ni/documents/policy/153184_lived-experiences-brochure_v10.pdf)
- Care Quality Commission. The state of health care and adult social care in England 2019/20. Care Quality Commission; 2020 (www.cqc.org.uk/sites/default/files/20201016_stateofcare1920_fullreport.pdf)
- Covid might not kill them … but loneliness possibly will. Healthwatch Leeds; 2020. (https://healthwatch leeds.co.uk/wp-content/uploads/2020/07/Care-Home-Report.pdf)
- Office for National Statistics. Updated estimates of coronavirus (COVID-19) related deaths by disability status, England [Webpage]. Office for National Statistics; 2021 (www.ons.gov.uk/peoplepopulationand community/birthsdeathsandmarriages/deaths/articles/coronaviruscovid19relateddeathsbydisabilitystatus englandandwales/24januaryto20november2020)
- Daly M. COVID-19 and care homes in England: What happened and why? Soc Policy Adm. 2020;54(7):985–98 (https://www.ncbi.nlm.nih.gov/pubmed/32904948)
- The Learning Disabilities Mortality Review Programme. Deaths of people with learning disabilities from COVID-19. University of Bristol; 2020 (www.bristol.ac.uk/media-library/sites/sps/leder/Deaths%20of%20people%20with %20learning%20disabilities%20from%20COVID-19.pdf)
- Dickinson H, Carey G, Kavanagh AM. Personalisation and pandemic: an unforeseen collision course? Disabil Soc. 2020;35(6):1012–7 (https://doi.org/10.1080/09687599.2020.1772201)
- Inclusion London. Abandoned, forgotten and ignored: The impact of the coronavirus pandemic on Disabled people. Inclusion London; 2020. (www.inclusionlondon.org.uk/wp-content/uploads/2020/06/Abandoned-Forgotten-and-Ignored-Final-1.pdf)
- Sakellariou D, Rotarou ES. Access to healthcare for men and women with disabilities in the UK: Secondary analysis of cross-sectional data. BMJ Open. 2017;7(8) (https://bmjopen.bmj.com/content/7/8/e016614)
- Office for National Statistics. Coronavirus and the social impacts on disabled people in Great Britain [Webpage]. Office for National Statistics; 2020 (www.ons.gov.uk/peoplepopulationandcommunity/birthsdeathsand marriages/deaths/articles/coronaviruscovid19relateddeathsbydisabilitystatusenglandandwales/24january to20november2020)
- Office for National Statistics. Coronavirus and the social impacts on Great Britain [Webpage]. Office for National Statistics; 2021 (www.ons.gov.uk/peoplepopulationandcommunity/healthandsocialcare/disability/articles/coronavirusandthesocialimpactsondisabledpeopleingreatbritain/february2021)
- COVID-19: What people are telling us about their care. Healthwatch UK; 2020 (www.healthwatch.co.uk/report/2020-09-07/covid-19-what-people-are-telling-us-about-their-care)
- Life in lockdown: experiences of living with MS during the coronavirus pandemic. MS Society; 2020. (www.mssociety.org.uk/sites/default/files/2020-08/Life-in-lockdown_UK_Final.pdf)
- Simpson J, Eccles F, Doyle C. The Impact of coronavirus restriction on people affected by Parkinson’s – The Findings from a Survey by Parkinson’s UK. 2020 (www.parkinsons.org.uk/sites/default/files/2020-07/Parkinson%27s UK Covid-19 full report final.pdf)
- MS Society. Life in lockdown 2: experiences of living with MS during the coronavirus pandemic. MS Society; 2020 (www.mssociety.org.uk/sites/default/files/2020-10/Life_in_lockdown_August.pdf)
- Office for National Statistics. Coronavirus and depression in adults, Great Britain [Webpage]. Office for National Statistics; 2020 (www.ons.gov.uk/peoplepopulationandcommunity/wellbeing/articles/coronavirusanddepression inadultsgreatbritain/june2020)
- Family Fund. The end of lockdown? The last six months in the lives of families raising disabled children. Family Fund; 2020 (www.familyfund.org.uk/Handlers/Download.ashx?IDMF=04e5bd74-4411-4b03-9f90-282f10de7b92)
- Glasgow Disability Alliance. Supercharged: A Human Catastrophe. Inequalities, Participation and Human Rights before, during and beyond COVID19. Glasgow Disability Alliance; 2020 (https://gda.scot/resources/supercharged-a-human-catastrophe)
- Scope. The Disability Report. Scope; 2020 (www.scope.org.uk/campaigns/disabled-people-and-coronavirus/ the-disability-report)
- Research Institute for Disabled Consumers. Covid-19: the impact on disabled and older people in the UK [Webpage]. Research Institute for Disabled People; 2020 (www.ridc.org.uk/research-consultancy/our-insights/covid-19-studies/covid-19-impact-disabled-and-older-people-uk)
- Loopstra R. Vulnerability to food insecurity since the COVID-19 lockdown: Preliminary report. Food Foundation; 2020 (https://foodfoundation.org.uk/wp-content/uploads/2020/04/Report_COVID19FoodInsecurity-final.pdf)
- Fawcett Society, LSE and Queen Mary University. Disabled women and Covid-19. Women’s Budget Group; 2020 (www.fawcettsociety.org.uk/disabled-women-and-covid-19)
- GM Disabled People’s Panel. GM Big Disability Survey - Covid19. GM Disabled People’s Panel; 2020 (https://gmdisabledpeoplespanel.com/2020/07/09/gm-big-disability-survey-covid19)
- Signhealth. How has Coronavirus impacted deaf people? Signhealth; 2020 (https://signhealth.org.uk/wp-content/uploads/2020/09/Coronavirus-Impact-Survey-Results.pdf)
- Office of National Statistics. Outcomes for disabled people in the UK [Webpage]. Office for National Statistics; 2021 (www.ons.gov.uk/peoplepopulationandcommunity/healthandsocialcare/disability/articles/outcomesfor disabledpeopleintheuk/2020#employment)
- Turn2us. Two-thirds of disabled workers affected by coronavirus [Webpage]. Turn2us; 2020 (www.turn2us.org.uk/ About-Us/Media-Centre/Press-releases-and-comments/Two-thirds-of-disabled-workers-affected-by-coronav)
- Office for National Statistics. Updating ethnic contrasts in deaths involving the coronavirus (COVID-19), England [Webpage]. Office for National Statistics; 2021 (www.ons.gov.uk/peoplepopulationandcommunity/birthsdeaths andmarriages/deaths/articles/updatingethniccontrastsindeathsinvolvingthecoronaviruscovid19englandandwales/24january2020to31march2021)
- Yates T, Zaccardi F, Islam N, Razieh C, Gillies CL, Lawson CA, et al. Obesity, Ethnicity, and Risk of Critical Care, Mechanical Ventilation, and Mortality in Patients Admitted to Hospital with COVID-19: Analysis of the ISARIC CCP-UK Cohort. Obesity; 2021 (https://pubmed.ncbi.nlm.nih.gov/33755331)
- Public Health England. Beyond the data: Understanding the impact of COVID-19 on BAME groups. Public Health England; 2020 (https://assets.publishing.service.gov.uk/government/uploads/system/uploads/attachment_data/file/892376/COVID_stakeholder_engagement_synthesis_beyond_the_data.pdf)
- Gulliver K. Forty years of Struggle: a Window on Race and Housing, Disadvantage and Exclusion. Human City Institute; 2016 (https://hqnetwork.co.uk/download.cfm?doc=docm93jijm4n2932.pdf&ver=5697#:~:text=’Forty Years of Struggle’ is)
- Cabinet Office. Overcrowded households [Webpage]. Gov.uk; 2020 (www.ethnicity-facts-figures.service.gov.uk/housing/housing-conditions/overcrowded-households/latest)
- Haque Z, Becares L, Treloar N. Over-Exposed and Under-Protected. Runnymede Trust; 2020 (www.runnymedetrust.org/uploads/Runnymede%20Covid19%20Survey%20report%20v3.pdf)
- Office for National Statistics. Employment by occupation – GOV.UK Ethnicity facts and figures [Webpage]. Office for National Statistics; 2020 (www.ethnicity-facts-figures.service.gov.uk/work-pay-and-benefits/employment/employment-by-occupation/latest)
- Proto E, Quintana-Domeque C. COVID-19 and mental health deterioration by ethnicity and gender in the UK. Picone GA, editor. PLoS One. 2021;16(1) (https://dx.plos.org/10.1371/journal.pone.0244419)
- The grass isn’t greener for everyone: why access to green space matters. Ramblers Association; 2020 (http://www.ramblers.org.uk/thegrassisntgreener)
- Existing inequalities have made mental health of BAME groups worse during pandemic, says Mind [Webpage]. Mind; 2020 (www.mind.org.uk/news-campaigns/news/existing-inequalities-have-made-mental-health-of-bame-groups-worse-during-pandemic-says-mind)
- Sharp C, Nelson J, Lucas M, Julius J, McCrone T, Sims D. Schools’ responses to Covid-19: The challenges facing schools and pupils in September 2020. NFER; 2020 (www.nfer.ac.uk/schools-responses-to-covid-19-the-challenges-facing-schools-and-pupils-in-september-2020)
- Bayrakdar S, Guveli A. Inequalities in home learning and schools’ provision of distance teaching during school closure of COVID-19 lockdown in the UK. Institute of Social and Economic Research; 2020 (www.iser.essex.ac.uk/research/publications/working-papers/iser/2020-09.pdf)
- Fawcett Society, London School of Economics and Queen Mary University London. Coronavirus: impact on BAME women. Women’s Budget Group; 2020 (www.fawcettsociety.org.uk/coronavirus-impact-on-bame-women)
- Goudie S, McIntyre Z. The impact of covid-19 on Household food insecurity. Food Foundation; 2021 (https://foodfoundation.org.uk/wp-content/uploads/2021/03/FF_Impact-of-Covid_FINAL.pdf)
- Mind. The mental health emergency: How has the coronavirus pandemic impacted our mental health? Mind; 2020 (www.mind.org.uk/media-a/5929/the-mental-health-emergency_a4_final.pdf)
- West R, Kock L, Kale D, Brown J. Top-line findings on smoking in England from the Smoking Toolkit Study. Smoking Toolkit Study; 2021 (https://smokinginengland.info/resources/latest-statistics)
- Food Foundation. Free School Meal Holiday Provision in England: Parliamentary Facts and Figures Briefing. 2020 (https://foodfoundation.org.uk/wp-content/uploads/2020/06/FSM_Briefing_1506_Final2.pdf)
- Sport England. Active Lives Children and Young People Survey Coronavirus (Covid-19) Report Mid-May to late-July 2020 (the summer term). Sport England; 2021 (https://sportengland-production-files.s3.eu-west-2.amazonaws.com/s3fs-public/2021-01/Active%20Lives%20Children%20Survey%20Academic%20Year%2019-20%20report.pdf?4T i_0V0m9sYy5Hw%20QjSiJN7Xj.VInpjV6)
- Fancourt D, Bu F, Mak HW, Steptoe PA. Covid-19 Social Study: Results Release 29. UCL; 2021 (https://b6bdc b03-332c-4ff9-8b9d-28f9c957493a.filesusr.com/ugd/3d9db5_59d1b940054440bbb52a72b6bd0b0a06.pdf)
- Jordan M, Kane M, Bibby J. A healthy foundation for the future: the final report of the young people’s future health inquiry. Health Foundation; 2019 (www.health.org.uk/publications/reports/a-healthy-foundation-for-the-future)
- Montacute R, Cullinance C. Learning in lockdown. Sutton Trust; 2021 (www.suttontrust.com/wp-content/uploads/2021/01/Learning-in-Lockdown.pdf)
- Andrew A, Cattan S, Costa-Dias M, Farquharson C, Kraftman L, Krutikova S, et al. Learning during the lockdown: real-time data on children’s experiences during home learning. Institute of Fiscal Studies; 2020 (https://ifs.org.uk/uploads/Edited_Final-BN288%20Learning%20during%20the%20lockdown.pdf)
- NFER & Nuffield Foundation. Schools Responses to Covid-19: Pupil Engagement in Remote Learning. NFER; Nuffield Foundation; 2020 (https://mk0nuffieldfounpg9ee.kinstacdn.com/wp-content/uploads/2020/06/NFER_-schools_responses_to_covid_19_pupil_engagement_in_remote_learning.pdf)
- The Children’s Society. Life on Hold Report [Webpage]. 2020 (www.childrenssociety.org.uk/information/professionals/resources/life-on-hold)
- Children’s Commissioner for Wales. Coronavirus and Me Results. Children’s Commissioner for Wales; 2020 (www.childcomwales.org.uk/coronavirus-our-work/coronavirus-and-me-results)
- Doherty K, Cullinane C. COVID-19 Impacts: Apprenticeships. Sutton Trust; 2020 (www.suttontrust.com/our-research/covid-19-impacts-apprenticeships)
- YMCA. Back on Track: Supporting Young People Out of Lockdown. YMCA; 2020 (www.ymca.org.uk/wp-content/uploads/2020/08/ymca-back-on-track.pdf)
- Leavey C, Eastaugh A, Kane M. Generation COVID-19 [Webpage]. Health Foundation; 2020 (www.health.org.uk/publications/long-reads/generation-covid-19)
- TeenCovidLife Survey – General report on health and wellbeing of young people in lockdown [Webpage]. Generation Scotland team at the University of Edinburgh; 2020 (www.ed.ac.uk/generation-scotland/what-have- we-found/latest-news/teencovidlife-one)
- Carers Trust. Steep decline in mental health of young carers and young adult carers following Coronavirus outbreak [Webpage]. 2020 (https://carers.org/news-and-media/news/post/51-steep-decline-in-mental-health- of-young-carers-and-young-adult-carers-following-coronavirus-outbreak)
- YoungMinds. Coronavirus: Impact on young people with mental health needs: Survey 3: Autumn 2020 - return to school. YoungMinds; 2020 (https://youngminds.org.uk/about-us/reports/coronavirus-impact-on-young-people-with-mental-health-needs)
- Health Foundation. Listening to our future. Health Foundation; 2018 (www.health.org.uk/publication/listening-our-future)
- Powell A, Francis-Devine B. Coronavirus: Impact on the labour market Research Briefing. UK Parliament; 2021 (https://commonslibrary.parliament.uk/research-briefings/cbp-8898)
- Office for National Statistics. Coronavirus and changing young people’s labour market outcomes in the UK [Webpage]. Office for National Statistics; 2021 (www.ons.gov.uk/employmentandlabourmarket/people inwork/employmentandemployeetypes/articles/labourmarketeconomicanalysisquarterly/march2021)
- Henehan K. Uneven steps: Changes in youth unemployment and study since the onset of Covid-19. Resolution Foundation; 2021 (www.resolutionfoundation.org/publications/uneven-steps)
- Montacute R, Holt-White E. Covid-19 and the University Experience. Sutton Trust; 2021 (www.suttontrust.com/our-research/covid-19-and-the-university-experience-student-life-pandemic)
- Prince’s Trust. Youth Index. Prince’s Trust; 2021 (www.princes-trust.org.uk/about-the-trust/research-policies-reports/youth-index-2021)
- Bangham G, Gardiner L, Rahman F, Clarke S, Judge L, Tomlinson D. An Intergenerational Audit for the UK: 2020. Resolution Foundation; 2020 (https://www.resolutionfoundation.org/publications/intergenerational-audit-uk-2020)
- Judge L, Pacitti C. Coping with housing costs, six months on… Resolution Foundation; 2020 (www.resolutionfoundation.org/publications/coping-with-housing-costs-six-months-on)
- Groundswell. Monitoring the impact of COVID-19: Forthnightly Homelessness Briefing 2. Groundswell; 2020 (https://groundswell.org.uk/wp-content/uploads/2020/05/COVID-19-Fortnightly-Briefing-2-4.05.20.pdf)
- Homeless Link. The number of people sleeping rough continues to decrease in England, but ongoing effort is paramount [Webpage]. Homeless Link; 2021 (www.homeless.org.uk/connect/blogs/2021/feb/25/number-of-people-sleeping-rough-continues-to-decrease-in-england-but)
- New Policy Institute. Rough sleeping in London: Back to the old normal, not building back better [Webpage]. New Policy Institute; 2021 (www.npi.org.uk/blog/housing-and-homelessness/rough-sleeping-london-back-old-normal-not-building-back-better)
- Braithwaite I, Edge C, Lewer D, Hard J. High COVID-19 death rates among people in prison in England and Wales, and the need for early vaccination. Lancet Respiratory Medicine. 2021 (https://doi.org/10.1016/S2213-2600(21)00137-5)
- Brunton-Smith I, McCarthy DJ. The effects of prisoner attachment to family on re-entry outcomes: A longitudinal assessment. Br J Criminol. 2017;57(2):463–82 (https://academic.oup.com/bjc/article/57/2/463/2623932?login=true)
- Joint Committee on Human Rights. The Government’s response to COVID-19: human rights implications [Webpage]. UK Parliament; 2020 (https://publications.parliament.uk/pa/jt5801/jtselect/jtrights/265/26508.htm#_idTextAnchor067)
- Minson S. The impact of COVID-19 prison lockdowns on children with a parent in prison. University of Oxford; 2021 (www.law.ox.ac.uk/content/impact-covid-19-and-prison-lockdown-children-imprisoned-parent-uk)
- Children Heard and Seen. Life In Lockdown 2020 Report. 2020 (http://childrenheardandseen.co.uk/2020/10/08/life-in-lockdown-2020-report)
- Edge C. Covid-19 and the prison population: Evidence briefing for the Covid-19 Impact Inquiry [unpublished]. 2021
- Smith N. The Health Foundation’s COVID-19 Impact Inquiry: Absent voices of women experiencing complex challenges during the pandemic, submission from Changing Lives (unpublised). 2021.
- Health Foundation. Pandemic poverty – polling shows public support for permanent uplift to Universal Credit [Webpage]. Health Foundation; 2020 (www.health.org.uk/news-and-comment/newsletter-features/pandemic-poverty-polling-shows-public-support-for-permanent-uplift-to-Universal-Credit)
- King’s College. Coronavirus in the UK: The Policy Institute has been tracking public attitudes, beliefs and behaviour throughout the coronavirus crisis [Webpage]. King’s College London (www.kcl.ac.uk/policy-institute/research-analysis/coronavirus-in-the-uk)
- Thorlby R, Tallack C, Finch D, Idriss O, Rocks S, Kraindler J, et al. Spending Review 2020 [Webpage]. Health Foundation; 2020 (www.health.org.uk/publications/long-reads/spending-review-2020)
- Resolution Foundation. 200,000 employees return to work in grand reopening hiring surge – but UK still has a ‘Covid employment gap’ of almost three million workers [Webpage]. Resolution Foundation; 2021 (www.resolutionfoundation.org/press-releases/200000-employees-return-to-work-in-grand-reopening- hiring-surge-but-uk-still-has-a-covid-employment-gap-of-almost-three-million-workers)
- Bank of England. Monetary Policy Report [Webpage]. Bank of England; 2021 (www.bankofengland.co.uk/ monetary-policy-report/2021/may-2021)
- Emmerson C, Joyce R, Waters T. The temporary benefit uplift: extension, permanence, or a one-off bonus? [Webpage]. Institute of Fiscal Studies; 2021 (www.ifs.org.uk/publications/15266)
- Francis-Devine B. Coronavirus: Impact on household savings and debt. 2021 (https://commonslibrary.parliament.uk/research-briefings/cbp-9060)
- Cribb J. The persistent myth about the financial crisis and living standards [Webpage]. Institute For Fiscal Studies; 2018 (https://ifs.org.uk/publications/13261)
- Bangham G. The times they aren’t a-changin’: Why working hours have stopped falling in London and the UK. Resolution Foundation. 2020 (www.resolutionfoundation.org/publications/the-times-they-arent-a-changin)
- Trends in insecure work, by contract type [Webpage]. Health Foundation; 2021 (https://health.org.uk/evidence- hub/work/job-security/trends-in-insecure-work-by-contract-type)
- Hood A, Phillips D. Substantial cuts made, but biggest changes to the benefit system yet to come [Webpage]. Institute For Fiscal Studies; 2015 (https://ifs.org.uk/publications/7541)
- HM Treasury. Summer Budget 2015. Gov.uk; 2015 (https://assets.publishing.service.gov.uk/government/uploads/system/uploads/attachment_data/file/443232/50325_Summer_Budget_15_Web_Accessible.pdf)
- Resolution Foundation. Super, smashing, great: Spring Statement 2019 response. Resolution Foundation; 2019 (www.resolutionfoundation.org/publications/super-smashing-great-spring-statement-2019-response)
- Emmerson C. Two parliaments of pain: the UK public finances 2010 to 2017. IFS; 2017 (www.ifs.org.uk/uploads/publications/bns/BN199.pdf)
- Britton J, Farquharson C, Sibieta L. 2019 annual report on education spending in England. IFS; 2019 (www.ifs.org.uk/publications/14369)
- Elwell-Sutton T, Tinson A, Greszczuk C, Finch D, Holt-White E, Everest G, et al. Creating healthy lives: A whole-government approach to long-term investment in the nation’s health. Health Foundation; 2019 (www.health.org.uk/publications/reports/creating-healthy-lives)
- Buchan J, Bell J, Shembavnekar N, Charlesworth A. Building the NHS nursing workforce in England. Health Foundation; 2020 (www.health.org.uk/publications/reports/building-the-nhs-nursing-workforce-in-england)
- Public Health England. Health matters: health and work [Webpage]. Gov.uk; 2019 (www.gov.uk/government/publications/health-matters-health-and-work/health-matters-health-and-work)
- Bryan ML, Bryce AM, Roberts J. Presenteeism in the UK: Effects of physical and mental health on worker productivity. The University of Sheffield, Department of Economics; 2020 (https://ideas.repec.org/p/shf/wpaper/ 2020005.html)
- Hughes A, Wade KH, Dickson M, Rice F, Davies A, Davies NM, et al. Common health conditions in childhood and adolescence, school absence, and educational attainment: Mendelian randomization study. NPJ Sci Learn. 2021;6(1) (www.nature.com/articles/s41539-020-00080-6)
- OECD. The territorial impact of COVID-19: Managing the crisis across levels of government. OECD; 2020 (www.oecd.org/coronavirus/policy-responses/the-territorial-impact-of-covid-19-managing-the-crisis-across-levels-of-government-d3e314e1)
- HM Treasury. Spending Round 2019: Chancellor Sajid Javid’s speech [Webpage]. Gov.uk; 2019 (www.gov.uk/government/speeches/spending-round-2019-sajid-javids-speech)
Acknowledgements
The authors would like to thank Tim Elwell-Sutton for his role in the setting up of this inquiry and our colleagues at the Health Foundation who have contributed greatly to its delivery including: Rachel Cresswell, Jenny Cockin, Sean Agass and Rita Ranmal. Thanks also to colleagues Hardeep Aiden, Anne Alarilla, Hugh Alderwick, Dominique Allwood, Miqdad Asaria, Usha Boolaky, Lucy Brinkley, Jennifer Dixon, Alex Franklin-Cheung, Maeve Gordon, Cara Leavey, Alice Major, Kathryn Martszalek, Anita Mehay, Clara Morrish, Ann Raymond, Mai Stafford, Charles Tallack, Toby Watt, Suzanne Wood and former colleagues Thomas Abrams and Alex Eastaugh.
We would also like to thank the individuals and organisations who submitted to our call for evidence and contributed to our research including: Research Matters, Kantar Public Ltd, the Good Things Foundation, Simon Stewart at the University of Portsmouth, Chantal Edge, Nadine Smith, Changing Lives, Manish Pareek at the University of Leicester, Bridget Lockyer on behalf of Bradford CSAG and interview participants from the Health Foundation inclusion panel. And thanks also to Grayling and Eleanor Stanley for their ongoing support
Finally, we would like to thank Dame Clare Moriarty and the Expert Advisory Panel who steered the inquiry from its inception. We would also like to thank Peter Goldblatt, Liz Sayce, Auriol Miller, Sarah Davidson, Suzanne Costello and Joanna Purdey for their expert guidance and contributions.
Errors and omissions remain the responsibility of the authors alone.