Acknowledgements
The authors are grateful to REAL Centre colleagues for their input, support and guidance and, in particular, Toby Watt for his analysis of consultations and diagnoses in general practice.
The Strategy Unit
The Strategy Unit provided the detailed analysis and modelling of activity in chapter 4, alongside guidance and comments, with particular thanks to:
Steven Wyatt, Paul Seamer, Peter Spilsbury.
We would like to thank the following:
- The members of the REAL Centre Oversight Board for their comments and advice: Sir Andrew Dilnot, Professor James Buchan, Professor Michael Chernew, Dr Jennifer Dixon, Raj Jain, Branwen Jeffreys, Professor Ashwin Kumar, Gabrielle Mathews, Mark Pearson.
- Ben Gershlick, Rosie Hamilton, James Lewis, Nihar Shembavnekar and Ruth Thorlby who reviewed the report.
- Members of the Health Foundation communications team, particularly: Kate Addison, Sean Agass, Creina Lilburne and Pete Stilwell.
Errors and omissions remain the responsibility of the authors alone.
When referencing this publication please use the following URL: https://doi.org/10.37829/HF-2020-RC10
Executive summary
An understanding of the past helps us to prepare for the future. In this, the REAL Centre's first report, we look back at the care and treatment provided by the NHS in England over the past two decades – as measured by health care activity. Measures of activity – what the NHS does – form the basis of much NHS planning. Together with measures of quality, these are used as proxies for understanding the contribution the NHS makes to population health. Understanding the drivers of this activity is therefore crucial to service and resource planning.
In this report, we provide a framework for understanding the drivers of health care activity. We describe how supply and demand side factors interact, and how policy can influence the care the NHS provides. We look at the overall trends in activity and how specific services have changed. Where possible, we estimate the proportion of any change that can be explained by four demographic factors: population size, age, gender, and proximity to death. We then explore what drives the remaining change, unexplained by demography.
Although we focus on England, many of the lessons may be relevant to the other countries of the UK. We take an in-depth look at emergency and planned hospital care, mental health, community and primary care, but do not look in detail at areas such as high cost drugs or highly specialised services. Social care, too, is beyond the scope of this initial report but will be the focus of subsequent analysis by the REAL Centre.
NHS activity since 2000
Between 2000/01 and 2017/18, the amount of NHS-funded care in England, either delivered by NHS hospitals or other providers, more than doubled – increasing by 114%, an annual average of 4.6% a year. We estimate that hospital activity increased 4.7% per year, with planned care (6.1%) growing by almost 2.5 times the rate of emergency care (2.6%).
Overall, our analysis suggests that the amount of care provided by the NHS since 2000/01 would have needed to grow by less than 1% a year to meet the demand pressures arising from demographic changes. This means that more than three-quarters of the growth in NHS care since 2000/01 is the result of other factors relating to demand, supply, political priorities and health care policies.
While overall health care activity has grown substantially, this growth has not been shared equally between services. Consultations in general practice have grown just 0.7% per year, while planned procedures increased 9.6%. The different growth rates seen between services, combined with changes to the cost of different activities, have produced a major shift in the composition of spend towards hospital-based care and away from other areas.
The expansion in activity means the population receives significantly more health care today, which has contributed to lower mortality rates for a range of conditions and, up until 2010, increasing life expectancy. However, improvements and increases in care have not been uniform over the past two decades. Between 2000/01 and 2010/11 activity rose by 5.3% a year, quality of care improved, and life expectancy grew by nearly 3 months a year for women and almost 4 months a year for men. As funding slowed after 2010 so too did activity. Between 2010/11 and 2017/18 activity grew by 3.6% a year, quality gains slowed and life expectancy has stalled overall and for some groups declined (notably for women younger than 50 in deprived areas). But it is not just life expectancy that has changed. Over the past two decades the amount of life spent living with long-term health conditions has increased and more people are living for prolonged periods with multiple long-term health problems.
New technologies, changes in prices, and the increasing availability of information about treatments have increased clinician and public expectations about what the NHS can and should provide. Medical advances have meant more treatments can be provided without the need for patients to stay overnight in hospital and more can be done in outpatient departments or as day cases. This means that while the number of people being treated in NHS hospitals has increased, the number of bed days for unplanned admissions fell 1.1% per year.
New services have been established. For example, NHS 111 and Urgent Treatment Centres (UTCs) were introduced with the aim of moderating demand in other areas of emergency care. Both have seen substantial growth. Changes to the workforce have also determined service use. Slow growth in consultations in general practice, for example, is reflected in slow growth in the number of GPs. Meanwhile, an expansion in hospital consultants has supported the rapid increase in outpatient appointments and elective procedures.
Underpinning many of these drivers, particularly around the supply of health care, are political and policy choices. The level of funding the NHS receives is a political choice. Unsurprisingly funding growth is related to activity growth. In the first decade of the century, health spending in England grew by 6.0% a year; in the second it grew by 1.3%.
Government’s shifting priorities for the NHS over the past two decades have also shaped the pattern of growth. In the early 2000s there was a focus on reducing waiting times and improving outcomes particularly for the ‘big killers’ of cancer, stroke and cardiovascular disease. A mix of additional NHS funding and a range of policies from financial incentives, to the maximum 18-week wait from referral-to-treatment target help explain the rapid growth in elective procedures. In the 2010s, in the face of lower funding growth the focus shifted to efficiency gains, contributing to the slowdown in activity growth.
Across the past two decades, much of the policy narrative was about shifting the focus of care away from acute services towards community and primary care to prevent avoidable admissions and manage care more proactively. There is little sign of this policy goal being achieved.
Lessons for the future
Looking at the overall changes in the volume and pattern of care provided over the past two decades, there has been remarkable success in some areas in expanding treatment to benefit the health of the population. Because these changes happen gradually, they are not always recognised, and the NHS can instead be portrayed as rigid or slow at adopting innovation. In fact, changes have been substantial.
However, it is also clear that some changes have been despite – rather than because of – the stated policy goals of successive governments and system leaders. Policy intent has not always been matched by a coherent programme of policy and investment decisions needed to translate rhetoric into reality – the misalignment of workforce plans and service delivery plans is an obvious and stark example.
Our analysis leads us to suggest six lessons for the future.
- In the long term, what the health care system does is largely determined by choices. Clear population health goals are needed to help steer these choices. The contribution of demographic factors to growth is relatively small. Other drivers of changes are not well understood, but are within the influence of policymakers if we consider the full range of policy instruments available, especially over a longer time horizon. We need clearly stated population health goals against which to judge the decisions taken.
- A better understanding of the contribution of different services to population health goals, and what this means for the future composition of NHS services, is required. Activity growth has not been spread equally across services. For example, we have seen a rapid growth in hospital services compared to community-based services. We need to better understand the contribution of different services to improving healthy life expectancy and reducing inequalities in health across the country and between population subgroups.
- Systematic national projections of future trends in morbidity are needed to inform national and local NHS planning. If changes to the composition of NHS services are to meet the future health needs of the population, we need good projections of those needs. As the types of services needed by different groups of patients differ – from cancer to mental health – projections need to cover different forms of morbidity, and, increasingly, multi-morbidity.
- There is a need for more sophisticated models of future activity and health outcomes, incorporating other important drivers of growth, including policy choices, as well as demographic factors. The debates about future pressures on the NHS often pay too little attention to supply-side factors, such as workforce or new technologies, in shaping the care provided. We do not have a good enough understanding of the role that drivers beyond demography play in activity growth, such as the changing composition of the workforce. Consequently, they are rarely included in future projections of activity.
- Technology plays a major role in shaping both demand (a new treatment makes it possible to address an unmet need) and supply (drug therapies replacing complex surgery). The UK is a world leader in research and the NHS makes a vital contribution to supporting clinical trials. Innovation is inherently unpredictable and complex, but there are also several choices in what gets developed and adopted. It is vital that we better understand the forces shaping those decisions and the impacts this has on the health system.
- Shifts in activity take time and there is a need to be realistic about what can be achieved. For example, reducing avoidable emergency admissions has been a long-standing policy goal and, since 2010, has been an aim of the various national integrated care programmes. However, although there has been some evidence of modest success, the ambitions for these programmes exceeded what has been achieved. We need a better understanding of the wider drivers of activity in order to set realistic ambitions and timeframes.
Trends over the past 20 years show how widely investment and growth in services has varied, with hospital care winning out over primary and community care. Numerous factors have driven these changes, but the changing size and age structure of the population plays a relatively minor role. New technologies and drugs, as well as political, policy and planning choices, are among the most potent influences shaping investment. There has been no systematic analysis of how these factors have shaped care over the past two decades. Nor any serious overarching attempt to match the substantial investment we as a society make in the NHS with the health needs of the population.
We cannot know the future and no amount of research and modelling can eliminate this inherent uncertainty – coronavirus (COVID-19) has vividly shown this. But managing uncertainty and anticipating change is the job of policymakers and planners. Health systems are built over many years: hospitals take time to build, staff need years of training, and knowledge and relationships are developed over time. To make the best decisions and to sustain the NHS, what is needed is a strategy for investment based on evidence, analysis and modelling. This needs to be adaptable regionally to allow for differences in population health and health care systems. Above all, this needs to be guided by a ruthless focus on the founding principle of the NHS – to improve health and wellbeing and ensure that care is based on need, not the ability to pay.
* This is cost-weighted. See section 3 for further detail.
Introduction
Health accounts for a large and growing share of public spending
Health care is one of the largest parts of the UK economy, accounting for 10% of GDP. In common with most industrialised nations, the majority of health care spending is publicly funded. In 2018/19, publicly funded health spending in England totalled £127.0bn and represented more than a fifth of total expenditure on services.
The NHS is by far the largest part of the publicly funded health care system in the UK. It is a vital part of the welfare state, providing care to both improve population health and relieve pain and suffering. As well as providing care, the NHS acts as an insurer so that people do not have to plan for potentially high health care costs, removing a source of fear and anxiety and preventing exclusion from treatment. As a universal, free at the point of use service (with charges in only a few areas), the NHS is in the top three of 22 OECD countries in terms of low financial barriers to care.
The impact the NHS has on people’s health extends well beyond its role as a provider of treatment. The NHS has an important role to play in addressing health inequalities. This includes ensuring access to care is based on need rather than the ability to pay, but also in providing prevention services that help to reduce some of the health impacts of socioeconomic disadvantage. As large employers, purchasers, and capital asset holders, health care organisations are well positioned to use their spending power and resources to address the adverse social, economic and environmental factors that widen inequalities and contribute to poor health.
Health care has also been a growing part of the welfare state. With so much spending coming from public funds this impacts public finances. Since 1948 overall public spending as a share of GDP has not increased (remaining at ~40%) so health care spending accounts for an increasing share of overall public spending. This is in part due to reductions in public spending in other areas (such as defence) by successive governments. In recent years concerns have been raised that additional health care spending is ‘crowding out’ spending on other public services – specifically education and social care, which play vital roles in safeguarding health and wellbeing.
For these and other reasons, government decisions about the amounts that are allocated to health care and how the money is spent must be informed by the best evidence and analysis, with careful consideration of trade-offs.
The NHS is shaped by decisions at all levels
Decisions about the NHS are taken at many different levels, and each decision offers a range of choices and trade-offs for decision makers to consider. These can range from national policy and strategic choices about the overall level of funding for the NHS and the goals and priorities the NHS should target (eg better cancer care), to regional and local decisions about the funding and design of different types of services. Decisions are also taken by individuals, such as by clinicians about the treatment options they discuss with patients and the time they spend with them, and by patients themselves (eg whether to attend A&E or another service). Collectively these decisions affect every aspect of how health services are delivered: how much money the country chooses to spend on health and care in comparison to other areas; what we do and do not spend that money on; and who benefits from that spend.
Decisions also need to take account of the context in which health services are funded and delivered, which changes over time. As the future unfolds, new challenges and opportunities emerge and new information becomes available, meaning that decisions need to be continually revisited and adjusted. It is the role of policymakers to make decisions that enable the NHS to adapt, respond and take advantage of these changes. This means taking account of the long term as well as the short term.
As COVID-19 has vividly shown, uncertainty about the future makes this far from straightforward. But policymakers cannot avoid long-term decisions – it takes more than a decade to train a doctor; and buildings, equipment and the IT infrastructure last for many years and shape the context in which care is provided.
Further, we know that there are a number of cognitive biases that can affect decision making, including in health. For example, the planning fallacy causes consistent underestimation of the time it takes to complete a given task and diminishes the relevance of past experience. There is a need to be aware of the potential for bias in decision making and ensure the assumptions on which decisions are based are supported by evidence.
Long-term and strategic decision making
Policymakers and system leaders need to balance two goals:
- ensuring that today’s service is effective and efficient, while
- planning and investing to ensure that the service can adapt to potential future changes.
The House of Lord’s Select Committee on the Long-term Sustainability of the NHS argued that despite the enduring nature of the NHS, which is now over 70 years old, it is held back by an excessive policy and leadership focus on the first of these goals – the short term.
Despite enduring institutions and a permanent civil service, myopia is still problematic across many areas of policy. Our current political system, with 4 to 5-year electoral cycles and highly centralised accountability for ministers, is a large driver of this. Recognising the negative consequences of short-termism in economic and fiscal policy, governments have sought to counterbalance this with bodies that are explicitly tasked with a longer term and systemic focus, such as the Office for Budget Responsibility. To date these have been focused on the economic infrastructure. However, the challenge for much of the welfare state infrastructure is no less and, as COVID-19 has shown, they are interconnected.
Yet while short-termism is a key challenge, it is not the only one. Other areas in which decision making could be improved are:
- The allocation of resources to different aspects of the health and care system. For example, there is a clear and increasing imbalance between spending on health care and social care.
- Alignment between desired service delivery models and the workforce plans, capital investment and funding allocations to achieve them. For example, despite intentions to move care from hospital into the community, the number of district nurses and health visitors have declined in recent years.
- Incorporating public opinion so that the level and quality of care provided by the health care system matches public expectations and reflects what the public (as taxpayers) are prepared to pay for. Public opinion tends to be taken into consideration at a moment of crisis following years of low spending. This then leads to a period of catch-up, compounding the tendency towards ‘feast and famine’.
Improving the evidence base for better decision making
The COVID-19 pandemic has put the relationships between researchers and policymakers, and between evidence and policy, under the spotlight. In some ways the pandemic has shown how well research and policy can come together, rapidly producing and sharing evidence.
However, it also highlighted challenges in ensuring evidence is comprehensive, readily accessible and easy to understand and interpret. For example, it has been difficult to assess the trade-offs in policies that seek to minimise the direct burden of COVID-19 on hospitals, but impose costs on those with other health conditions and on the economy and society more generally.
More broadly, there are systemic weaknesses in:
- the information base, and depth of understanding of the key demand and supply trends that influence health and social care
- the understanding of the policy and service design implications and choices resulting from those trends
- the accountability of policymakers for the longer term implications of current decisions on the resourcing and design of health and social care
- the overall approaches to planning for the long term, specifically how to deal with uncertainty over future scenarios and risk.
The role of evidence and analysis
Although most decisions will involve elements of value judgement – such as the desired balance of spending between younger or older people – high-quality evidence and analysis play a vital role in informing decisions. This often involves comparing the costs and outcomes of different options over different future time horizons and requires two major elements:
- Understanding the future trends and scenarios shaping the world in the absence of any change. For example, changes in the prevalence of long-term conditions.
- Understanding the consequences of different policy choices against the backdrop of these trends and scenarios. In some cases, policy choices may affect the trends (eg improved health care could change the prevalence of long-term conditions).
Modelling plays an important role in both. But any model is only as good as the assumptions it is based on. Studying what has happened in the past can help us generate and challenge assumptions and understand more about the underlying dynamics of a situation. For example, the decision about how much outpatient activity is needed to meet population demand could be based on a model that includes: population size and age, levels of morbidity, technological advances and costs, clinician behaviour, and public expectations. However, assumptions about many of these aspects and how they interact are highly uncertain. Even learning from the past may not be useful for all future challenges. It is therefore important to balance learning from the past with robust approaches to planning for the future and dealing with uncertainty.
Learning from trends in NHS activity
NHS activity refers to what the NHS does. It is used as a proxy for the NHS’s role in improving the health and wellbeing of the population, particularly in the absence of a full range of outcome measures. While there are many factors affecting population health, the amount and quality of care the NHS provides is one key factor. Influencing the volume and quality of activity is therefore a crucial way that policymakers seek to influence outcomes.
Measures of activity are widely used throughout the NHS. Activity measures are often used as the basis of contracts between a commissioner and a provider and are used to track the use of services and to identify and monitor trends. Estimates of future activity are also widely used as inputs to many important decisions about the NHS. Decisions on major capital builds, such as new hospitals, are based highly on activity projections, as are decisions about funding and workforce training places.
Although future projections of activity are important and widely used for planning, what drives activity over the medium term is not always well understood. This report aims to help national and local policymakers better understand trends in activity, in the hope this will aid better planning. We outline a framework for understanding health care activity that includes changes in demand, changes in supply, and political and policy choices. We then describe trends in activity and, where possible, we have modelled the proportion of any change that can be explained by population size, age, gender, and proximity to death. We then suggest explanations for the remaining growth using the factors described in our framework, before suggesting lessons for the future.
† In 2018/19 terms, using the GDP deflator provided by the OBR.
A framework for understanding health care activity
Key points
- The factors influencing health care activity are wide ranging and complex. We introduce a framework to help illustrate how these factors interact.
- The supply of health care is determined by the amount of health funding and the availability of inputs (such as staff, medicines and diagnostic equipment).
- A range of factors influence demand for health care, including: the size of the population, age structure and health status, the availability of treatments and individual choices about when to seek health care.
- Where a patient’s need for health care is not met, a gap emerges. There is nearly always a gap, but a widening gap creates pressures for action.
- There are several things policymakers and planners can do in response: increase funding, change what funding is spent on, or increase efficiency. The challenge is choosing the right intervention.
Health care activity framework
In the UK most health care is publicly funded and free at the point of access. This is important context in framing how we think about the supply of and demand for health care and the interaction between the two. Even when left to market forces, the market for health care behaves differently to the market for other goods and services. One significance of public funding, however, is that the patient is not aware of the price of care at the point of receiving it, and often neither is the supplier. This is important, as in markets for other goods and services, price acts as a signal to both suppliers and consumers that helps establish a price at which supply and demand balance.
Overall, this means that demand for health care will almost always exceed supply, as price/cost will not constrain demand as it does in a private market. Given a limited budget, governments must use other mechanisms to allocate the finite supply of publicly funded health care. These mechanisms include the scope of services, National Institute for Clinical Excellence (NICE) guidelines, clinical thresholds for care and waiting lists. Government can exert control through policy choices, with one key decision being the amount of public funding allocated to health care. This, in part, determines how much supply of health care the government will fund to meet demand, although other factors are also important. For example, workforce policies: the government may state an intention to increase funding to recruit more nurses, but training, immigration and other workforce policies will influence the potential supply too. When supply for health care meets a demand for health care, we see this as health care activity.
The interactions between policy, funding, supply, demand and activity are captured in the diagram (Figure 1). When taking decisions, policymakers and system leaders must consider how to balance these factors, both to achieve short-term goals and to ensure the longer term resilience and efficiency of the system. Doing both is often impossible and trade-offs need to be made.
Figure 1: Framework for health care activity
4
2
3
1

Funding and supply of health care
Gap
Policy
Health care activity
Demand for health care
[1] Funding determines how much supply (staff, facilities, drugs and technology) can be afforded
In England the amount of NHS funding depends on the overall amount of government spend (mostly raised through taxation) and the proportion allocated to health. Funding is used to purchase inputs to health care activity, including labour (staff), goods and services (drugs, equipment) and capital assets (buildings and machinery). The overall efficiency of the system depends on realising the optimal combination of inputs. The availability of inputs, which helps determine the unit cost (total expenditure incurred to produce one unit of output, such as an appointment with a physiotherapist), depends on long-term decisions such as investment in capital and in the workforce training pipeline.
Other forces help to determine unit costs. For instance, health care is labour intensive, and it competes with other sectors of the economy to recruit staff. Historically, productivity has risen faster in other sectors, such as manufacturing, driving wage increases. The health care sector must in turn match these wage increases in order to recruit enough staff, but it is often unable to make equivalent productivity gains due to the labour intensity of health services. This is known as Baumol’s cost disease, and is posited as one reason for rising health care costs over time.
[2] The demand for health care is driven by a complex combination of factors
Firstly, demographic factors, including the size, age and gender profile of the population. All else being equal, a growing population increases demand for health care, and vice versa. Age profile is also important: almost everyone uses health care services but use generally increases with age because of its association with morbidity and proximity to death – the latter of which independently drives some health care use. Socioeconomic deprivation and ethnicity can also affect demand for services.
Demand is also influenced by changes in the underlying health of a population (changes to disease prevalence and condition specific mortality rates) and by technological and medical advances. A new treatment for a previously untreatable cancer will increase demand for care, but a new vaccine that eliminates a condition will lead eventually to a decrease (eg the polio vaccine). New innovations can also influence the type of services demanded (for example, advances in surgical techniques have led to many operations being performed as day surgeries).
Therefore, a health care need exists where there is an identified health need for which there is an acceptable treatment. This hints at the importance of patient behaviour and knowledge, and societal norms in determining health care demand (eg do I recognise I have a health need?). However, demand for health care goes beyond this definition. Firstly, health care is about more than just treatment and includes activities such as prevention. Secondly, policies and factors outside of health can impact on demand. For example, the wider determinants of health are important. There is therefore a tension between the provision of health care activities that meet a present need and other activities that might reduce future need, but are less urgent and for which there may not be explicit demand.
[3] When demand grows more than activity, there will be a gap – but interactions are sometimes more complex
A demand for health care may be met with a corresponding supply of health care, which in turn may lead to activity and improved health outcomes. However, not all demand for health care is met, resulting in a gap between demand and activity. There will nearly always be some kind of gap as the NHS has finite resources and not all health care needs are treated or identified.
However, the size of the gap may vary over time: in a period where demand is growing faster than supply, it will widen. This is often measured in terms of waiting times, for instance for A&E or elective care, although a gap can also manifest in health outcomes or in access to care. What gets measured will influence how gaps are identified.
Moreover, the relationship between the supply of and demand for health care is complex and dynamic. Increasing supply may not always reduce the size of the gap – it may also increase demand. For example, making it easier for patients to access a service by introducing a telephone helpline, may lead more patients to seek care than previously. This is sometimes referred to as supplier-induced demand: the provision of health care that is led by supply factors and not necessarily in response to an explicit demand.
[4] Governments can try to influence the size of the gap through their policy choices
Action by policymakers or planners can affect the size of the gap between health care demand and supply. Very broadly, there are three potential areas of action: change the amount of resources; change the allocation of resources; change the efficiency with which resources are used. What the government does will depend on the context and its understanding of the nature of the gap.
If a widening gap is due to a sustained period where activity growth has not kept pace with demand and, for example, waiting times for treatment increase, there will be political pressure to increase activity. This generally leads to calls to increase funding. However, spending more means raising taxes or reducing spending on other services, neither of which may be desirable or popular.
Simply increasing activity may also be insufficient if the answer is not ‘more activity’ but ‘different activity’. Governments may then try to reallocate resources within the system to meet a specific area of demand. Or they may look to moderate demand itself, perhaps through preventative programmes (eg smoking cessation) or by shifting expectations of services (eg campaigns to reduce A&E use). Not all these decisions are taken centrally, with local commissioners setting priorities for their areas.
Governments may also look to increase productivity (or efficiency): to do more with the same resources. This may be by reducing costs (eg by using generic medications rather than branded), or reducing spare capacity (eg by maximising bed occupancy). Further options include rationing the availability of services through higher thresholds for care, and the systematic elimination of activities that are not deemed cost effective. However, the options for making efficiency gains are limited and, in some cases, have natural restrictions as to what they can achieve (eg there is a limit to how far the number of beds can be reduced).
The challenge for both national and local decision makers is to choose the right intervention at the right time.
Analysis of overall health care activity
Key points
- The amount of NHS funded care in England increased by 114% between 2000/01 and 20017/18 – a more than doubling in less than 2 decades.
- Growth in activity partly reflects demographics. Demand grew steadily as the population grew, aged, and the prevalence of co-morbidities increased.
- The growth also reflects policy decisions. Government increased funding for the NHS sharply during the 2000s (6.0% per year).
- Funding was primarily used to increase capacity, with more staff recruited and investment in new equipment and buildings – although bed capacity decreased as new technologies meant less activity required a hospital stay.
- Funding was accompanied by other reforms to increase activity – targets to reduce waiting times, activity-based payments and increasing use of the private sector – which mostly focused on hospital-based services.
- After the financial crisis of 2008, funding growth fell back. Slower growth in the supply of health care led to efforts to moderate activity growth and increase efficiency.
NHS activity has more than doubled
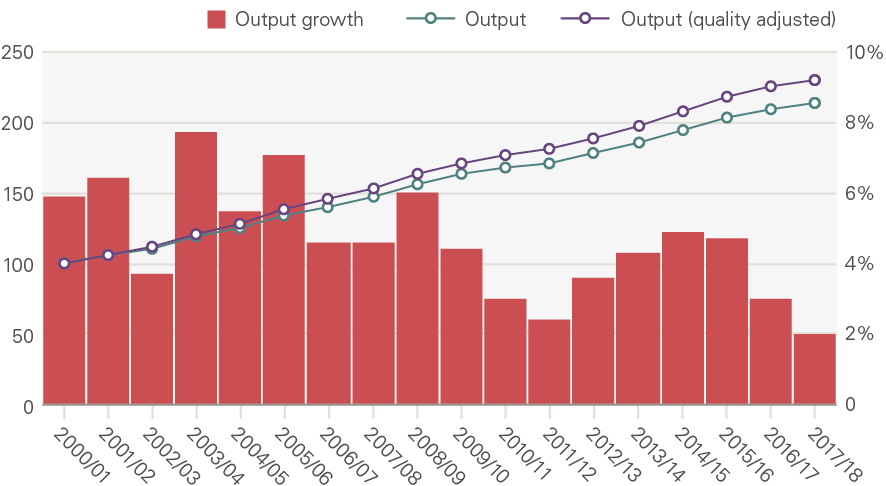
The Office for National Statistics (ONS) calculate that between 2000/01 and 2017/18, the overall amount of health care provided to patients by the NHS in England more than doubled – a 114% increase, or 4.6% per year (Figure 2). This is based on ONS’s aggregate measure of health care output, which combines two things: the volume of activity weighted by the cost. Cost is used to weight different activities, recognising these differ in scale and complexity – for example, an emergency admission to hospital is normally more expensive than a GP consultation.
Recognising that the quality of care also matters, the ONS further adjusts for changes in survival rates, outcomes and responsiveness to patients. Quality adjusted (QA) care provided by the NHS increased by 131% between 2000/01 and 2017/18. Growth in output was higher in the first decade, at 5.3% per year between 2000/01 and 2010/11 (5.8% QA); slowing to 3.6% per year between 2010/11 and 2017/18 (3.9% QA).
Figure 2: Health care output and quality adjusted output (index, 2000/01 = 100); annual output growth (%)
Source: ONS
Growth in output varies by type of activity
The ONS reports output for four broad service areas (more detailed reporting is complicated by changes in data recording over time). Between 2000/01 and 2017/18 there was growth in the quantity of output across each service area. The highest growth was in non-NHS provision – care funded by the NHS but provided by the independent sector, voluntary sector or local authorities – and GP prescribing, with less rapid growth in hospital and community health services and family health services (FHS), which includes primary care.
However, hospital and community health services accounts for the majority of NHS expenditure and over this period increased its share by 3.1 percentage points (pps). The contribution to overall output is calculated by weighting the quantity output growth for each sector by the respective expenditure share. Table 1 shows the annual average growth in quantity output alongside expenditure shares in 2000/01 and in 2017/18 and the contribution to overall output growth.
Table 1: Quantity output growth, expenditure share and contribution to overall output growth by sector (2000/01 to 2017/18)
|
Quantity output growth |
Expenditure share |
Contribution to overall output growth |
|||
|
|
Annual average growth |
2000/01 |
2017/18 |
Change (pps) |
Annual average (pps) |
|
Hospitals and Community Health Services |
3.8% |
60.1% |
63.2% |
3.1 |
2.3 |
|
Family Health Services |
2.5% |
16.3% |
15.6% |
-0.7 |
0.4 |
|
GP Prescribing |
6.5% |
19.0% |
8.5% |
-10.5 |
1.0 |
|
Non-NHS care |
11.3% |
4.6% |
12.7% |
8.1 |
0.9 |
|
Whole NHS |
4.6% |
||||
Source: Health Foundation analysis of ONS data, pps=percentage points.
Output is determined by both activity and cost
The NHS provides a wide variety of services with different costs. Table 2 sets out activity and costs for a selection of services provided by NHS Trusts and Foundation Trusts in 2017/18 (note, this does not include care funded by the NHS but delivered by non-NHS providers). For example, there were 85 million community health service contacts in 2017/18 at an average cost of £62 per contact. By contrast, there were only 10 million non-elective (unplanned) inpatient stays, but at an average cost of £1,726.
Table 2: Activity, unit cost and total spend by health service (delivered by NHS) (2017/18)
|
Service |
Volume (millions) |
Unit cost (£) |
Total spend (£m) |
|
All A&E |
20m |
£160 |
£3,198m |
|
Outpatient appointments |
75m |
£125 |
£9,316m |
|
Diagnostic imaging |
10m |
£90 |
£941m |
|
Planned procedures |
21m |
£556 |
£11,544m |
|
Non-elective inpatient |
10m |
£1,726 |
£17,890m |
|
Consultations in general practice |
307m |
£27 |
£8,182m |
|
Community prescribing |
1,106m |
£8 |
£9,095m |
|
Community health services |
85m |
£62 |
£5,252m |
Source: NHS reference costs, 2017/18, Consultations in general practice estimated from CPRD, NHS England and PSSRU; Community prescribing from Prescription cost analysis system.
As Table 1 showed, there was strong quantity output growth in some sectors, but they nonetheless fell as a share of expenditure. This is because there have been shifts within sectors both in terms of activity and the cost of delivering care (unit costs). Figure 3 sets out the annual average change in unit cost (in real terms) between 2007/08 and 2017/18. This shows that there is considerable variation in unit cost growth. Diagnostic imaging and community prescribing saw unit costs fall by 3.3% and 4.6% per year, compared to an increase of 5.3% for A&E attendances. A fall in unit cost does not necessarily mean doing the same thing has become less expensive, it also reflects shifts in the composition of activities.
Figure 3: Annual average change in unit costs of NHS delivered activity for selected services, 2007/08 to 2017/18
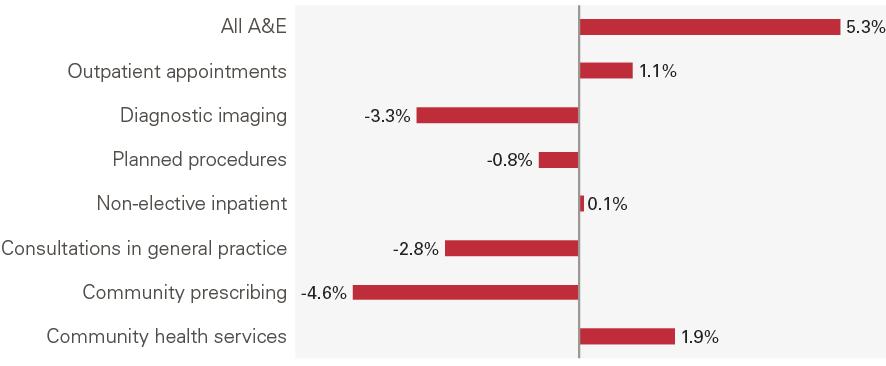
Source: NHS Reference Costs, 2007/08 and 2017/18; unit costs adjusted using GDP deflator; Consultations in general practice estimated from CPRD, NHS England and PSSRU; Prescription cost analysis system.
Overall health care output per person has increased significantly
Taken together, the average person in England receives twice as much health care than two decades ago. Health care output per person grew 3.9% per year even before allowing for the increased quality of care received (Figure 4). Output growth per person was higher between 2000/01 and 2010/11 (4.6%) than 2010/11 and 2017/18 (2.8%).
Figure 4: Annual average growth per person: funding, input and output
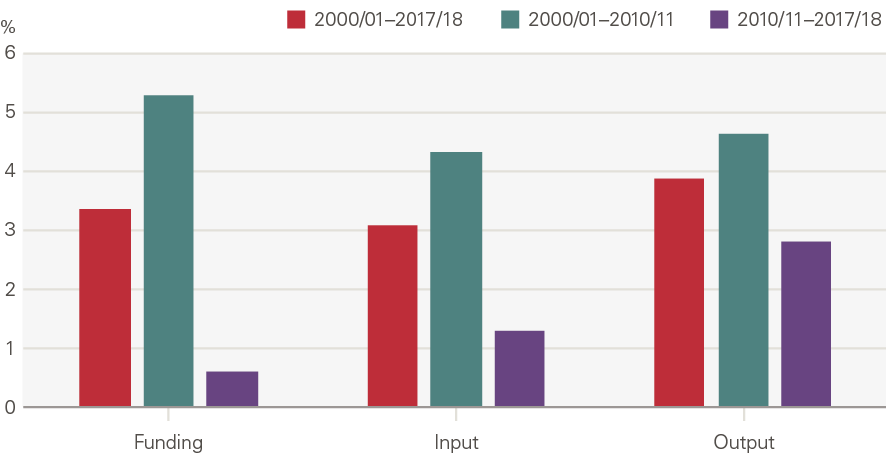
Source: PESA, Table 9.11; ONS; funding in 2018/19 terms, using the GDP deflator provided by the OBR.
We now look at what has happened over the past two decades in terms funding, supply, demand and policy to explore the broad trends described.
Activity growth has been supported by growth in funding, workforce and other inputs
Funding
At the turn of the century there were concerns that the UK was falling behind other nations on health outcomes and spending. In response, the government pledged to increase spending on the health service and commissioned the Wanless review (2002), which set out a plan for increased investment in the NHS under a range of scenarios.,
Real terms (adjusting for inflation) health spending in England grew from £62.5bn in 2000/01 to £122.8bn in 2017/18 (a 96% increase, or an annual average of 4.0% a year). However, there were two very different periods of growth (Figure 5). Over the first decade health spending increased by an annual average of 6.0% – this was in keeping with what the Wanless review termed a catch-up period of growth. Although some reduction in funding growth was expected, the financial crisis led to a much sharper fall than anticipated. After 2009/10, spending grew at an annual average of just 1.3% in real terms.
Figure 5: Annual average growth in real health spending in England: total, current and capital
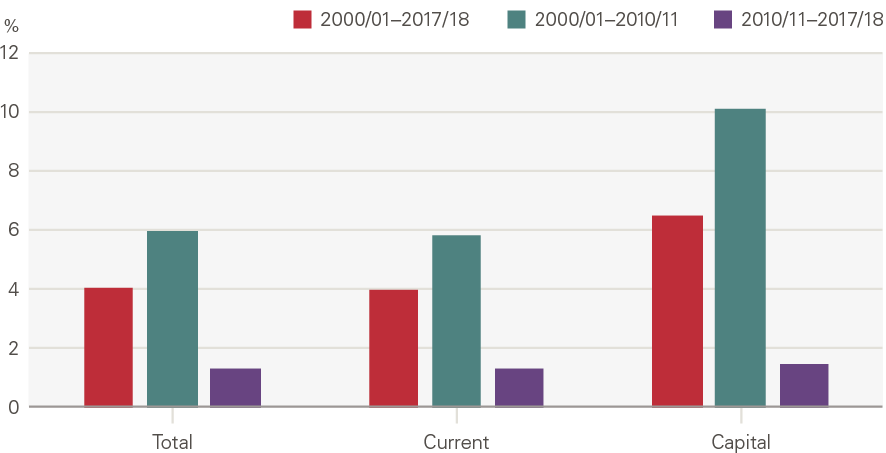
Source: PESA, Table 9.11; funding in 2018/19 terms, using the GDP deflator provided by the OBR.
Expansion, specialisation and then moderation
NHS funding is used to purchase inputs, including labour, goods and services, and capital. The overall volume of inputs (which is the number of each item weighted by the item’s cost) grew by 88% between 2000/01 and 2017/18. Unsurprisingly, given the direct link between funding and inputs, input growth was significantly higher in the first decade (averaging 5.0% a year between 2000/01 and 2010/11) than the second (2.0% per year).
Additional funding was used to invest in new capacity and expand supply. The number of full-time equivalent (FTE) staff working in the NHS increased by 47% (we adjust for a discontinuity in the data from 2010 when estimating growth rates), or 2.0% per year, from 874,000 in 2000 to 1,247,000 in 2019 (Figure 6). Early on, new employment contracts were introduced which increased pay, the most notable of which was a new grading and pay system for NHS staff implemented in 2004. This increased input prices but was considered necessary to attract and retain staff. Migration also played a role as the NHS became increasingly reliant on international staff. Changes to immigration rules during the period led to an increasing proportion of staff from the European economic area, although the decision to leave the European Union has seen this trend reverse.
NHS capital stock was modernised, with new hospitals and equipment such as diagnostic scanners. Funding also helped improve the IT infrastructure, with the introduction of a new patient records system.
Figure 6: Number of FTEs in NHS hospital, community health services and general practice staff
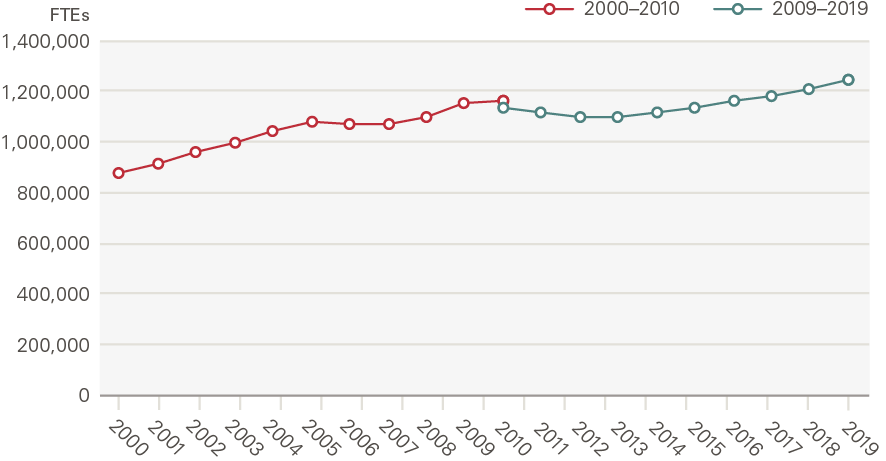
Source: NHS Digital; break in series reflects a discontinuity in the data
There were also major shifts in the mix of inputs in this period. The workforce became increasingly specialised, with growth in hospital doctors (4.6% per year) outpacing nurses (2.3%) and GPs (2.1%) (Figure 7). In order to expand capacity still further, policymakers began to make greater use of the independent sector (private providers, but also charities and local authorities). Independent sector provision – recorded within goods and services – is the main reason goods and services increased relative to labour in the late 2000s (Figure 8).
Another major shift was a reduction in the number of overnight beds. The number of acute beds grew briefly in the early 2000s, but overall beds fell sharply between 2000/01 and 2017/18 from 186,000 to 129,230. For some conditions, such as mental health disorders and learning disabilities, this reflected a policy push to treat more people in the community. Technological change, including precise anaesthetics and fibre-optics, however, reduced the need for beds more broadly, as more patients could be treated as day cases and those that did need beds could be discharged more quickly. Reducing acute beds became a key local planning objective in many health systems and a focus for annual planning.
Figure 7: Annual average growth in inputs, NHS staff by role and beds
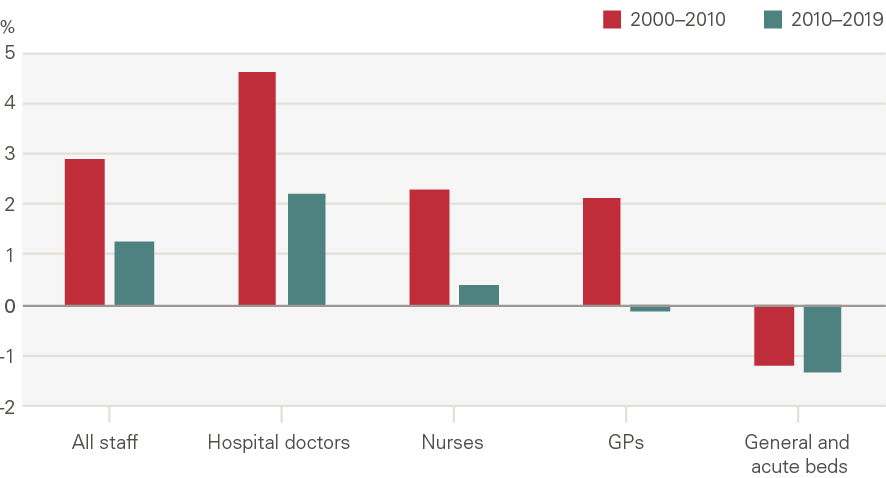
Figure 8: Share of expenditure on inputs, by type
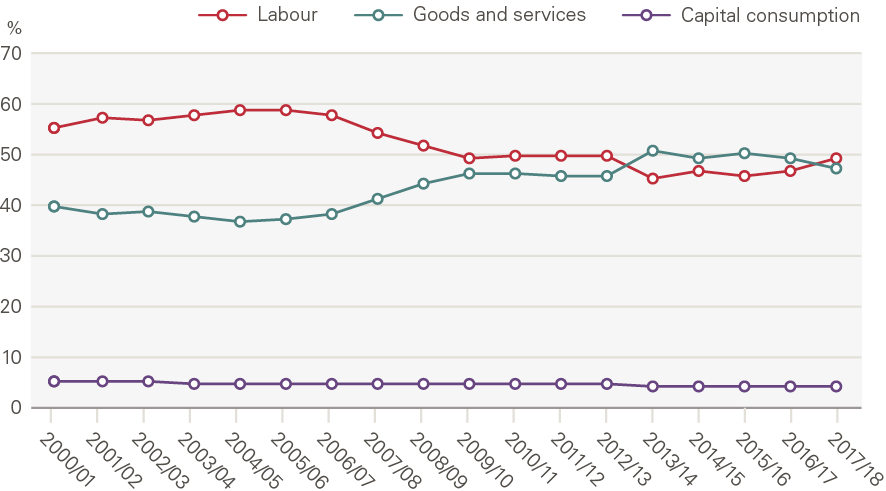
Source: ONS
However, from 2010/11 slower funding growth brought pressure on NHS inputs. Workforce growth moderated to 1.1% a year. Meanwhile, the capital budget came under pressure from 2010 as day-to-day needs were prioritised. The capital budget grew 10.1% per year between 2000/01 and 2010/11, but growth fell to 1.5% per year thereafter as day-to-day spending was prioritised.
By 2018/19, the NHS again faced significant staff shortages. Between 2010/11 and 2018/19, the NHS had become more reliant on costly agency and bank staff. Reduced growth in capital spending resulted in a rising maintenance backlog, with staff using faulty or out-of-date equipment. England still has fewer items such as Magnetic Resonance Imaging (MRI) scanners per person than other countries, despite growth in numbers between 2000/01 to 2010/11. The continued reductions in bed numbers resulted in dangerously high occupancy rates that left the services unable to deal with spikes in demand, particularly during winter months.
Demand has risen continually
Although funding and input growth slowed during the second decade of this century, factors driving demand did not abate. The population continued to grow and age, with health needs growing more complex.
In total, the population of England grew from 49.2 million in 2000 to 56.3 million in 2019, a 13.7% increase. The male population grew faster (15.1%) than the female population (12.4%). The population aged 65 and older increased by 33% (Figure 9), rising from 15.8% of the population in 2000 to 18.4% in 2019. While overall population growth was steady, the growth in the population aged 65 and older accelerated after 2011.
Between 2000 and 2019, net migration accounted for 60% of population growth, with the remaining 40% being the natural increase from births and deaths. The death rate in England fell significantly in the 2000s and, despite rising since 2011/12, remains lower than in 2000/01; the birth rate increased up to 2010/11 but has fallen since (Figure 10).
Figure 9: England population and population aged 65 and older (index, 2000/01 = 100)
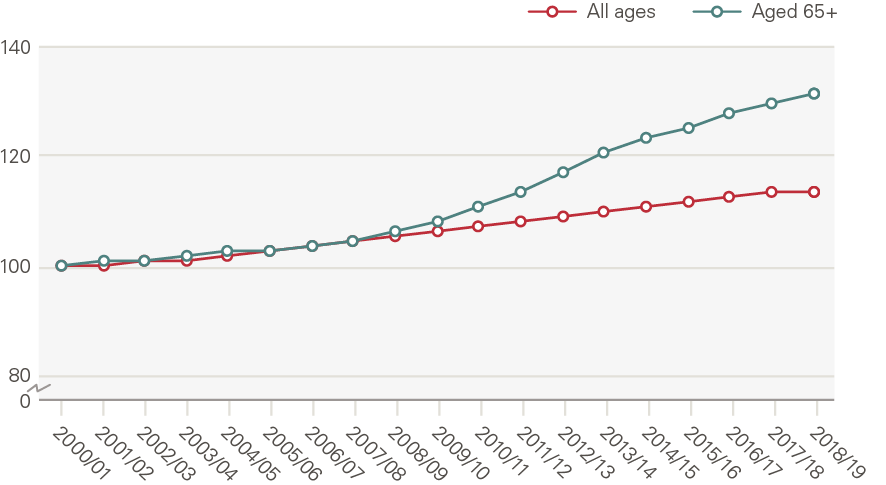
Source: ONS
Figure 10: Birth and death rates
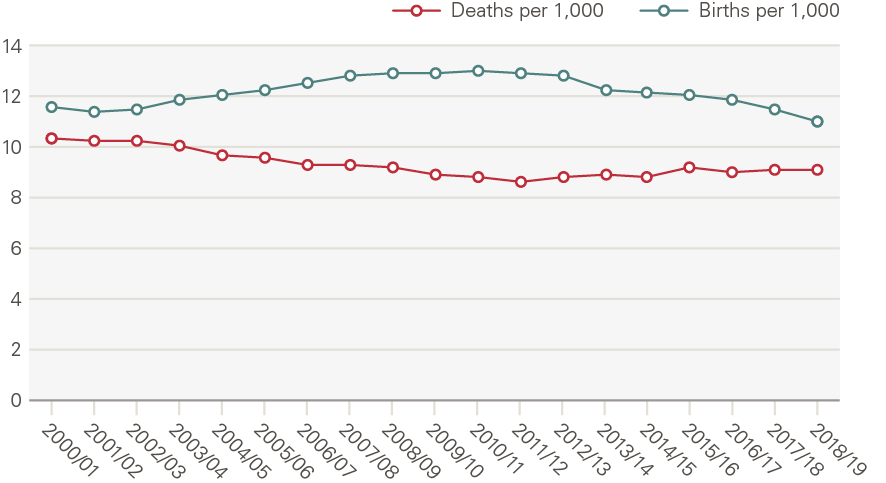
Source: ONS
The death rate fell mainly because of reductions in age-specific mortality. These can be seen in estimates of life expectancy which, in England, increased between 2000/02 and 2010/12 by 2.3 years for women (0.3% per year) and 3.1 years for men (0.4%). Unlike gains in life expectancy earlier in the 20th century, which can broadly be attributed to decreases in mortality among younger people, recent increases reflect improvements in the health and care of older people, such as better treatment for heart disease. However, increases in life expectancy have stalled since 2010/12. Between 2010/12 and 2016/18, just 0.3 years for women and 0.5 years for men were added; growth of 0.1% each year. There is no single reason for this marked slowdown, although research reveals a rising number of avoidable deaths among those younger than 50, and a widening gap in life expectancy between the richest and poorest and between the north and south of England.
Rising life expectancy is a success of health policy. However, healthy life expectancy (the number of years spent in good health) has not kept pace. Increased survivorship means more people can expect to live longer in poor health, creating additional demand for health care. The burden of disease (morbidity), as measured by the total number of years lived in disability (YLDs), increased 19% between 2000 and 2017, from around 6.5 million to 7.8 million. The age-standardised rate of morbidity increased by 2.4% over the same period, meaning the burden of morbidity is mainly driven by a larger group of people reaching old age.
Not only has the prevalence of morbidity increased, so too has the complexity. In particular, there has been a stark increase in the proportion of the population living with multiple long-term conditions. In 2000, most (58%) people aged 70 or older were living without a diagnosed long-term condition. By 2018, just 32% of those aged 70 or older had no diagnosed long-term condition, 39% had more than one, and almost one in ten (9%) had four or more (Figure 11). Multi-morbidity poses challenges to traditional ways of delivering care, which are centred around single diseases.
Figure 11: Share (%) of population aged 70+ by number of long-term conditions
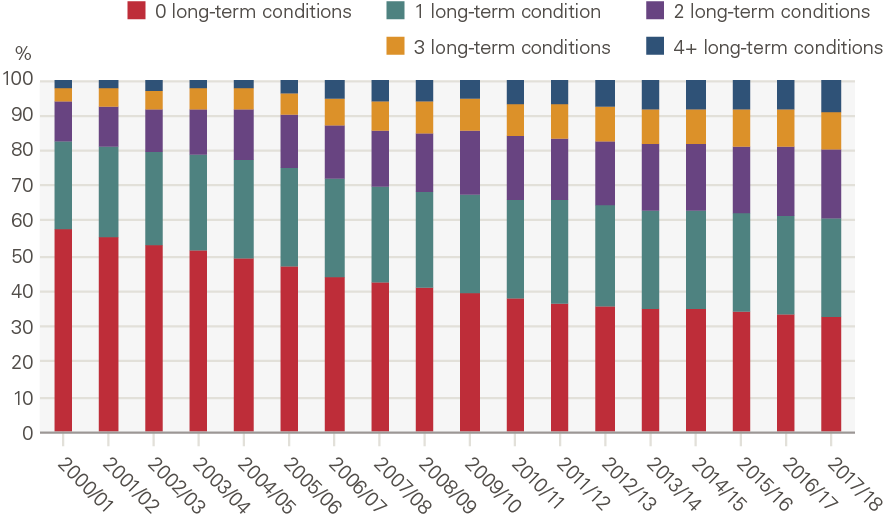
Source: CPRD
A number of risk factors are well known to influence the prevalence of different diseases. Over the past two decades, there has been progress in reducing smoking rates and in reducing the prevalence of high blood pressure, but there has been an increase in the obesity rate and little change in levels of alcohol consumption.,
Policy focused on improving access, then consolidation through efficiency gains
Funding growth and market reforms to improve access
In 2000, the NHS was less well resourced than health systems in comparable European countries. The supply of health care did not match demand, with long waits for routine surgeries and low public satisfaction with the health service.46 Influenced by ideas such as public sector failure – the equivalent of market failure for public sector markets – policymakers sought to take an interventionist approach to encourage services to improve health outcomes, alongside increased funding. The main reforms to achieve this were:
- Funding – with pressure mounting to boost NHS activity, government pledged to increase health spending to the European Union average.
- Targets – an extensive set of performance targets was introduced. This included targets to reduce mortality rates from heart disease, suicide and cancer, but increasingly focused on process measures, including waiting times targets for A&E, planned hospital care and cancer treatment.
- National guidance and support – for example, improvements in health outcomes were supported by National Service Frameworks, and 10-year plans to define standards of care in major areas of medicine.
- Regulation – was introduced to promote quality. This included the introduction of NICE, tasked with evaluating treatments for use in the NHS based on cost-effectiveness, and the Commission for Health Improvement (now the Care Quality Commission).
- Reorganisation – in order to create local incentives and accountability, the government continued to organise the health system along the lines of an internal market, separating the provision of hospital services (providers) from health authority planning functions (commissioners).
- Payment – payment systems were developed for secondary care that expressly incentivised activity. Previously payment took the form of a lump sum for providing care to a population, but payment-by-results (PbR) was paid on a case basis. PbR began with elective care but expanded in the 2000s to cover most hospital activity.
- Choice – Patients were progressively given more opportunities to choose their provider for elective treatment, with the expectation that increased competition would improve efficiency. Increasingly this included the independent sector (which includes private sector providers), with independent sector treatment centres (ISTCs) introduced in 2003 and involvement expanded thereafter.
These reforms were associated with both lower waiting times and improved health outcomes; public satisfaction with health services increased.
However, towards the end of the first decade of the 2000s the emphasis on increasing activity began to abate. Indeed, there was growing concern that a forceful implementation of targets – dubbed ‘targets and terror’ – had distorted clinical priorities, created perverse incentives and scope for manipulating the system. Meanwhile, there was recognition that the pressing issue facing the NHS was now the care of a growing number of people with long-term conditions. Reforms focused on hospital care had come at the expense of other parts of the system, including primary care, community services and mental health – all of which are important for supporting those with long-term conditions. Moreover, concerns emerged that efforts to improve prevention had fallen short of the more ambitious targets set in the earlier Wanless review. The white paper, High quality care for all, signalled the government’s desire to focus the next stage of health care reform in England as much on quality as responsiveness and efficiency, and on integrated care for people with long-term conditions.
The Nicholson challenge and drive to make savings
Following the 2008 recession and resultant increase in the public sector deficit, the UK government made efforts to reduce the growth in public spending. For the NHS, the period would be dominated by the need to achieve large efficiency savings to keep pace with demand. The so-called ‘Nicholson challenge’ was for the NHS to achieve 4% increases in productivity each year with no real-terms increase in budgets.
Government imposed several measures to contain costs. Perhaps the most visible came in relation to workforce. Government introduced a public sector pay freeze (2011–2013) and subsequently capped wage growth. These policies eroded real wages (adjusted for inflation), which took a toll on morale and retention. Meanwhile, an efficiency factor was used to reduce payments under PbR. Providers were still performance managed – the coalition government had not followed through on a commitment to replace most targets introduced in the 2000s with a broader set of outcomes measures, highlighting the political challenge of removing targets once installed. Faced with lower payments for delivering care to patients, NHS providers increasingly fell into deficit.
Initially, the role of competition was re-emphasised alongside the reorganisation of the NHS initiated as part of the Health and Social Care Act 2012. However, the focus on competition would prove short lived as it became clear this approach was out of step with the needs of the increasing numbers of patients with long-term conditions. The emphasis of policy instead turned to activity moderation, efficiency and collaboration in the face of rising demand and pressure on performance against targets.
NHS England assumed a greater role in boosting integrated care, partnership working (across the NHS and with social care) and effectiveness. Initiatives such as multidisciplinary teams and the Better Care Fund sought to encourage the integration of care and improve collaboration to make use of resources more efficient. In addition, policymakers recognised that an onus on competition had fractured the provider landscape and made collaboration and service improvement more challenging, just when the rise in multi-morbidity meant services had to become more, not less, integrated. The policy document, the NHS Five year forward view (2014), set out a new focus for the NHS, including greater integration of care; investment in primary care; and an upgrade in prevention and public health. Many of these themes were repeated in the NHS Long term plan (2019).
Analysis of activity by service area
Key points
- Growth has varied hugely across NHS services.
- Demographic factors (population size, composition by age and gender and proximity to death) explain only around a quarter of the overall growth seen – around 1% a year.
- Generally, care in hospital has seen greater growth than other settings. For example, elective procedures have grown by 9.6% each year; consultations in general practice by only 0.7%.
- In part, this is because funding, capacity increases and high-profile targets were focussed on hospital services.
- However, the amount of time patients spend in a bed in a care facility declined for all services. This is linked to technological change and treatment norms.
Introduction
In this chapter we look at trends and patterns in levels of health care activity in England by service. We analyse how these have been shaped by changes in supply, demand and policy over the past two decades.
Our approach to analysing activity
NHS care covers a broad mix of services. We look at services in five major areas of care: unplanned care, planned care, maternity admissions, primary and community care, and mental health care.
For each service, we estimate the change in activity that is explained by basic demographic factors which are relatively simple to model, and are often used to predict future service use. This recognises there are other important drivers of services use.
For all services we modelled the size of the population. Where possible, we have modelled the proportion of any change that can be explained by a combination of population size, age, gender, and proximity to death (full model). These estimates are based on ONS population and mortality data and the assumption that the amount of care needed by those at different ages, genders and proximities to death is unchanged. For example, that the average number of unplanned hospital admissions by women aged 75, who are not within 2 years of death, is constant over time.
The difference between observed activity growth and that explained by demographics, is unexplained growth. This means it is due to other factors. These are a combination of demand and supply side factors including changes in the age-specific prevalence of morbidity (demand) and changes in the availability of treatment (supply). Although it is difficult to model and quantify these factors, we attempt to identify which are most important for each service and the influence of policy on them.
Overall
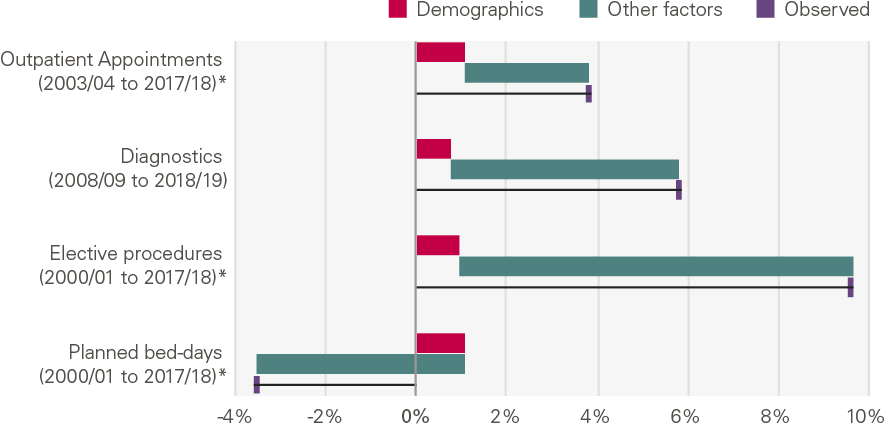
Growth over the past two decades has differed widely by type of activity (Figure 12). The number of mental health admissions in acute hospitals has fallen 4.4% per year; there has been small growth in maternity admissions, consultations in general practice and community services; while elective procedures increased 9.6% per year.
Our analysis shows that demographic changes explain only a small part of the growth for most services. It explains a relatively high proportion of activity growth in a few services (major A&E attendances, consultations in general practice and community health services). This is not because these factors have a larger absolute impact in these areas, but because growth as a result of the other factors in our framework is much lower.
Figure 12: Annual growth (%) by service: projected by demographics, explained by other factors and observed
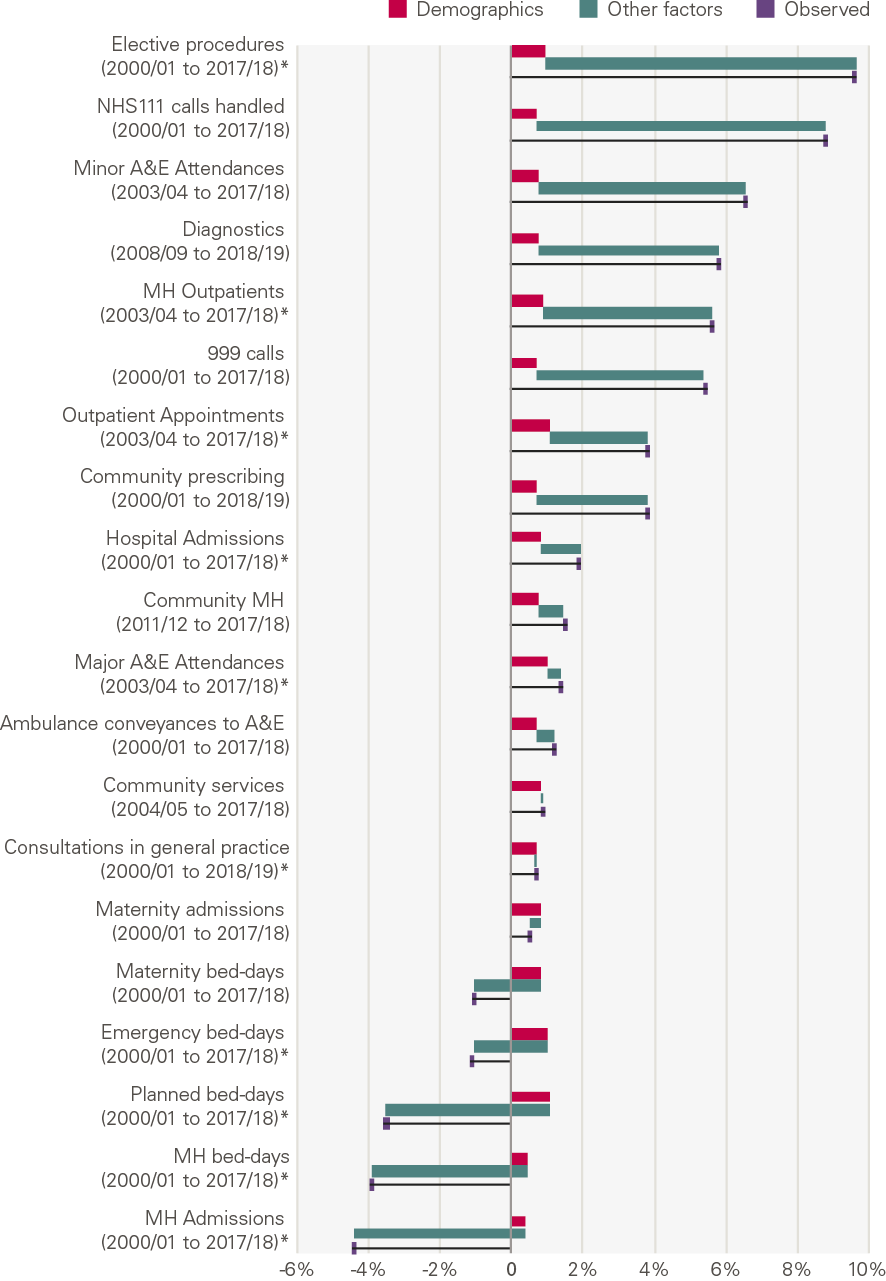
Source: Various, see Annex, *full model
Unplanned care
What is unplanned care?
Unplanned care is a necessary, highly visible and sometimes expensive point of health care provision. It includes:
- Emergency care for life threatening illnesses or accidents that require immediate, intensive and time sensitive treatment. Services include the 999 service and ambulances, and emergency departments at major hospitals.
- Urgent care for illnesses or injuries that require urgent attention but are not life threatening. Services include a phone consultation through NHS111, pharmacy advice, out-of-hours GP appointments, and urgent treatment centres (UTCs).
Table 3 shows the scale of these services in 2017/18 delivered by NHS Trusts and Foundation Trusts. This does not include care funded by the NHS but delivered by non-NHS providers.
Table 3: Unplanned care services in 2017/18
|
Service |
Activity |
Estimated unit cost |
Estimated total cost |
|
Triage services and ambulance |
|||
|
NHS 111 calls handled |
14.6m |
£12** |
£179m |
|
Calls to 999 |
10.2m |
£7 |
£73m |
|
Hear and treat or refer (help by phone) |
806k |
£37 |
£30m |
|
Ambulance dispatches (treat on scene) |
2.4m |
£181 |
£443m |
|
Ambulance conveyances to A&E |
5.3m |
£247 |
£1,306m |
|
A&E attendances |
|||
|
Attendances at major A&Es |
15.4m |
£188 |
£2,892m |
|
Attendance at minor A&Es |
4.5m |
£67 |
£306m |
|
Emergency admissions |
|||
|
9.0m |
£1,698 |
£15,282m |
|
Source: National schedule of NHS costs, NHS Trusts and Foundation Trusts
In 2017/18 the three largest areas of unplanned care spend (by NHS Trusts and Foundation Trusts) were emergency admissions to hospital (£15.3bn), attendances at major A&Es (£2.9bn) and ambulance transfers to hospital (£1.3bn). Together these accounted for 95% of total unplanned care spend.
Growth in unplanned care services
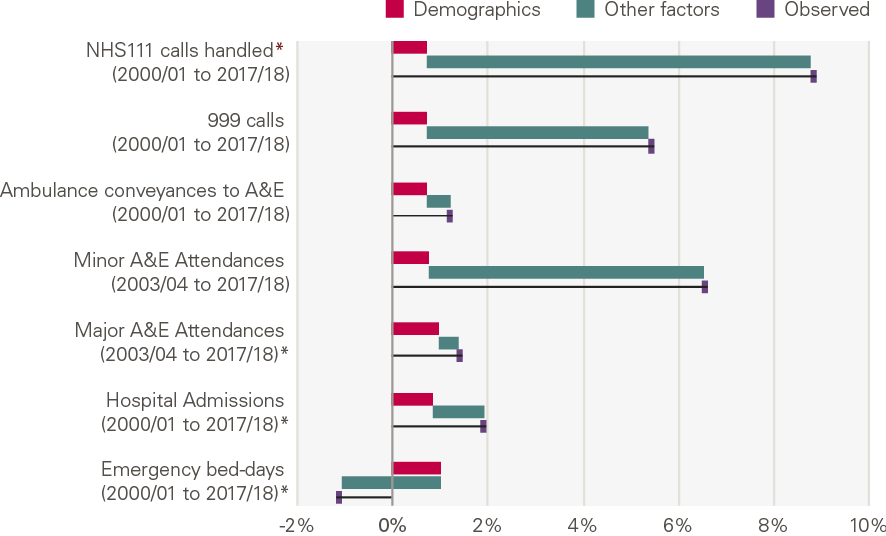
The chart below shows the annual growth by service, and the contribution of demographic factors from our model (Figure 13). There has been a rapid increase in activity for lower cost activities, mainly NHS 111 and calls to 999, with little explained by changes in population size. There has been lower growth in some of the services that have a higher cost, with a fall in unplanned bed days.
Figure 13: Annual growth for unplanned care services: projected by demographics, explained by other factors and observed
What explains the growth?
All types of activity (with the exception of bed days) have grown more quickly than would be expected from changes in demographic factors alone. The reduction in bed days has been driven by a reduction in the number of unplanned admissions that lead to long stays in hospital.
NHS 111 (and its predecessor NHS Direct) and minor A&E departments, including UTCs, experienced high rates of growth. This is unsurprising as both NHS 111 and UTCs were set up during this period in an attempt to divert unnecessary attendances away from major A&E departments. Evidence suggests their success in doing so is mixed. An evaluation of a pilot NHS 111 identified the potential for supplier-induced demand, but there is stronger evidence that UTCs can reduce demand on A&E attendances.
Ambulance calls also increased rapidly, but the proportion of calls resulting in an ambulance transporting a patient to A&E fell from 89% in 2000/01 to 42% in 2018/19, leading to much slower growth in ambulance transports. Treatment at the scene was promoted by policy and planning as an alternative to transports. In part, this reflects the changing profile of patients – traditionally, ambulance services were designed to respond to life-threatening conditions, but by the early 2000s this accounted for only around 10% of cases, with increases in those seeking help with social care needs or long-term conditions. Changes in the skill mix and composition of staff were important in supporting more patients to be treated at the scene.
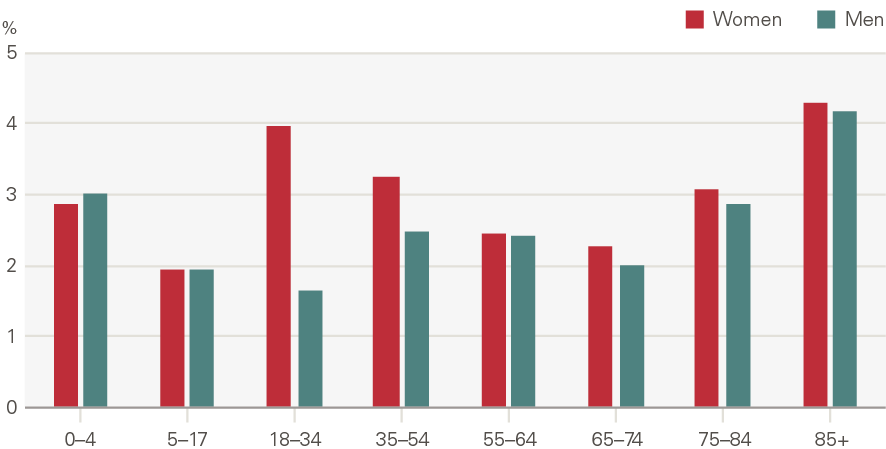
Attendances at major A&Es increased by 1.4% a year, 0.4pps above the growth expected from demographic factors alone. This is a smaller rate than many other acute services, with the lower growth driven in part by a reduction in attendances per head by younger males (Figure 14). This reflects sizeable declines in traffic and workplace accidents. By contrast, admissions increased significantly for those older than 75 (Figure 15). In 2014/15, 8.6% of A&E attendances were by people in their last 2 years of life, up from 7.2% in 2010/11.
Figure 14: Attendances at major A&E departments by age and gender, rate per 1,000 (2017/18)
Source: HES
Figure 15: Annual growth in rate of attendances at major A&E departments by age and gender (2007/08 to 2017/18)
Source: HES
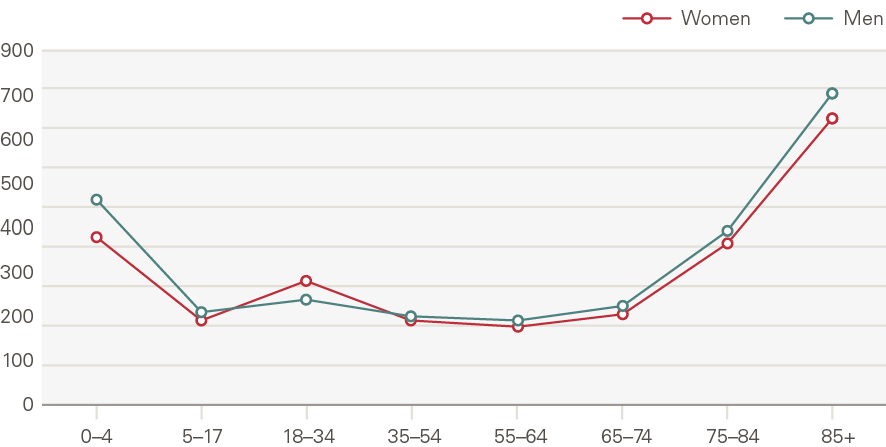
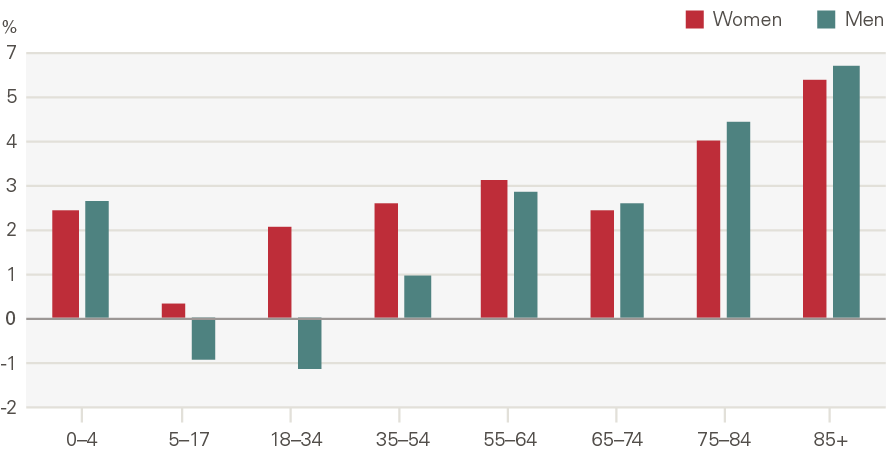
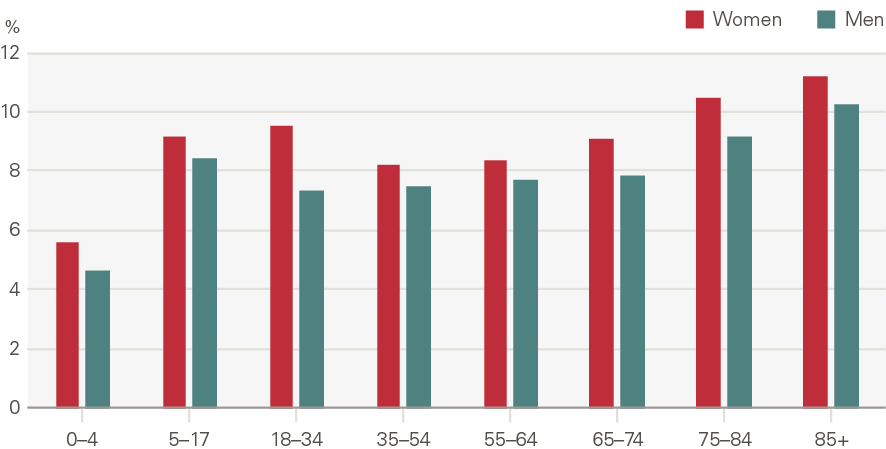
Emergency admissions to hospital have grown by around 1.1pps a year more than expected from demographic factors alone. The growth in the rate of attendances per head was higher for women than men (Figure 16). Males aged 5–17 have seen very low rates of growth, as have men and women aged 65–74. Growth was higher among the very young (aged 0–4) and the elderly (85+) (Figure 17). The rate of emergency admissions for those within a year of death is 1,400 per 1,000 population, compared to 69.5 for those who survive beyond 2 years.
Figure 16: Emergency hospital admissions by age and gender, rate per 1,000 (2017/18)
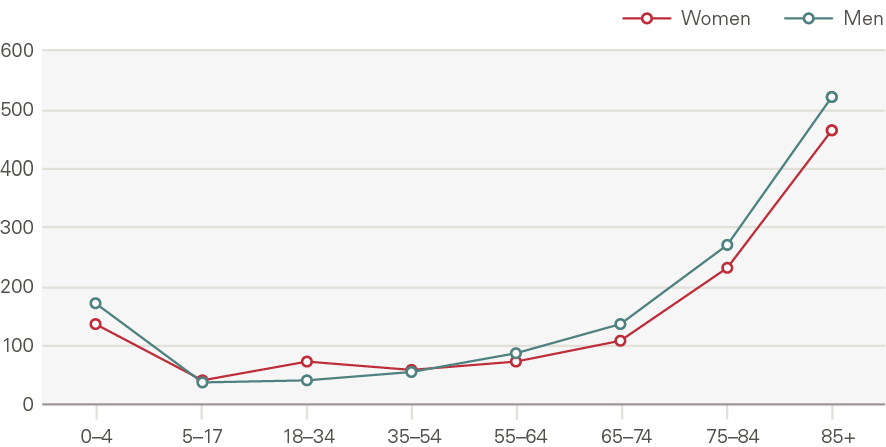
Source: HES
Figure 17: Annual growth in rate of emergency hospital admissions by age and gender (2000/01 to 2017/18)
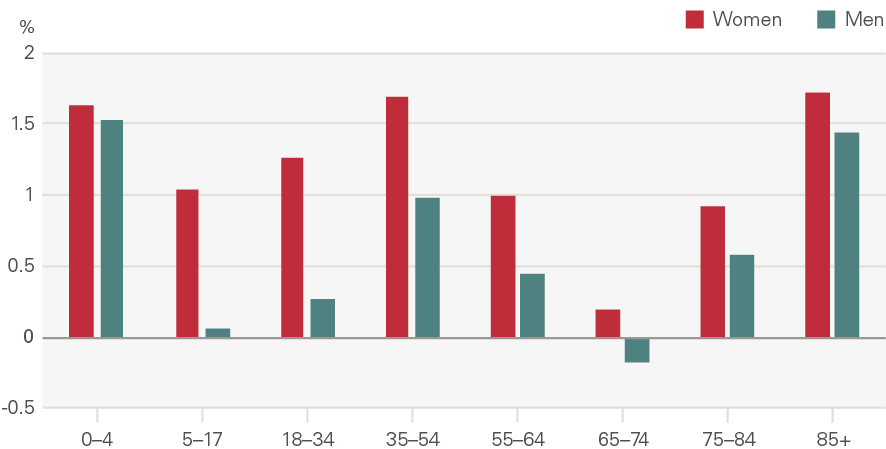
Source: HES
One reason unplanned admissions may have grown faster than our modelling predicted based on demographic factors would be if admissions thresholds had reduced. However, research shows the opposite: admissions thresholds have actually increased. Instead, the increase seems to be the result of a greater severity of need, with a greater proportion of those attending therefore requiring an admission.
This may have been driven by changes in population health and the increase in the proportion of patients with multiple long-term conditions. By 2015/16, one in three emergency patients admitted for an overnight stay had five or more health conditions, up from one in ten in 2006/07. Research has shown that an unintended consequence of rising survival rates is a larger population of patients who are frail and at high risk of further hospital admissions. However, the pattern of emergency admission growth across age groups (eg the growth in admissions for 0–4 year olds) suggests other factors are at play too.
There have been various initiatives to reduce growth in emergency admissions. For example, attempts to make care more integrated – the Integrated Care Pilots, Pioneers and New Models of Care – were partly aimed at improving efficiency, often with a focus on reducing emergency admissions. Despite this, emergency admission growth in the second decade was 1.5% a year – 0.4 percentage points a year above that expected from population growth and ageing – compared to 2.2% a year in the first decade.
While the policy aims for unplanned care have remained fairly consistent, policy aims in other parts of the system have limited their success. For example, the decision to reduce bed capacity has resulted in high occupancy rates, which have limited the ability of A&E departments to meet the 4 hour waiting time target intended to improve patient satisfaction and outcomes. Difficulties in discharging patients to appropriate care in the community have compounded this. Without a whole system approach, these trends will likely continue.
Planned care
What is planned care?
Planned care – largely hospital care that is not due to an accident or emergency – is arranged in advance and generally follows a referral from a GP. After a referral for treatment a patient has an outpatient appointment (here this excludes appointments for procedures, diagnostics and mental health). There the care team decide what course of treatment to follow and whether the patient requires a follow up appointment, a diagnostic test or an elective procedure. If it is a procedure, this can take the form of:
- an outpatient procedure (only at the hospital for the duration of the consultation)
- a day case (given a hospital bed but not staying overnight), or
- an inpatient procedure (an overnight hospital stay).
Table 4 shows the scale of these services in 2017/18 delivered by NHS Trusts and Foundation Trusts. This does not include care funded by the NHS but delivered by non-NHS providers.
Table 4: Costs of planned care, 2017/18
|
Service |
Activity |
Estimated unit cost |
Estimated total cost |
|
Outpatient appointments§§ |
74.5m |
£125 |
£9,305m |
|
Diagnostics |
|||
|
Diagnostic imaging |
10.5m |
£90 |
£941m |
|
Elective procedures |
|||
|
Outpatient procedures |
13.2m |
£140 |
£1,841m |
|
Regular attendance |
0.3m |
£327 |
£93m |
|
Day cases |
5.9m |
£742 |
£4,404m |
|
Electives¶¶ |
1.3m |
£4,023 |
£5,323m |
Source: National schedule of NHS costs, NHS Trusts and Foundation Trusts
In 2017/18 the three largest areas of planned care spend (by NHS Trusts and Foundation Trusts) were outpatient appointments (£9.3bn), elective procedures (£5.3bn) and day cases (£4.4bn). Outpatient appointments were by far the largest area of activity.
Growth in planned care services
The chart below shows the annual growth by service, and the contribution of demographic factors from our model. This shows that there has been a rapid increase in all planned activities (with the exception of bed days). Growth has been most pronounced in elective procedures, followed by diagnostic tests, and outpatient appointments.
Figure 18: Annual growth for planned care services: projected by demographics, explained by other factors and observed
Source: Various, see Annex; *full model
What explains the growth?
Much of the growth is not explained by the demographic factors in our model. This implies that the growth in planned care was driven by other factors, including funding, supply and policy.
Outpatient appointments have grown by 2.8pps per year above what is explained by demographic factors. Outpatient appointments increase with age, with those aged 75 and older accounting for nearly one in five appointments in 2017/18 (Figure 19). The rate of appointments for those close to death rose more quickly than for the rest of the population.
Figure 19: Outpatient appointments by age and gender, rate per 1,000 (2017/18)
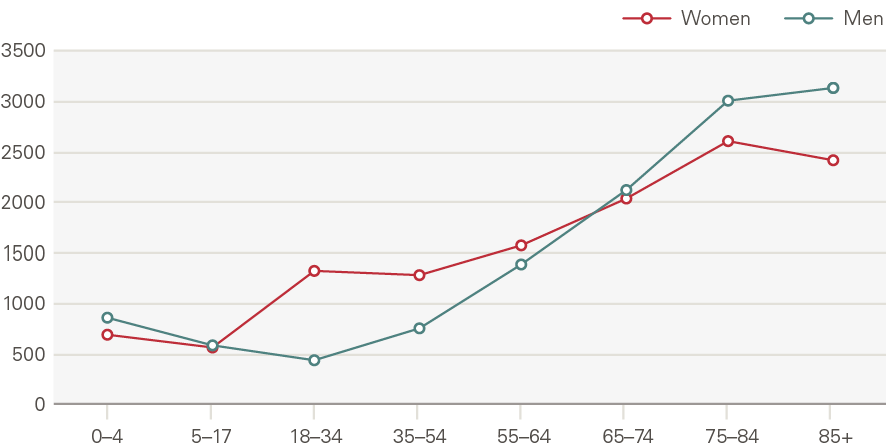
Source: HES
Figure 20: Annual growth in rate of outpatient appointments by age and gender (2003/04 to 2017/18)
Source: HES
Some patients require a follow up appointment, and many require several. Growth in first appointments (4.0% per year) was marginally higher than follow ups (3.8%) over the whole period, meaning the rate of follow ups to first appointments delivered each year has fallen from 2.39 in 2000/01 to 2.33 in 2017/18.
From 2010/11 onwards, however, follow ups grew faster than first appointments. This has led to efforts to limit the number of follow up appointments, particularly those not deemed clinically necessary or desired by patients. Another proposal is to make greater use of digital appointments, something that may gain traction following COVID-19.
One of the most significant service developments of the past two decades has been an increase in diagnostics tests, driven by technological advances and investment in capital. From 2008/09 to 2018/19, we see a 75% increase in tests (5.8% per year). Imaging tests, including CT and MRI scans, account for most diagnostics. Our ability to diagnose increasing numbers of conditions has contributed to the rise in other areas of planned care.
Elective procedures (including outpatient, inpatient and day cases) have increased by 8.7pps each year above what is expected by demographic factors. This growth is larger than any other service area in our analysis. The proportion of elective procedures for those within 2 years of death has fallen steadily, from 14.0% of procedures in 2000/01, to 9.6% in 2014/15. A greater share of care, therefore, would seem to be for those with less acute needs.
Figure 21: Elective procedures by age and gender, rate per 1,000 (2017/18)
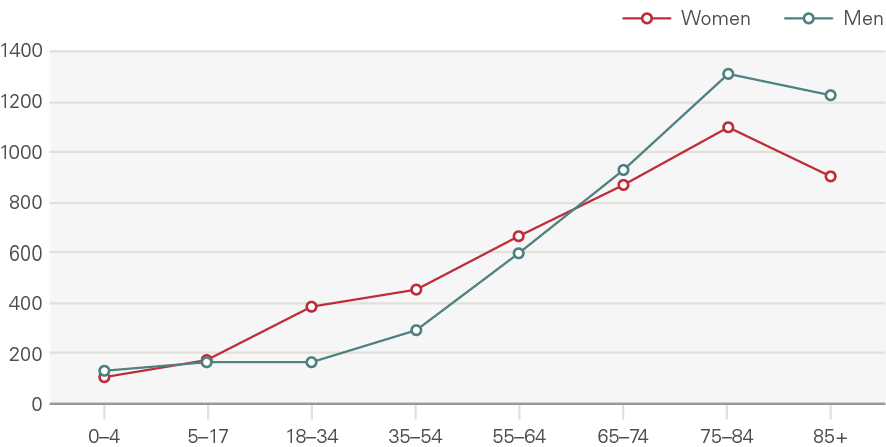
Source: HES
Figure 22: Annual growth in rate of elective procedures by age and gender (2000/01 to 2017/18)
Source: HES
Growth has been driven by outpatient procedures and, to a lesser extent, day cases. Day cases grew 6.5% per year between 2000/01 and 2017/18, while outpatient procedures grew 21.5% between 2003/04 (the first year of data) and 2017/18. Inpatient admissions declined 1.5% per year. As such, the proportion of elective procedures delivered in an outpatient setting increased from 15% in 2003/04 to 62% in 2017/18 (Figure 23).
Figure 23: Share (%) of elective procedures, by type
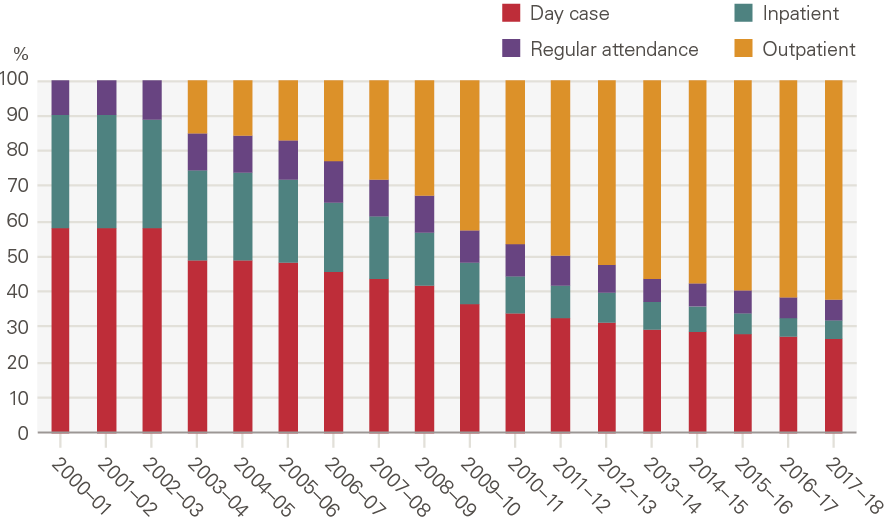
Source: NHS Digital, HES
This has been facilitated, in part, by technological changes that mean more patients can be treated without an overnight stay and discharged more quickly. An example is cataract surgery. Technological advances have allowed a shift from invasive surgery with a high complication rate and long recovery time, to a much quicker and safer surgery with shorter recovery. As the surgery was refined and became established, the threshold for procedures declined, leading to an increase in the number of surgeries performed. This and other similar changes meant that the proportion of cataract surgeries as inpatients fell from 15% in 2000 to 1% in 2017.
Overall, there has been a marked increase in the amount of planned care delivered. This has been supported and driven by increases in the supply of inputs, particularly an increase in the number of specialist doctors (8.2% growth per year across the period).
Over time, the health system has come under pressure not just to reduce mortality rates of diseases like cancer and heart disease, but also to improve quality of life through treatments such as hip or knee replacements. Increasing numbers of patients are eligible for these procedures, which are cost-effective and are being offered at lower levels of severity than in the past. This in turn changes societal expectations of the ‘right’ level of care.
However, the amount of care provided is ultimately limited by capacity, underpinned by value judgements over what is feasible and desirable. This may be less obvious when funding and activity are growing, but recent slowdowns in funding growth have resulted in difficult decisions over care thresholds, with some local planners reducing access to procedures such as hip replacements.
Maternity admissions
What is maternity care?
One of the most common reasons for a hospital admission in England is having a baby. Table 5 sets out the elective and non-elective costs of maternity activity in 2017/18.
Table 5: Cost of maternity inpatient care, 2017/18
|
Service |
Activity |
Estimated unit cost |
Estimated total cost |
|
Elective – Maternity |
12,500 |
£3,157 |
£39.5m |
|
Non-elective (long stay) – Maternity |
411,000 |
£3,686 |
£1,586m |
|
Non-elective (short stay) – Maternity |
818,000 |
£944 |
£771.9m |
Source: National schedule of NHS costs, NHS Trusts and Foundation Trusts.
Growth in maternity admissions
Maternity admissions are recorded distinctly from elective (planned) or emergency (unplanned) admissions. This category includes admissions of a pregnant or recently pregnant woman to a maternity ward, except when the intention is to terminate the pregnancy.
The chart below shows the annual growth in maternity admissions by number of admissions and bed days. Here, the contribution of demographics is accounted for differently from other service areas: we use births instead. This shows that there has been an increase in maternity admissions (0.5% per year), but less than expected based on the number of births. Bed days fell 1.1% per year.
Figure 24: Annual growth for maternity admissions: projected by demographics, explained by other factors and observed
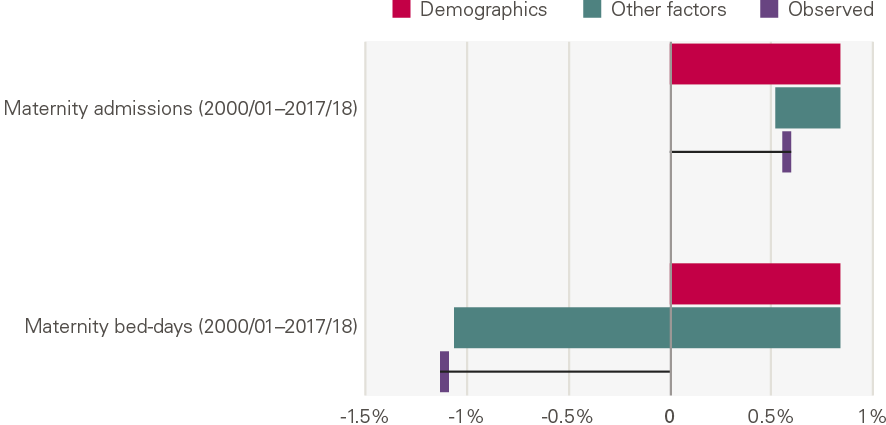
Source: Various, see Annex.
What explains the growth?
Maternity admissions were 9.3% higher in 2017/18 than in 2000/01 (0.5% growth per year). Admissions grew 2.2% per year between 2000/01 and 2010/11, but fell 1.8% per year thereafter. This reflects the fertility rate, which increased in the in the 2000s before falling again (see chapter 3 on demand).
Our model shows a substantial reduction in the number of maternity bed days. This has been driven by:
- a reduction in the ratio of admissions to births, from 1.76 admissions per birth in 2001/02 to 1.68 admissions per birth in 2017/18, and
- a reduction in the number of bed days per admission, from 3.40 bed days per birth in 2001/02 to 2.56 in 2017/18.
There has been a rise in zero day admissions (those not lasting a day), with the proportion increasing from 34% in 2000/01 to 38% in 2017/18. This reflects trends in other countries and may be driven by a combination of patient choice, greater flexibility and safety, or a drive to improve efficiency.
There has also been a substantial reduction in maternity admissions for women younger than 27 and growth in admissions for women aged older than 27, mirroring the changing age profile of women giving birth. The older age profile of mothers may contribute to more complicated and challenging births.
Primary care and community services
What are primary care and community services?
Primary care and community services are provided outside of hospital. Primary care is the most used part of the health care service and has a relatively low cost per consultation (Table 6). While a broader definition includes areas such as dentistry and community pharmacy, here we use primary care to mean general practice. General practice is where most health needs are identified, monitored, treated. A patient may be prescribed medication or, where necessary, referred to specialist services. General practice plays a crucial role in keeping people well, and in keeping them out of hospital.
Community services cover a range of teams, from district nurses and therapists to palliative care. They are delivered close to home, including in people’s homes. Teams also provide preventative interventions, such as smoking cessation services, often in partnership with local government or the third sector.
The table shows the estimated scale of primary care and community care services in 2017/18.
Table 6: Primary care activity and costs, 2017/18
|
Service |
Activity |
Estimated unit Cost |
Estimated total cost |
|
Consultations in general practice††† (2018) |
307m |
£27 |
£8,182m |
|
Community prescribing |
1,106m |
£8.20 |
£9,083m |
|
Community services |
88.3m |
£62 |
£5,480m |
Source: NHS England, Appointments in General Practice; CHE analysis of PSSRU, Unit Costs of Health and Social Care; Prescription Cost Analysis - England, 2017 and 2018; NHS reference costs.
Growth in primary care and community services
Figure 25 shows the annual growth by service, adjusted for changes in the size of the population. This shows that there has been a rapid increase in community prescribing (prescribing outside of the hospital) but almost no growth per person in primary care or community health services. This is despite a strong primary care system being crucial to preventing illness and supporting people to manage their own conditions, and despite policy ambitions to move care from hospitals to the community.
Figure 25 Annual growth for primary care and community services: projected by demographics, explained by other factors and observed
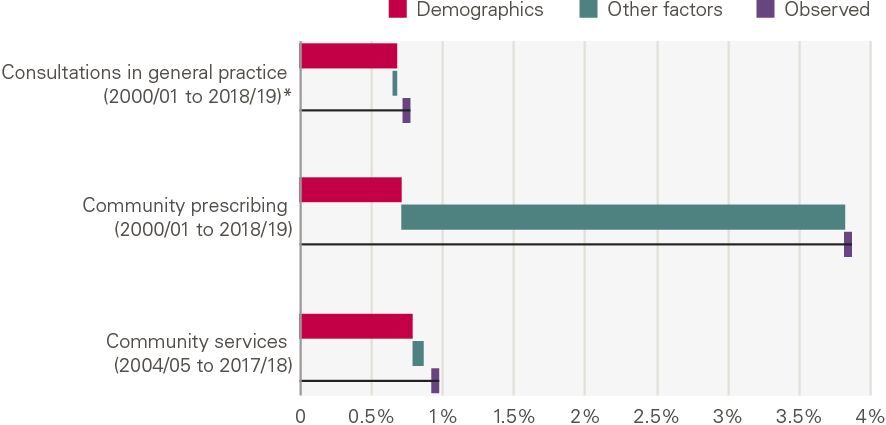
Source: various, see Annex; *full model
What explains the growth?
Unlike other service areas, demographic changes do explain the majority of observed growth in consultations in general practice and community services. Contacts with community services in 2017/18, up from 75.7 million in 2004/05 (Figure 25), increased by 11% between 2004/05 and 2017/18 or 0.9% per year. Considering population growth, contacts per person grew just 1%, 0.1% per year. Therefore, nearly all the growth in community contacts can be explained by population growth.
The rate of consultations in general practice in 2018/19 (5.0 consultations per person) was the same as in 2000/01, though this hides small fluctuations over time. The lack of growth has in part been explained by a lack of growth in the workforce. Indeed, the number of full-time equivalent GPs per head of population has fallen since 2010. This has led to a shift in who delivers care. The proportion of consultations delivered by other staff, including nurses, increased from 28% in 2000/01 to 41% in 2018/19, with an associated fall in the proportion delivered by GPs.
The rate of consultations in general practice generally increases with age (Figure 26) and is higher for women than men. The rate of consultations among younger people (up to the age of 35) has fallen (Figure 27). By contrast, the rate of use among older people, especially those aged 75 and older, has increased significantly. This is likely explained by the rising number of patients with long-term conditions, many of whom have complex needs and require longer consultations.
Figure 26: Consultations in general practice by age and gender, rate per 1,000 (2017/18)
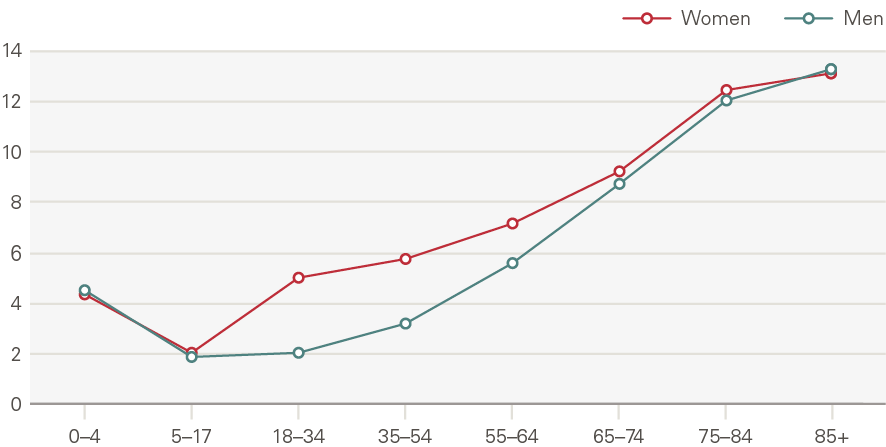
Source: CPRD
Figure 27: Annual growth in rate of consultations in general practice by age and gender (2000/01 to 2017/18)
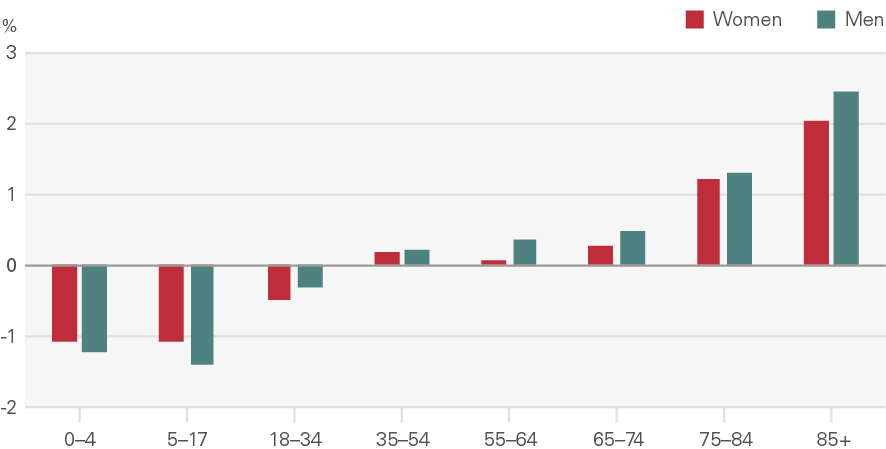
Source: CPRD
In contrast to consultations in general practice and community services, little of the growth in community prescribing can be explained by population growth. The number of community prescriptions increased by 96% from 2000/01 to 2018/19, or 3.8% per year (Figure 25).
One notable factor in explaining the growth is cost. Figure 28 looks at the change in the number of prescriptions and also the change in total spend for the top ten drugs by volume as defined by the British National Formulary (BNF). This shows the increase in cardiovascular drugs and drugs for the central nervous system has come with lower spending, reflecting a fall in the cost per drug as items come off patent and are replaced by cheaper generic alternatives.
Figure 28: Change in number of prescriptions and total spend, 2008–2018
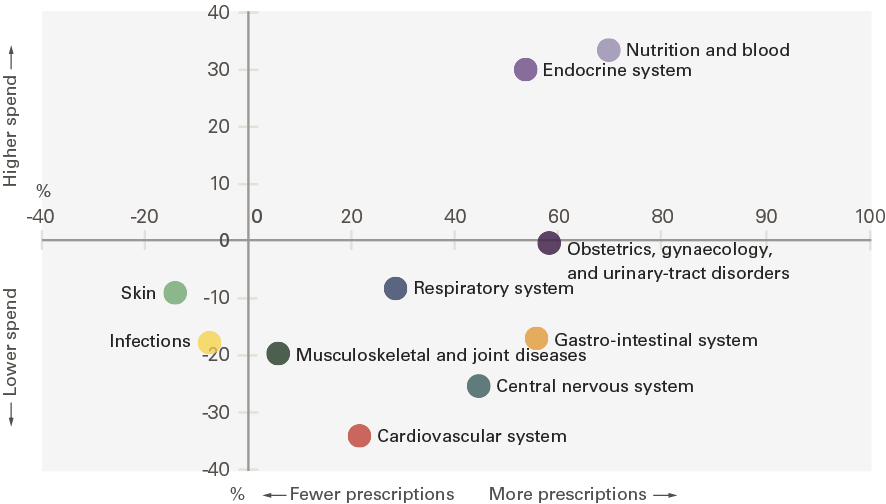
Source: NHS Digital, Prescription Cost Analysis; Costs adjusted using GDP deflator
Policies, such as Transforming Community Services, emphasised the need to shift care outside of hospital, both by bolstering primary care and community services.87 Specific initiatives aimed to improve the management of long-term conditions (eg the Quality Outcome Framework), access to care (eg situating GP surgeries in A&E departments) and workforce capacity (eg task shifting to practice nurses). However, these have not been backed sufficiently by funding increases or, in general, with enough political attention. Community services in particular lack the clear metrics (eg waiting time targets) that other services have, making it more difficult to monitor progress and understand where there may be gaps.
Mental health services
What are mental health services?
Mental health services support people with a range of mental health conditions, from anxiety and depression to severe psychoses. Mental health is both a diagnosis and a specialty. Initially, most mental health conditions are discussed with a GP, and those with a high level of need are referred onto specialist services. Alternatively, a patient may present at hospital and from there be treated and/or signposted to a mental health service. At hospital, those who require intensive care may be admitted; those with less intensive needs may be seen as an outpatient. Consequently, care can take place as a hospital inpatient, outpatient, or by specialist services in the community.
Table 7 shows the scale of mental health services in 2017/18 delivered by NHS Trusts and Foundation Trusts. Note, significantly more outpatient attendances are recorded by Hospital Episode Statistics (HES) data, which includes care funded by the NHS but delivered by non-NHS providers.
Table 7: Mental health activity and costs, 2017/18
|
Service |
Activity |
Estimated unit cost |
Estimated total cost |
|
Hospital mental health |
|||
|
MH elective and non elective finished consultant episodes (FCEs)**** |
135,000 |
£1,886 |
£254m |
|
MH outpatient appointments†††† |
67,000 |
£167 |
£11.3m |
|
Community mental health |
|||
|
Specialist MH care (initial assessment) |
874,000 |
£307 |
£268m |
|
Specialist MH care |
236m |
£18 |
£4,227m |
|
Adult IAPT (initial assessment) |
781,000 |
£121 |
£95m |
|
Adult IAPT |
849,000 |
£353 |
£300m |
|
MH care in secure facilities (initial assessment) |
35,000 |
£870 |
£30m |
|
MH care in secure facilities |
1.4m |
£521 |
£726m |
|
Other specialist MH services |
6.6m |
£232 |
£1,535m |
Source: NHS reference costs
As shown in Table 7, the majority of mental health spend (more than 90%) is delivered by specialist mental health services (community mental health). Community mental health covers a range of services, including specialist services for adults and older people, the Improving Access to Psychological Therapies (IAPT) programme and services such as drug and alcohol rehabilitation and Child and Adolescent Mental Health Services (CAMHS).
Growth in mental health services
The chart below shows the annual growth by service. This shows that there has been a rapid decrease in admissions and bed days, but strong growth in outpatient appointments. However, it is worth noting that outpatient growth stalled after 2010/11.
Figure 29: Annual growth for mental health services: projected by demographics, explained by other factors and observed
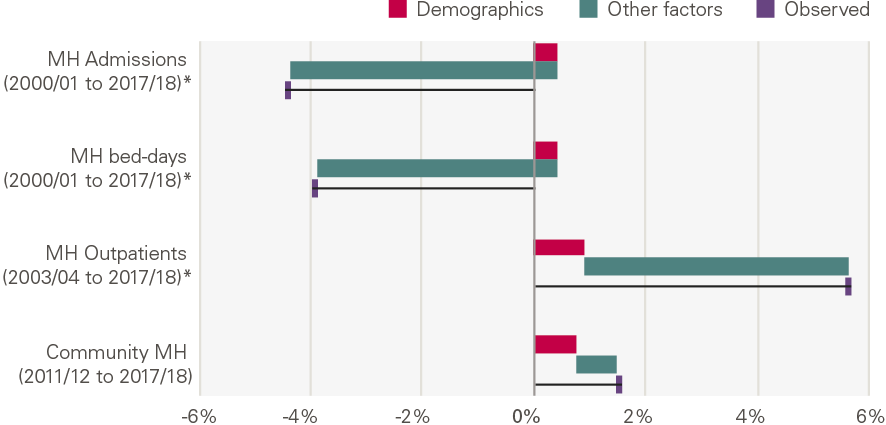
Source: Various, see Annex.
What explains the growth?
In community mental health, the biggest component of care, we are limited in our ability to explore and explain the growth in activity as a reclassification means data prior to 2011/12 are not comparable. Community mental health is also defined in relation to a mix of contacts and care clusters – here we present an aggregated index.
The amount of care increased in 2012/13, with 16% growth that year, but has since fallen (Figure 30). Activity was 9% higher in 2017/18 than in 2011/12, or 1.5% per year. The increase in population size explains much of this growth.
Figure 30: Community mental health services; activity and activity per person (index, 2011/12 = 100); annual growth in activity
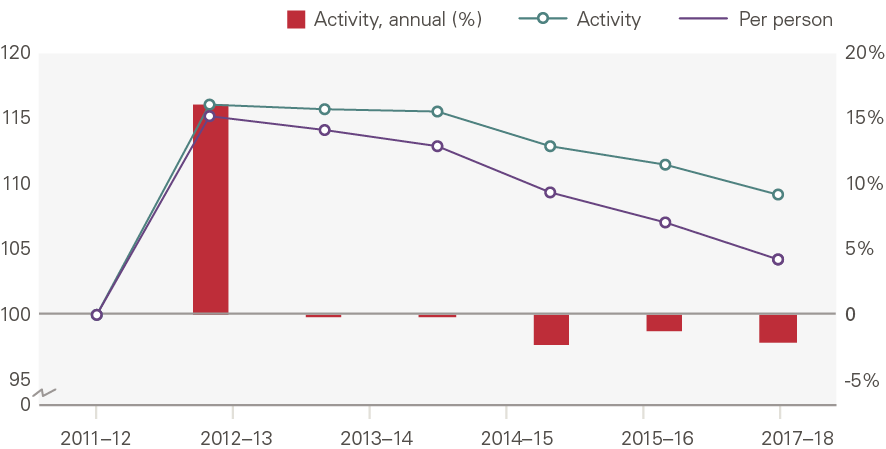
Source: NHS Reference costs
There have been elements of growth in provision. Considering IAPT, a programme of talking therapies for people with low-moderate level depression and anxiety, the trend is very different. The number of people entering treatment per year grew 152% over this period, or 17% per year. Just 5% of this growth can be explained by changes in the size of the population, with the remaining 95% unexplained. This rapid growth is unsurprising as this programme was set up as a result of a major policy drive to increase the availability of psychological therapies. Decreased stigma around mental health and increased willingness to seek treatment have likely further contributed to the growth.
Considering care in acute hospitals, mental health admissions and bed days have both seen a decline. The number of mental health admissions declined 53% between 2000/01 and 2017/18, a steady 4.4% per year. By contrast, our model estimated that appointments would increase 0.4% per year. This is due to a drive to treat patients in the community or outpatient settings, which led to a marked reduction in mental health beds. This is reflected by weak growth in FTE hospital doctors and a reduction in mental health nurses over the period. However, there is some evidence the shift away from inpatient care may have gone too far.
Mental health outpatient treatments have increased by 116% between 2003/04 and 2017/18 or 6% per year. Notably, growth was rapid in the first decade, increasing 12% per year between 2003/04 and 2010/11, but was flat thereafter. Unlike mental health admissions, then, the other factors in our framework beyond demographic factors contributed to an increase in appointments and amounted to 4.7% of growth per year. The rate of outpatient appointments has increased most for young females (aged 5–17). This may reflect a rise in eating disorders among this group.
** There is significant uncertainty over this estimate.
†† Non-elective short and long stays, excludes mental health and maternity (covered below); activity is a count of finished consultant episodes; costs include cost of excess bed days.
‡‡ NHS Direct was set up in 2000. The service was replaced by NHS 111 in 2010, although the transition to NHS 111 was not completed until 2014.
§§ Outpatient appointments excludes mental health (covered below)
¶¶ Electives excludes mental health and maternity (covered below), activity is a count of finished consultant episodes, costs include cost of excess bed days
*** Currency code starting NZ in NHS reference costs, includes ante-natal, delivery and post-natal care; activity is finished consultant episodes (FCEs); costs include cost of excess bed days.
††† Includes consultations delivered by other health care practitioners; cost is calculated by applying unit costs by health professional and mode to the estimated volume of consultations.
‡‡‡ For primary care consultation data, we use CPRD, a primary care dataset in England. As this is one of several datasets used in primary care, and does not therefore contain the whole population, we present the main results as rates of consultation.
§§§ Note, community mental health is defined in relation to a mix of contacts and care clusters, which help determine payment.
¶¶¶ See Annex for more detail.
**** Elective and non-electives with a currency code starting ‘WD’ or ‘PX09’
†††† Outpatient appointments with service code starting ‘71’ or ‘72’.
Discussion
Summary
Activity measures are used across the NHS. Measures of recent and past activity are used in monitoring against plans and contracts between commissioners and providers. Estimates of potential future activity – needed to achieve specific ambitions under different future scenarios – are used to inform decisions about future levels of funding and staffing. And local service planners, working within an overall budget, will estimate changes in activity levels in different settings resulting from changes to policy or services – such as opening a new minor injuries unit, or investing in a falls prevention service.
Over the past two decades the amount of care the NHS has provided has, in many cases, substantially exceeded the amount expected based on changes in demographic factors. However, this is not universal and within that global increase the pattern varies considerably for different services.
Overall growth
Overall, the NHS has seen significant growth in total activity over the past two decades. The amount of care provided by the NHS increased by 114% between 2000/01 and 2017/18, an annual average of 4.6% per year. We estimate that hospital activity increased 4.7% per year, with planned care (6.1%) growing by almost 2.5 times the rate of emergency care (2.6%).
The expansion in activity means the population receives significantly more health care today, which has contributed to lower mortality rates for a range of conditions and, up until 2010, increasing life expectancy. However, improvements and increases in care have not been uniform over the past two decades. Between 2000/01 and 2010/11 activity rose by 5.3% a year, quality of care improved, and life expectancy grew by nearly 3 months a year for women and almost 4 months a year for men. As funding slowed after 2010 so activity slowed; between 2010/11 and 2017/18 activity grew by 3.6% a year, quality gains slowed and life expectancy has stalled overall and for some groups (notably women younger than 50 in deprived areas) declined.
The extent of the growth in health care activity differs across services, meaning there have also been major shifts in the composition of output and spend by the NHS (Figure 31).
Figure 31: Annual growth by service: projected by demographics, explained by other factors and observed
Source: Various, see Annex, *full model
The pattern here is one of a shift from community and primary care to hospital care and, in particular, to diagnostics and elective procedures. This is in spite of explicit policy ambitions to shift care from hospitals to the community.
This has been accompanied, and possibly enabled, by large reductions in the average unit costs of diagnostic and elective procedures. For elective care, this has been achieved by two changes:
- a shift away from care with an overnight stay (average cost £3,894 in 2017/18) – in 2000/01, 33% of elective procedures were inpatient; in 2017/18 the figure was 5%; and
- the rapid growth in much cheaper (average cost £140) outpatient procedures – they now account for 62% of all planned procedures.
Improvements in technology allowing more outpatient procedures and day cases is one factor leading to the increase in elective procedures. Likewise, the falling price of certain drugs helps explain the rapid volume growth in community prescribing as drugs become relatively better value for money (compared to other uses of the budget).
As such, shifts in spend have been less dramatic than shifts in activity. However, this may also reflect the difficulty in reallocating spend across services. This may have contributed to ongoing challenges in shifting care from hospitals to our communities.
The contribution of demographics
Demographic factors appear in our framework as a determinant of the demand for health care. Where possible in our analysis we have accounted for population size, age and gender – factors that can be modelled and are commonly used by NHS planners to project forward activity. In addition, we model proximity to death, because for some forms of health care it is not age itself that is the biggest determinant of use, but how close the person is to death.
Overall, our analysis shows that demographic changes explain only a small part of the 114% growth in the total amount of care the NHS has delivered over the past few decades.
In planned hospital care this is particularly striking, with over 90% of the growth unexplained by demographic factors. This is not unique to England. Research has found that across the OECD ageing accounted for just above one-tenth of the increase in government health expenditure per capita between 1995 and 2009. For the UK, ageing explained an even smaller proportion of the growth in expenditure. Real health spending per person grew by 4.6% a year over this 15-year period, with ageing accounting for growth of just 0.2% a year.
However, there are several services that do not follow this pattern. Population growth and ageing explain a relatively high proportion of activity growth in a few services (A&E attendances, consultations in general practice and community health services). This is not because these factors have a larger absolute impact in these areas, but because growth as a result of the other factors in our framework is much lower.
In terms of proximity to death, the number of people in the last two years of life is expected to rise over the next 20 years. This will impact on overall NHS resources and the mix of services. Planning for reductions in emergency admissions against this background is unrealistic, particularly given the growth in admissions seen during a more benign period. If the NHS systematically underestimates the amount of emergency care it needs, this has a potential impact on the quality of emergency care but also knock-on consequences for planned care. This is because operations will have to be delayed or cancelled if capacity is constrained and beds and operating theatres are full.
What explains the growth?
The fact that demographic factors alone do not explain the growth has consistently caused us to ask: what explains the growth? Within each area of care, we have explored this using our framework, outlining major policy changes and supply and demand side factors that may explain the remaining growth.
Policy and political choices
Many of the drivers in our framework, particularly those driving the supply of health care, result directly from political and policy choices. The level of funding is a major choice. It is linked to decisions about pay for NHS staff, which determines how much of any funding increase is available for increases in activity.
The way in which providers are paid is an example of how policy affects supply, highlighted by the OECD in a study of the role of institutions and policies as a driver of health care spend. The NHS operates many different provider payment schemes. Broadly, GPs are paid on a capitation basis, with payment dependent on how many patients they have registered, rather than the amount of activity they do. However, many hospital services – such as elective care – are paid for on the basis of the amount of activity that is carried out. This creates a mechanism to fund increasing activity, eg more procedures, and may be part of the explanation for the rapid growth in hospital planned care.
Government sets priorities for the NHS. These shifted over the two decades and also play a part in explaining some of the trends. In the early 2000s there was a big focus on reducing waiting times for planned care. This was to be achieved through additional NHS funding, the target of a maximum 18-week wait from referral-to-treatment and the introduction of payment systems that helped fund increased elective activity. Overall, this was successful: elective procedures increased by 9.6% a year through the period. By contrast, although a move from hospital to primary and community care was advocated, it was accompanied neither by increased funding or waiting time targets, likely contributing to the much smaller growth in consultations in general practice and community care.
In the second decade, marked by slow growth in funding, policymakers’ emphasis was on efficiency and productivity improvements. Significant cost savings/efficiencies were achieved through a public sector pay freeze which held down the wages of NHS staff. Combined with productivity improvements, this ensured that, although growth in activity was slower than in the first decade, it did not slow as much as the growth in funding. Another strand of the policy drive to improve efficiency were efforts to reduce growth in ‘unnecessary activity’, such as emergency admissions to hospital for conditions that could be treated elsewhere. Despite various initiatives to reduce emergency admissions, such as attempts to make care more integrated through new models of care, these saw consistent growth across the period.
Supply
Evidence suggests that supply side factors and policy may be important determinants of changes in health care expenditure. Supply side drivers are more amenable to influence by policy – particularly over the short term – than demand sides drivers, particularly population size and age structure. The OECD has looked at the impact of supply-side policies and institutions on public health spending. Supply-side decisions can affect the unit costs of health care, while others directly affect the amount of health care activity.
A major factor identified is the overall funding for the health system and the stringency of any budget cap. In England, the NHS budget is predetermined and fixed. This determines the level of inputs (staff and equipment) to the NHS, which in turn influences the growth in activity. Beyond simply the level of inputs, decisions on different aspects of workforce and hospital supply set capacity and can thereby suppress or stimulate demand. We see many examples of this in our analysis.
Workforce may explain why there has been growth in some areas and not others. The number of specialty doctors in the NHS grew by an average of 8.2% a year over this period, well above the 2.0% per year seen for the overall workforce. This meant that there was more capacity for doctors to refer patients and to undertake outpatient procedures as technology advanced. Conversely, the plateauing number of GPs since 2010 may explain the slow growth in consultations, below the levels expected from population growth and ageing.
Additional capacity (hospital beds, theatres and diagnostic equipment) can inadvertently increase activity, even if this is not intended. The Any Qualified Provider policy increased capacity by allowing private providers to bid for contracts. The aim was to use competitive pressure to improve quality by allowing consumers to choose between providers. However, a study showed that private sector hospitals created demand: their entry into an area increased the number of publicly funded hip replacements by 12% but did not reduce volumes at incumbent public hospitals, and had no impact on readmission rates.
The reduction in hospital beds – a fall of 31% since 2000 – has also had an impact on the composition of activity. Pressure to reduce beds has led to (or been facilitated by) a reduction in length of stay and a shift away from inpatient admissions to day cases which, as previously described, are much cheaper. These reductions can have mixed consequences: improving efficiency in some areas but contributing to an increase in bed occupancy levels – from 87.1% in 2010 to 90.7% in 2019. This has meant hospitals have struggled to find beds for patients, putting pressure on A&E waiting times.
The final driver we have identified is technological progress. Progress and technological change lie behind much of the growth in outpatient procedures, which increased fivefold over the period. The number of MRI scans – and diagnostic tests in general – has also increased as the price of scanners has reduced. The increase in testing may have led to greater identification of patients with conditions for which treatment is beneficial, leading to additional demand in other parts of the health system.
Research and development spend (public and non-public) drive where technological progress takes place, as do the areas of specialisation within the medical profession where new research is taking place. The priorities for this spend may not match the needs of the population.
Although technological progress itself is largely outside the influence of NHS policymakers, it is shaped by decisions about investment and research. How technology is adopted within the NHS can be influenced. NICE, established in 1999, has a clear role in this area, publishing guidance on the use of new health technologies, such as new and existing medicines, treatments and procedures. However, much innovation, such as in surgery, lies outside the scope of NICE appraisals. Patient Reported Outcome Measures (PROMs) are another way of assessing the contribution of some high-volume hospital procedures, such as hip replacements, but only limited amounts of this information are routinely available to service planners or commissioners, and it is unclear how much is used in planning.
Demand
Over the past two decades a greater proportion of people at a given age are living with long-term health conditions, and healthy life expectancy has not kept pace with improvements in overall life expectancy. This is widening existing inequalities: there is an 18-year gap in healthy life expectancy between the least and most socioeconomically deprived populations. As a result, more people are living more of their lives with long-term health problems. This could be one factor contributing to the growth in elective procedures which, as described, have risen by considerably more than explained by population growth and ageing.
Changes in the health of the population and prevalence of conditions will affect different types of activity in different ways. As described in our analysis, over the past two decades planned care grew at much faster rates than primary and community care. This may reflect the way changes in patterns of ill health combine with changes in technology. Recent projections for England suggest that between 2015 and 2035 multimorbidity will increase, with more of the gains in life expectancy being spent in poor health with multiple long-term conditions. Understanding the potential impact this may have on overall demand for NHS services and the way this will vary for different types of care is clearly very important.
The diseases that contribute most to health care activity are changing. For the leading causes of morbidity most people will rely on the care of their GP, supported by outpatient specialists, diagnostic investigations and procedures, and some planned surgery. If these conditions are well managed, they should not result in emergency hospital admissions. New technologies are available to ensure conditions can be better diagnosed and managed (for example, advances in imaging for heart failure). However, the relatively meagre growth in primary and community care may well be contributing to the consistently high growth in emergency admissions. Investment in public health and prevention could go further and improve the underlying health of the population.
Over time, what the public expects from the NHS also changes. There is significantly more information available to patients, contributing to a growing awareness and perceptions of what health care and treatments are available.
More people with a condition may approach health services to seek treatment. An example here is the growth seen in certain areas of mental health care. Over the past two decades, service use has also increased, with an estimated one in three people with a common mental health problem using mental health services in 2014, compared to one in four in 2000. This growth may reflect genuine change in the disease burden. However, it may also reflect an increased public willingness to disclose a mental health problem and seek treatment, triggered in part by decreased stigma around mental health.
Lessons for the future
Summary
Over the past two decades the quantity of what the NHS does – the amount of activity – has doubled and this increase has outpaced the growth in demand that arises from demographic factors. Overall, our analysis suggests that the amount of care provided by the NHS since 2000/01 would have needed to grow by around 1% a year to meet the demand pressures arising from these demographic changes. This means that more than three-quarters of the growth in NHS care since 2000/01 is the result of other factors relating to demand, supply, political priorities and health care policies.
The growth in excess of that explained by demographic change varies across different services, showing that the drivers affect different services in different ways. For example, changes in morbidity affect demand differently – a reduction in the prevalence of injuries amongst younger people reduces the demand for A&E, but not to the same extent demand for outpatient services. Similarly, some services are more affected by technological progress – eg prescriptions of drugs (new drugs become available and the price of existing drugs reduces). Variation between different time periods is often the result of prevailing policy priorities (eg the push to reduce waiting times in the first decade).
Looking at the overall changes in the volume and pattern of care provided over the past two decades, it is clear that some of the changes have been despite – rather than because of – the stated policy goals of successive governments and system leaders. Indeed, we have seen things happen that fundamentally counter the stated intentions.
This leads us to suggest six lessons for the future.
1. In the long term, what the health care system does is largely determined by choices. Clear population health goals are needed to help steer these choices.
The contribution of demographic factors to growth is relatively small. Other drivers of change are not well understood, but are within the influence of policymakers if we consider the full range of policy instruments available, especially over a longer time horizon.
We have seen significant shifts in the composition of services and in what the NHS does. But it is not clear whether the changes observed have maximised the health impact of the NHS in England. Decisions have increasingly focused on processes and the organisation of the system, while leaving the overall goals of the system, such as reducing inequalities and increasing life expectancy, less clear. We need clearly stated population health goals against which to judge the decisions taken.
2. A better understanding of the contribution of different services to population health, and what this means for the future composition of NHS services, is required.
The shifts in activity we have observed have not necessarily been in line with those needed to meet the changing patterns of the population, or those that would make the biggest contribution to population health. For example, the growth in the prevalence of multiple long-term conditions suggests that there should have been a relative shift in activity towards prevention and primary care services; this has been the policy rhetoric too.
If the NHS is to maximise its contribution to population health, there is a need to better understand what composition of services the NHS should have going forward. This means developing a better understanding of the changes in patterns of morbidity.
It also means understanding the contribution of different services to improving health. Over the period covered here we have seen a rapid growth in hospital services. This growth started with the aim of aligning the NHS with similar countries internationally, in terms of access to hospital services and care outcomes. However, this has led to hospital activity crowding out other forms of activity. We therefore need a better understanding of the value of additional hospital activity compared to the value of other services in addressing the challenges of the future. These include contributions to improving healthy life expectancy and reducing inequalities.
3. A systematic national projection of future trends in morbidity is needed to inform national and local NHS planning.
Research on the sustainability of health care systems consistently shows that the future path of morbidity is a key determinant of future health care demand and funding requirements.
Previous projections by the Health Foundation and Institute for Fiscal Studies (IFS) showed that for 18 conditions the probability of admission standardised for age had increased by 57% between 2007/08 and 2017/18, with the greatest increase for people with multiple conditions – a growing group in the population. The analysis found that if these trends continued for the next decade, long-term conditions would have as great an impact on hospital activity as ageing.
Currently, there is no systematic national projection of future trends in morbidity undertaken to inform national or local NHS planning. This is a clear gap. If changes to the composition of NHS services are to meet the future health needs of the population, we need good projections of those needs. As the types of services needed by different groups of patients differ – from diabetes to cancer – projections need to cover different forms of morbidity, and, increasingly, multi-morbidity.
4. There is a need for more sophisticated models of future activity and health outcomes, incorporating other important drivers of growth as well as demographic factors.
We have discussed a number of other drivers of growth within the broad categories of demand, supply and policy. Factors as diverse as workforce planning, morbidity, patient expectations and drugs and technology can all have an impact.
Currently, the exact role these factors play in activity growth is not well understood. Consequently, these are rarely included in future projections of activity. There is a need for more sophisticated models to project future activity that include other drivers of changes, as well as the underlying demographic drivers.
The REAL Centre will create models incorporating these factors, with an initial focus on modelling the workforce (starting with nursing supply and the social care workforce), and the impact of changes in risk factors on morbidity and subsequent health care use.
There is growing analytical capability within the NHS, but further investment is needed to ensure analysts have the skills they need (eg capability in systems dynamics modelling or marginal analysis). This also includes the space and cultural environment where this type of work and research is valued and supported.
5. Technology is one of the most powerful factors shaping both demand (a new treatment makes it possible to address an unmet need) and supply (drug therapies replacing complex surgery).
The UK is a world leader in research and the NHS makes a vital contribution supporting clinical trials. Innovation is inherently unpredictable and complex, but that makes it more important to try to understand the forces shaping decision making.
New technology has been a key driver of activity, but it may not always have provided value for money. How technology is funded and adopted is very much under the influence of policymakers, though this influence could be extended and strengthened. NICE, for example, appraises new technologies and recommends whether they should be funded by the NHS.
6. Shifts in activity take time and there is a need to be realistic about what can be achieved.
Many of these shifts have evolved gradually over time. Some trends have been the result of decisions taken decades earlier. Once allocations in spend are set, it is difficult to make major changes during an annual budget review. Changes are easier at the margins (when allocating additional funding); divesting from services is much more challenging.
Likewise, it takes time for individuals working at the NHS front line to respond to policy frameworks and incentives. Some initiatives, such as targets, may be politically difficult to remove. Although decisions may make sense when seen locally and at a particular point in time, from a global perspective and in future years they may not be seen as optimal.
A better understanding of the factors we have discussed combined, with better approaches to dealing with uncertainty and the dynamics of the system, will help policymakers recognise the limits of what can be changed, to what extent and how quickly.
In summary, what is needed is a strategy for investing in the NHS based on evidence, analysis and modelling. This needs to able to be adapted regionally to allow for differences in population health and health care system.
Conclusion
The past two decades have seen significant shifts in what the NHS does. While activity overall has doubled, growth has not been spread equally between services.
In hospital care, particularly in planned care, we have seen growth far beyond what we would expect due to demographic changes alone. In some ways this demonstrates the impact policymakers can have. An issue was identified: long waiting times for a number of planned procedures, linked to adverse health outcomes. Funding was increased, specialised staff recruited, and high-profile, politically important targets set, supported by technological advances. In many ways this is a policy success – activity grew, waiting times for routine treatment went down.
However, this focus on hospital care has had consequences. Although there has also been an ambition to move care into the community, primary and community care services have not seen the same growth and are struggling to meet the demands of a population with an increasing number of long-term, complex conditions.
This illustrates the importance of considering and, where possible, modelling the consequences of different policy choices – and in taking a whole system view. In this report we have outlined a framework for examining the potential factors that influence activity. Sophisticated models take time to build, but considering these factors when new policies are introduced could illuminate potential consequences.
Our work suggests that while understanding demographic trends is important for planning health services, it is a relatively small driver of the growth in care over recent years – explaining less than a quarter of the 4.6% a year average growth in NHS activity. The NHS therefore needs a much better understanding of the demand and supply side factors that collectively contribute to the volume and pattern of care. To do this we need to fill the evidence gaps with more and better research. We need to understand the potential impact of trends in demand and supply, and how policy can influence and shape them. Last but not least, the NHS needs frameworks and approaches to using this evidence, which help it to make better decisions given the inherent uncertainty and complexity of the factors shaping the health system.
The NHS faces a number of important decisions as it emerges from the COVID-19 crisis, posing an opportunity to align future investment more closely with the changing health needs of the population. The REAL Centre will work to provide evidence and analysis to inform these decisions and build on our understanding of the factors influencing growth.
Annex: Data and methodology
We have relied on a small number of key data sources when analysing health care output and activity. For total NHS output, we used the public service productivity estimates for health care in England produced by the ONS. NHS reference costs data were used to understand the average unit cost and activity delivered by NHS Trust and Foundation Trusts by service.
Methodology
We model demographic factors that are readily available and relatively easy for planners to project into the future – and therefore useful in planning. These include: size of the population, age, gender and proximity to death. For proximity to death, we use successive years of HES or CPRD data supplemented with information regarding an individual’s death from linked ONS mortality data.
We use a nested modelling approach to estimate the relative scale of the effect of changes in population size, the age and gender makeup of the population, and proximity to death (as a proxy for levels of morbidity) on activity.
We start with an initial model – with time as the sole explanatory variable – that estimates the absolute increase in attendances. This model takes no account of changes in population size, the age and gender makeup of the population or levels of morbidity. We then expand the model, adding one factor at a time until all potential explanatory factors are included. At each stage, we use the model to generate a prediction for the overall number of units of activity (attendances etc).
In effect, we create a counterfactual estimate of attendance numbers by applying the modelled relationships between our explanatory factors and attendances to the population in the final year. If the number of attendances predicted by the final model (including all potential explanatory factors) were only marginally different to the number of attendances in the final year, then we might conclude that these factors are sufficient to explain the observed trend.
It is possible that some of the explanatory factors listed above will be collinear. As such, the order in which the factors are introduced into the model will influence their reported effect on attendance numbers. The change in predicted attendances when a factor is introduced represents the additional change that this variable produces having taken account of all other variables in higher nest levels. For example, at nest level 3, the model adjusts for age, population size and the fixed effect of time.
Time period
As far as possible, we have sought to model the 20 years from 2000/01. In many instances, the latest available data are 2017/18. Where data were unavailable for the whole time series – for instance, HES data are incomplete for A&E attendances prior to 2010/11 – we project the contribution of model parameters from available data over the longest available time span. See the further notes in data definitions.
Results
The full set of results from our model can be found in the table below. This breaks out demographics into its composite factors: population size, age, gender and proximity to death.
Average annual growth rate by service area (%)
|
Service |
Time period |
Observed |
Demographics |
Other factors |
|||
|
Population size |
Age |
Gender |
Proximity to death |
||||
|
NHS111 calls handled |
(2000/01 to 2017/18) |
8.80% |
0.72% |
n/a |
8.04% |
||
|
999 calls |
(2000/01 to 2017/18) |
5.40% |
0.72% |
n/a |
4.65% |
||
|
Ambulance conveyances to A&E |
(2000/01 to 2017/18) |
1.20% |
0.72% |
n/a |
0.50% |
||
|
Minor A&E attendances |
(2003/04 to 2017/18) |
6.5% |
0.77% |
n/a |
5.8% |
||
|
Major A&E attendances |
(2003/04 to 2017/18) |
1.40% |
0.78% |
0.20% |
0.07% |
-0.06% |
0.40% |
|
Hospital admissions |
(2000/01 to 2017/18) |
1.90% |
0.72% |
0.20% |
0.06% |
-0.14% |
1.10% |
|
Emergency bed-days |
(2000/01 to 2017/18) |
-1.10% |
0.72% |
0.51% |
0.04% |
-0.24% |
-2.11% |
|
Outpatient appointments |
(2003/04 to 2017/18) |
3.80% |
0.78% |
0.19% |
0.09% |
-0.02% |
2.76% |
|
Diagnostics |
(2008/09 to 2018/19) |
5.80% |
0.77% |
n/a |
5.01% |
||
|
Elective procedures |
(2000/01 to 2017/18) |
9.60% |
0.72% |
0.26% |
0.06% |
-0.08% |
8.66% |
|
Planned bed-days |
(2000/01 to 2017/18) |
-3.50% |
0.72% |
0.57% |
0.03% |
-0.27% |
-4.55% |
|
Maternity admissions |
(2000/01 to 2017/18) |
0.5% |
0.84% |
n/a |
-0.3% |
||
|
Maternity bed-days |
(2000/01 to 2017/18) |
-1.1% |
0.84% |
n/a |
-1.9% |
||
|
Consultations in general practice |
(2000/01 to 2018/19) |
0.70% |
0.72% |
-0.09% |
0.02% |
0.03% |
-0.02% |
|
Community prescribing |
(2000/01 to 2018/19) |
3.82% |
0.72% |
n/a |
3.10% |
||
|
Community services |
(2004/05 to 2017/18) |
0.90% |
0.79% |
n/a |
0.08% |
||
|
MH hospital admissions |
(2000/01 to 2017/18) |
-4.40% |
0.72% |
-0.53% |
-0.04% |
0.27% |
-4.78% |
|
MH hospital bed-days |
(2000/01 to 2017/18) |
-3.90% |
0.72% |
-0.15% |
0.02% |
-0.15% |
-4.33% |
|
MH hospital outpatients |
(2003/04 to 2017/18) |
5.60% |
0.78% |
0.15% |
-0.03% |
0.02% |
4.73% |
|
Community MH |
(2011/12 to 2017/18) |
1.50% |
0.77% |
n/a |
0.69% |
||
Data definitions and sources
When modelling changes in activity, we rely on a range of sources, most often hospital episode statistics (HES). Note, this contains data for all NHS funded care, including that delivered by the non-NHS providers, which is missing in NHS reference costs. Importantly, this is a patient level dataset, meaning we can understand the profile of those using services, which informs our model. A full list of sources and definitions used in the modelling for chapter 4 are provided in the table that follows.
|
Area |
Series |
Definition |
Source |
Full model? |
Notes |
|
Unplanned care |
NHS 111 / NHS Direct |
Number of answered calls |
NHS 111 Minimum Data Set, NHS England https://www.england.nhs.uk/statistics/statistical-work-areas/nhs-111-minimum-data-set |
No |
NHS Direct was set up in 2000. The service was replaced by NHS 111 in 2010, although the transition to NHS 111 was not completed until 2014. |
|
Control room contacts |
Count of all ambulance control room contacts (A0) |
Ambulance quality indicators, NHS England https://www.england.nhs.uk/statistics/statistical-work-areas/ambulance-quality-indicators |
No |
||
|
Transfers to emergency departments (ED) |
Count of incidents with any patients transported to an ED (A53). |
Ambulance quality indicators, NHS England https://www.england.nhs.uk/statistics/statistical-work-areas/ambulance-quality-indicators |
No |
||
|
Attendances at major A&E departments |
Count of attendances at type-1 A&E departments |
HES A&E dataset; Unify2 system |
Yes |
There are two primary sources for administrative data on the number of attendances at A&E departments. Individual NHS provider organisations submit regular reports to a central repository and these reports are collated under the umbrella name ‘Unify2 collections’. For A&E attendances, the reporting is monthly and comprises aggregate counts of attendances for each provider. A consistent historical series exists from 2003–04. Hospital Episode Statistics (HES) provide a much richer source of information on patient-level hospital use taken directly from provider’s Patient Administration Systems (PAS). For A&E activity the HES dataset starts in 2007–08 but coverage in the first few years is incomplete. In more recent years, the main cause of difference between the two sources is that a number of smaller walk-in centres and minor injury units do not submit to HES. Unify2 does not include planned follow-up attendances. Unify is used for the full time series, while HES is used over a shorter period (2010/11 to 2014/15) to inform the model parameters. |
|
|
Attendances at minor A&E departments |
Count of attendances at type-2 single specialty departments, type-3 UTCs or MIUs, and type-4 walk-in departments |
Unify2 system |
No |
To avoid problems of comparability related to the increased supply of minor injury units and walk-in centres, we limit our full analyses to type-1 or ‘major’ A&E departments. |
|
|
Emergency admissions |
Count of admissions where the method of admission code denotes an emergency admission (code starts with ‘2’) |
HES inpatient dataset |
Yes |
Admissions where the main specialty or treatment specialty is mental health-related (specialty code starts ‘71’ or ‘72’) are excluded here. They appear in a separate mental health category. |
|
|
Emergency bed days |
Count of overnight bed days where the method of admission code denotes an emergency admission (code starts with ‘2’) |
HES inpatient dataset |
Yes |
See note above. |
|
|
Planned care |
Outpatient appointments |
Count of completed outpatient appointments |
HES outpatient dataset |
Yes |
Outpatient appointments where a procedure (diagnostic or otherwise) was undertaken are excluded here. They appear in a separate ‘planned care’ category; Appointments where the main specialty or treatment specialty is mental health-related (specialty code starts ‘71’ or ‘72’) are excluded here. They appear in a separate mental health category. |
|
Diagnostics |
Count of 15 key diagnostic tests and procedures. All referral routes and all settings are included |
Diagnostic activity, NHSE https://www.england.nhs.uk/statistics/statistical-work-areas/diagnostics-waiting-times-and-activity/ |
No |
One unit of activity is recorded for each distinct clinical test or procedure undertaken. For example, a patient having more than one MR scan of a knee at the same visit would count as one unit of activity. |
|
|
Elective procedures |
Sum of ordinary elective, day-case, regular day/night admissions, and outpatient appointments where a procedure was undertaken |
Yes |
Elective admissions defined by admission method code starting ‘1’, or patient classification code equal to ‘3’ or ‘4’; Admissions where the only procedure undertaken was one of a set of key diagnostic tests or procedures are excluded here as diagnostic activity is captured in a separate category; Admissions where the main specialty or treatment specialty is mental health-related (specialty code starts ‘71’ or ‘72’) are excluded here. They appear in a separate mental health category. |
||
|
Bed days |
Count of overnight bed days for ordinary elective admissions |
|
Yes |
See note above. |
|
|
Maternity |
Maternity admissions |
Count of admissions where the method of admission code denotes an emergency admission (code starts with ‘3’) |
HES inpatient dataset |
No |
|
|
Maternity bed days |
Count of overnight bed days for maternity admissions |
HES inpatient dataset |
No |
||
|
Primary care and community services |
Consultations in general practice |
Count of GP-led and other consultations |
CPRD GOLD |
Yes |
The analysis was of a sample of 1,688,836 patients from CPRD GOLD that were ‘active’ for any time period between 1 April 2000 to 31 March 2019. A patient is defined as active if they were registered at an English GP practice on or before 31 March 2019 and did not de-register for any reason (including death) prior to 1 April 2000. A consultation was defined as GP-led if the staff role code was 1, 2, 5, 6, 7, 8, 10, 47 or 50. The following staff role codes were defined as ‘other’: 3, 4, 9, 11–46, 48, 49, 51–68. Consultation types were defined using the constype code as follows:
Total consultations are the sum of face-to-face, home visits and telephone. All other consultation type codes were excluded and defined as administrative events. |
|
GP prescribing |
Count of all items (eg medicines, dressings, and appliances) prescribed and dispensed in the community |
Practice Level Prescribing, NHSD Prescription Cost Analysis, NHSD https://digital.nhs.uk/data-and-information/publications/statistical/prescription-cost-analysis |
No |
|
|
|
Community services |
Count of community services activity undertaken by NHS organisations. This activity is predominantly visits or assessments |
NHS reference costs |
No |
||
|
Mental health |
Mental health inpatients |
Count of admissions where the main specialty or treatment specialty is mental-health-related (specialty code starts ‘71’ or ‘72’) |
HES inpatient dataset |
Yes |
Admissions where the only procedure undertaken was one of a set of key diagnostic tests or procedures are excluded here as diagnostic activity is captured in a separate category. |
|
Mental health outpatients |
Count of appointments where the main specialty or treatment specialty is mental-health-related (specialty code starts ‘71’ or ‘72’) |
HES outpatient dataset |
Yes |
Appointments where the only procedure undertaken was one of a set of key diagnostic tests or procedures are excluded here as diagnostic activity is captured in a separate category. |
|
|
Community mental health |
This includes care delivered by specialist mental health teams (i.e. not in a non-specialist mental health hospital) |
NHS reference costs |
No |
Care clusters cover services for working age adults and older people. A care cluster counts caseload rather than activity as defined elsewhere. Not all specialist mental health services are captured by clusters; child and adolescent mental health services (CAMHS) activity, for instance, is reported separately. Note, Community Mental Health data were reclassified in 2011/12, meaning the data are not comparable with previous years. |