Introduction
The NHS in England is now halfway through its programme to revive general practice. In 2016, the General practice forward view committed an additional £2.4bn to reverse the decline in investment and recruitment in a sector it describes as the ‘bedrock’ of the NHS.
Much of the energy has been directed, necessarily, towards getting the basics in place. Ambitious targets have been set to recruit thousands of new doctors, pharmacists and other practice staff. Without this recruitment, overworked and understaffed practices will struggle to deliver the broader ambitions set out by NHS England in the forward view – to expand access, improve quality and put general practice at the centre of integrated services.
Alongside investment in staff and premises, there have been commitments to build skills and infrastructure to assist general practice to improve and develop. The General practice forward view promised access to better IT and data analytics tools for practices to use with their own data, and development programmes for practice staff. The Royal College of General Practitioners (RCGP) has emphasised the role of continuous improvement in delivering high quality care, and developed an online tool that offers learning modules – QI Ready – and a peer network to help GPs undertake quality improvement work.,
A collection of GP-level data on 12 indicators is being piloted to support practices with continuous improvement. Good data that can be shared between peers is central to efforts to improve quality, but such initiatives are landing in a rapidly evolving landscape of general practice organisations. A recent Nuffield Trust survey found that 81% of responding practices were working in formal or informal collaborations. These ranged from ‘super-partnerships’ and multi-specialty community providers to GP federations and looser networks of independent practices.
This briefing has been written to introduce leaders of GP organisations to approaches to data sharing that enable quality improvement, and to engage clinicians in collaborative learning and improvement efforts. By identifying case studies from a range of scaled up or networked organisations, this briefing aims to demonstrate the potential of data sharing in different contexts to drive improvements across general practice.
* A merger of three or more practices to form a larger operational unit with a substantially increased patient list size and income. For more information see: www.england.nhs.uk/south/wp-content/uploads/sites/6/2015/12/guide-mergers-gp.pdf
What we did: analysing the case studies
This briefing provides case studies of four organisations in England that have been early pioneers of sharing data across practices to enable improvement. We looked for teams that are sharing data between practices for the explicit purpose of improving quality of care. We conducted site visits and interviewed programme leads and team members from each of the organisations featured in the case studies. We then analysed transcripts to identify key themes and identified practical learning points for data-sharing approaches to quality improvement.
Except for the well-established Clinical Effectiveness Group (CEG), data-sharing collaboratives in general practice are at an experimental stage. It is too early to evaluate evidence of sustained impact, but insights from these case studies can show different methods of using data to improve care, and share practical learning from groups already experimenting with these methods.
Box 1: An example of what we mean by data sharing
In this briefing we use the term ‘data sharing’ to describe practices sharing data on an agreed quality metric or performance indicator, in order to produce comparative information that can be used to help improvement efforts.
Such an approach has been taken by the Clinical Effectiveness Group (CEG), a clinician-led service providing tools for GP practices, such as clinical templates, in-practice facilitation and health informatics across three clinical commissioning groups (CCGs): Newham, Tower Hamlets, and City and Hackney. In this example, sharing data between practices is an important enabler of improvement. The CEG is able to run searches from its headquarters, drawing in data from local practices. It then makes comparative data available between practices on agreed metrics, using learning from the best-performing practices to improve care in less well-performing surgeries. Its comprehensive approach to improving clinical effectiveness, explored in more detail in case study 1, has resulted in quality improvements and reductions in variation that exceed rates seen elsewhere in London and England.
Figure 1 shows an increase in the proportion of patients aged 65 and over having their pulse checked in the Tower Hamlets CCG area, from 36% in 2014 to 90% in 2017. This check is aimed at detecting an irregular rhythm, which is a potential risk factor for stroke. In addition to an improvement in average performance, variation between practices reduced markedly as a result of the CEG’s approach.
Figure 1: Number of patients aged 65 and over who have had their pulse checked in the last 5 years, 2014 and 2017
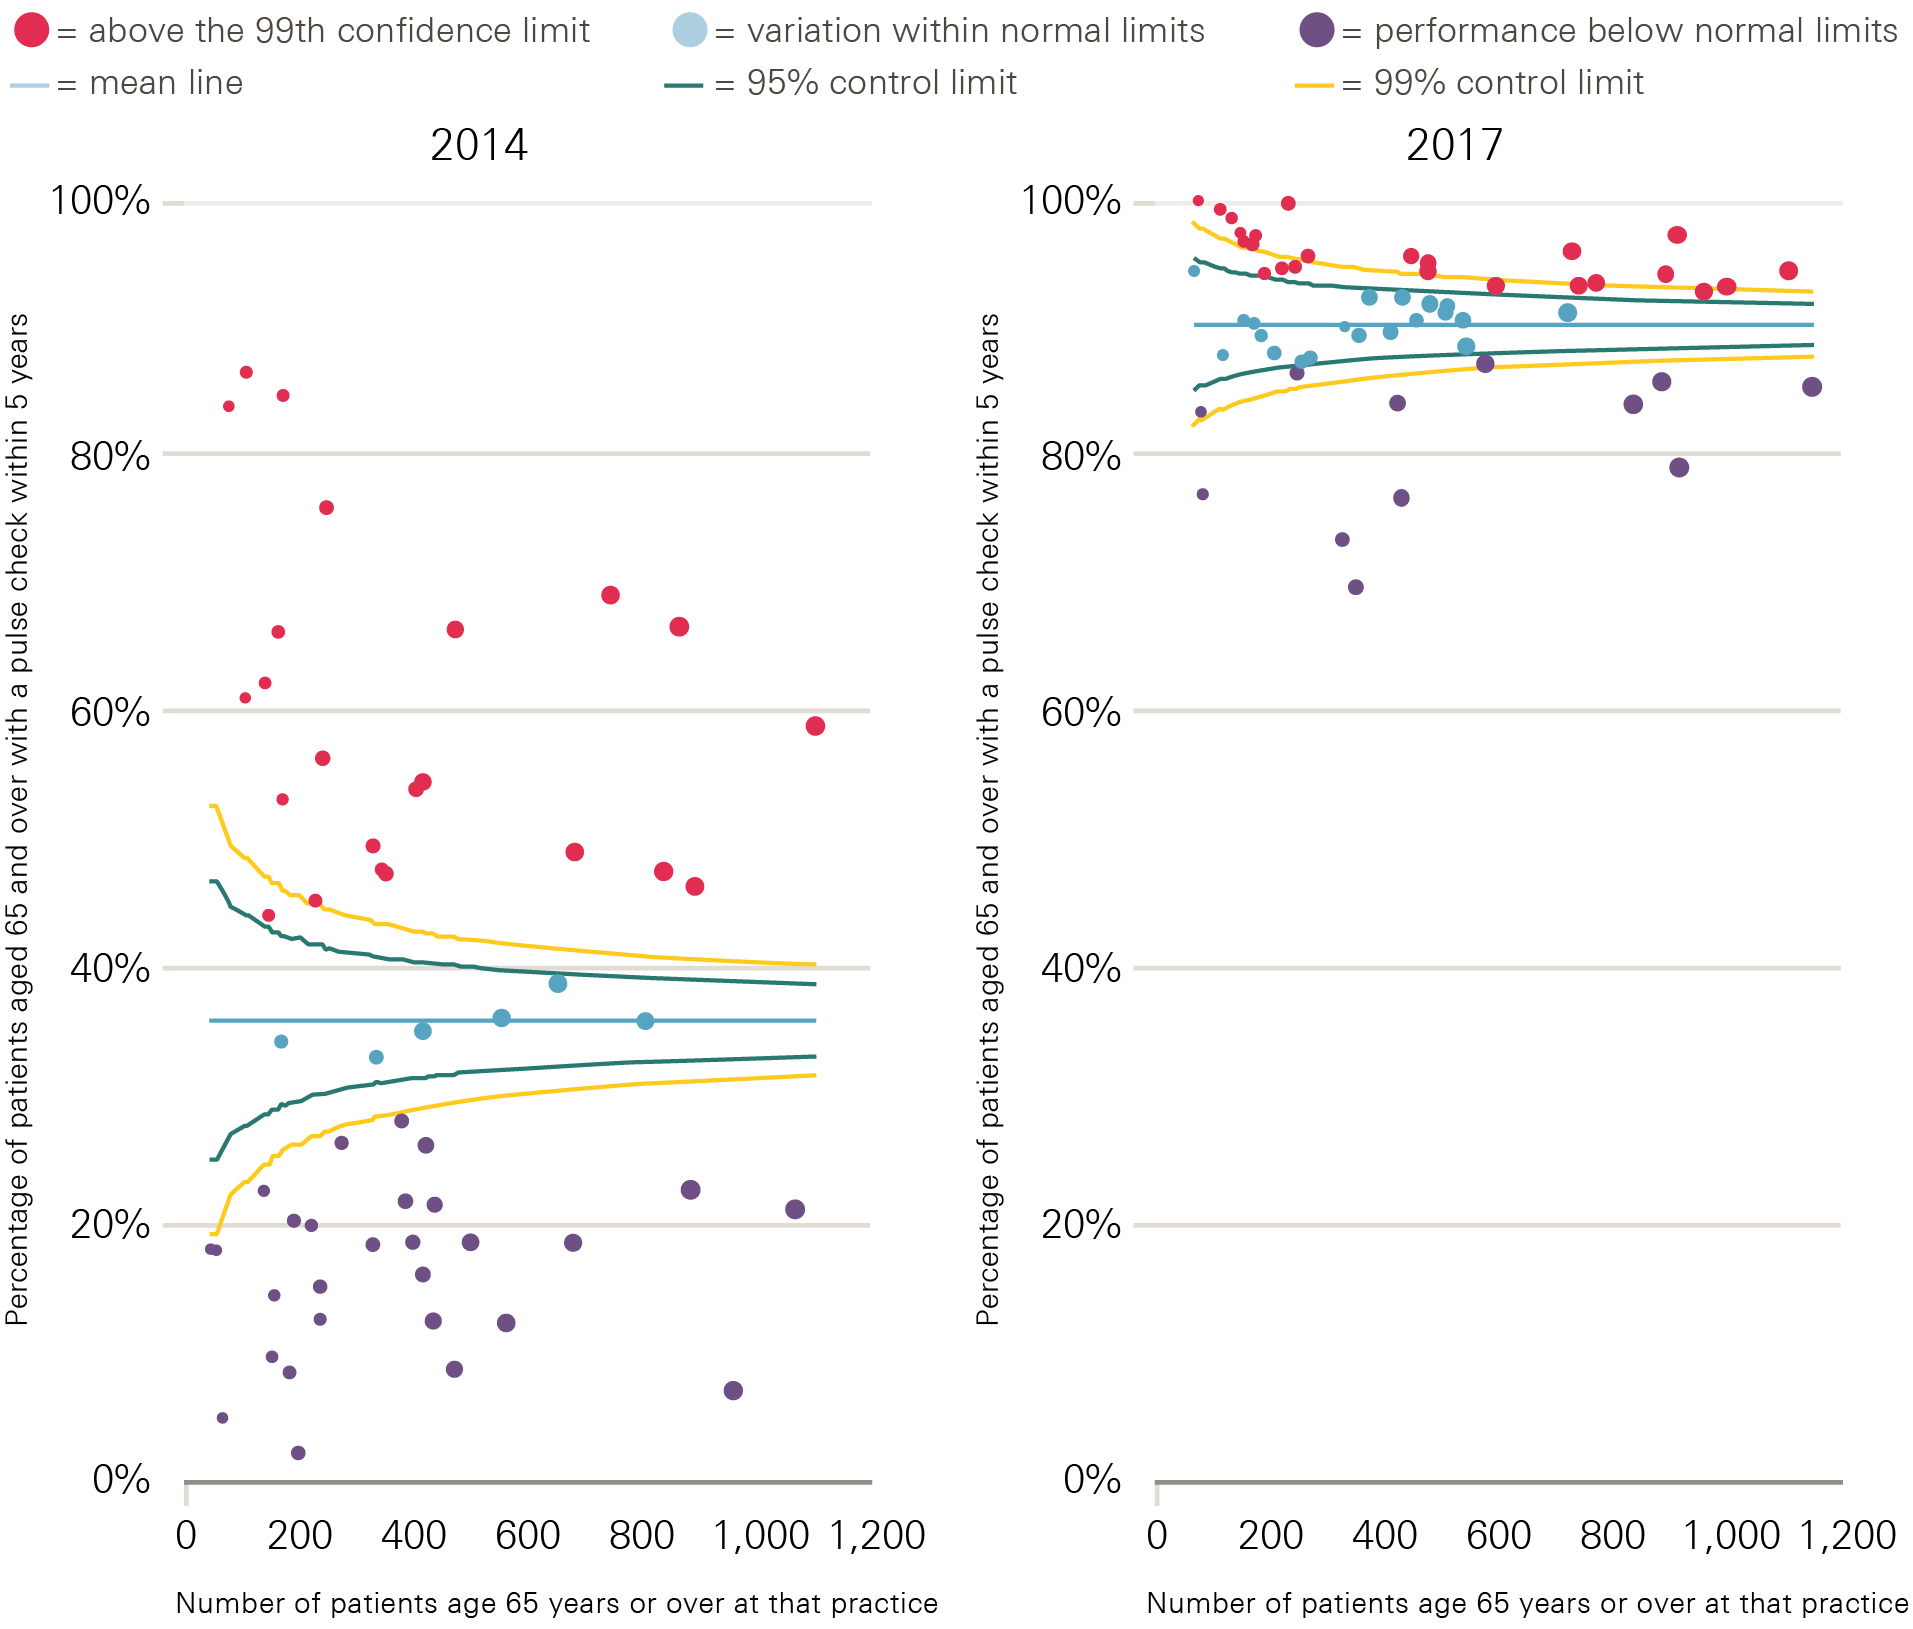
Note: Each point represents a practice within Tower Hamlets CCG, with the size of the data point corresponding to the number of patients aged 65 and over registered with that practice.
† Throughout this briefing we use the term ‘searched’ to mean interrogated to answer specific questions.
What we found: the case studies
Case study 1: The Clinical Effectiveness Group
Background
The CEG has been supporting primary care in a challenging inner-city environment in east London for more than 20 years. The organisation covers the three clinical commissioning groups (CCGs) of Newham, Tower Hamlets, and City and Hackney. Combined, these have a population of 800,000 people who are served by 150 general practices. Most of these are independent, while a minority are part of larger GP provider organisations. The CEG is in the process of extending its support to another five London boroughs.
The CEG promotes equality of access to effective primary care by translating new initiatives and research on quality and clinical excellence into inner-city areas through evidence-based guidelines. Its workforce of around 23 people includes GP clinical leads, data analysts, informaticians, practice facilitators and academic researchers, as well as administrative and management staff. Funding comes from CCGs, local authorities and research grants.
The CEG works in one of the most deprived areas of London, but also one in which significant effort and investment has been put into quality improvement. Tower Hamlets has had a quality improvement agenda since the 1990s, often driven through administrative bodies such as its primary care trust – the body responsible for commissioning health services from 2001 to 2013 – and subsequently through its CCG.
Since 2009, investment to improve the quality of primary care has supported the formation of clinical practice networks, each consisting of four to five geographically co-located GP practices, serving populations of between 30,000 and 50,000 patients. These networks are supported to deliver education to clinicians, and to work in line with the CEG method described in Figure 2, with financial incentives aligned to both improvement and collaboration. Practices receive additional income if their network’s combined average performance exceeds locally set targets.
Approach
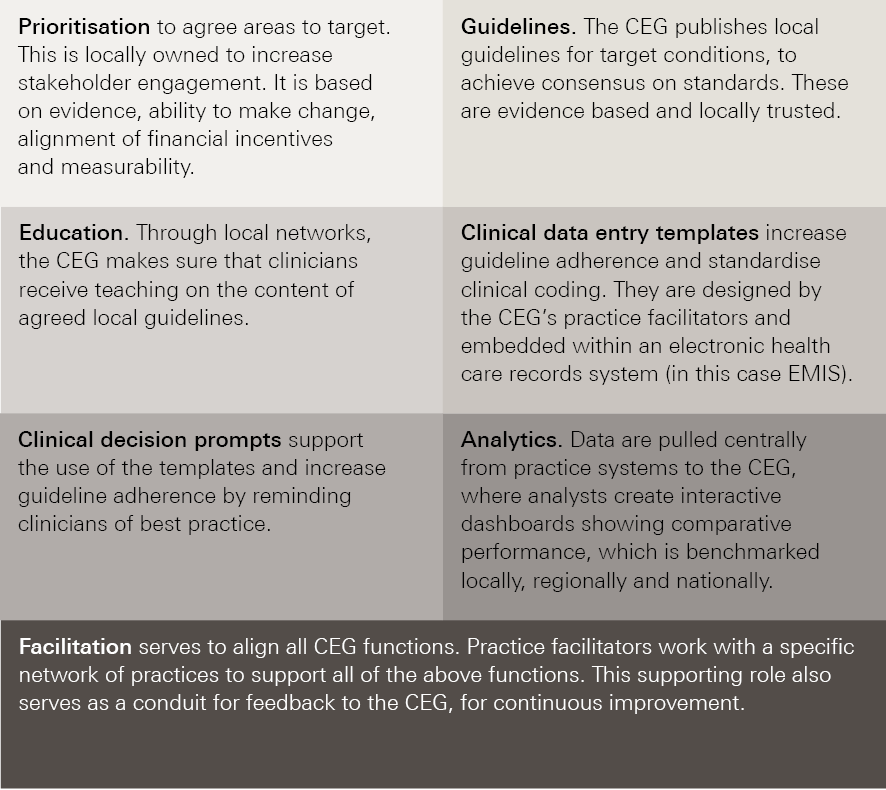
The CEG’s approach to systematically improving clinical standards and reducing variation in primary care in east London has been based around a change model made up of the following three elements:
- Belief – generating professional commitment and ownership through stakeholder engagement and consensus, and by providing evidence-based guidelines and tailored education.
- Action – making it easy to do the right thing via information technology support, customised templates and decision prompts.
- Motivation – providing comparative feedback, tailored dashboards and aligning efforts with other incentives.
The CEG has also maintained consistency over this period, focusing on four high-impact target areas, namely diabetes, chronic obstructive pulmonary disease, cardiovascular disease and childhood immunisations.
Figure 2: Core components of the CEG approach to data enabled improvement
Impact
In 2015/16 the CEG delivered five new clinical guidelines and 10 performance dashboards. It updated 60 bespoke clinical templates and supported practices with implementation – practice facilitators conducted more than 300 visits. This approach, in conjunction with wider improvement efforts in east London, has yielded significant reversals to previously poor performance.
Detailed descriptions are documented in peer-reviewed publications.,,, However, the following examples of improvements in blood pressure control across Tower Hamlets, City and Hackney, and Newham CCGs illustrate the effectiveness of the CEG’s approach. The CEG has worked with these CCGs since the middle of 2009.
Figure 3 shows that Tower Hamlets, City and Hackney, and Newham CCGs were not only outlier high performers in terms of the percentage of diabetic patients achieving target blood pressure control in 2016, but also that they achieved this despite significantly high deprivation levels.
Figure 3: Percentage of patients with chronic heart disease in CCGs in England achieving target blood pressures, compared with deprivation score of CCG, 2016
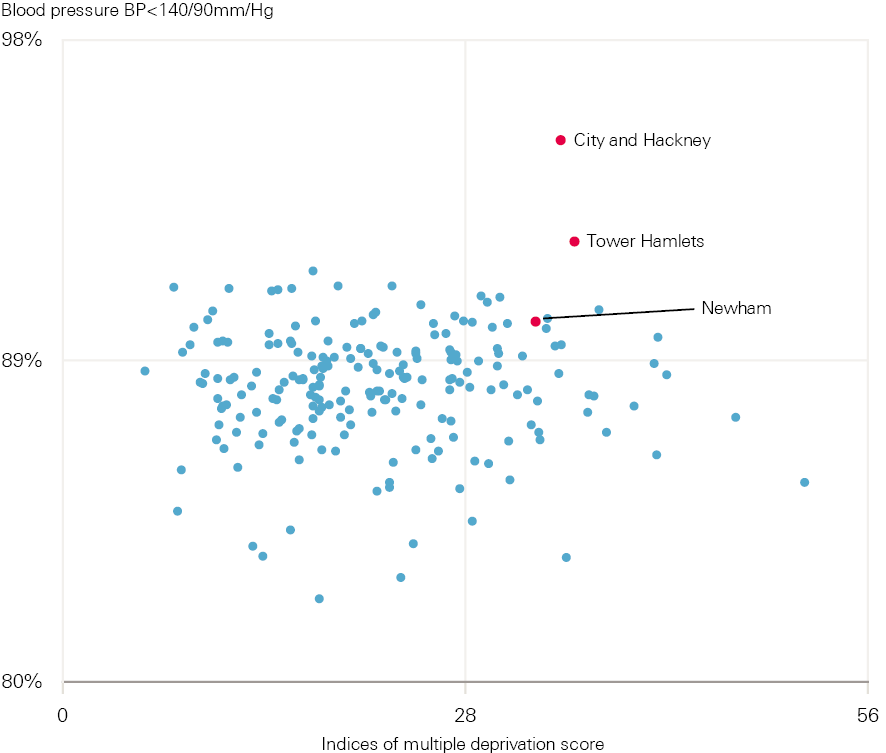
Each point represents a different CCG.
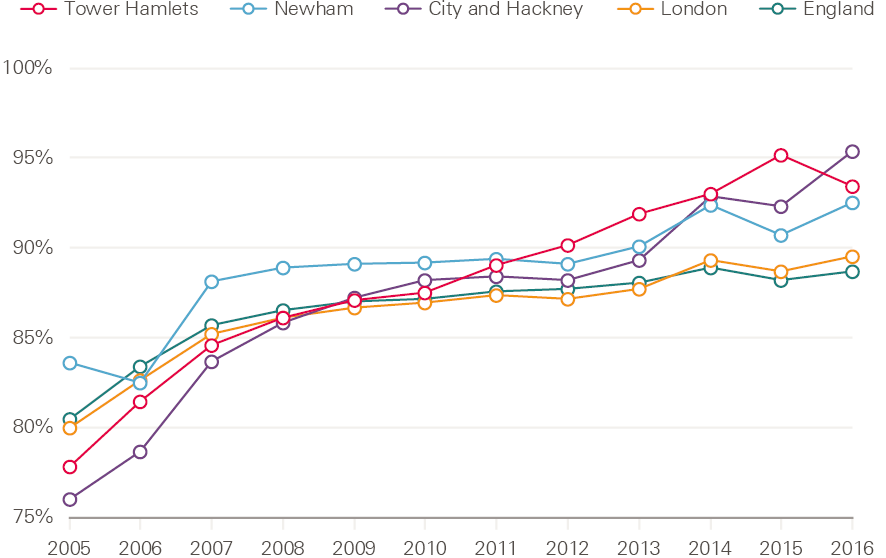
The example in Figure 4 shows a marked improvement in the percentage of diabetic patients achieving target blood pressures across the three CCGs (the CEG method was introduced in 2009). Overall performance in each of the CCGs was better in 2016 than the average performances in London and England. It also improved at a faster rate.
Figure 4: Percentage of diabetic patients achieving target blood pressures (as per NICE guidelines) in Tower Hamlets, City and Hackney, and Newham CCGs, 2005–16
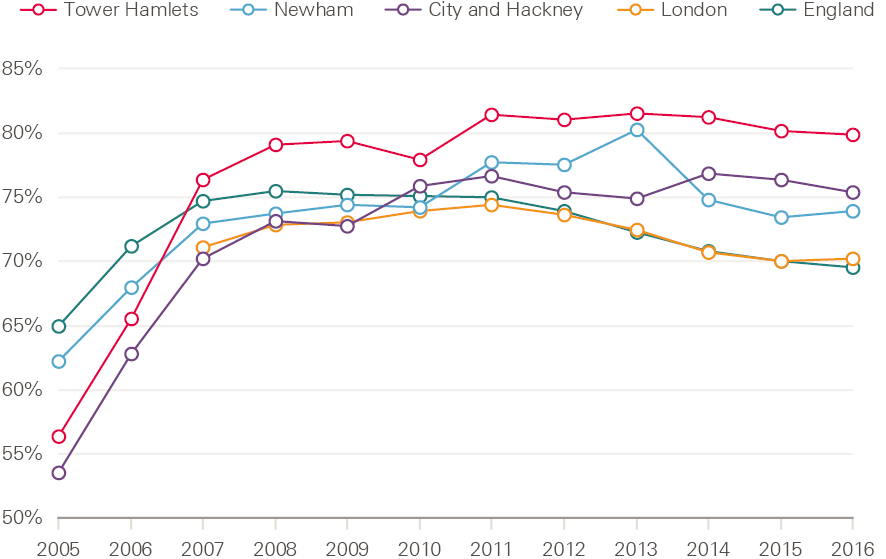
Figure 5 shows that the percentage of patients with chronic heart disease achieving target blood pressures improved at a faster rate across Tower Hamlets, City and Hackney, and Newham CCGs than the London and England averages. It also shows these areas had a higher overall rate in 2016 than the averages for London and England.
Figure 5: Percentage of patients with chronic heart disease achieving target blood pressures (as per NICE guidelines) in Tower Hamlets, City and Hackney, and Newham CCGs, 2005–16
Learning points
The CEG has developed a structured approach to quality improvement over time. Analysis and presentation of comparative data is central to the working of the CEG. This is coupled with recognition that the data has to be converted into meaningful information, then knowledge and action, to drive improvement. A systematic approach is taken (see Figure 2), and the CEG team view clinical engagement and the social aspects of change as core to the success of their approach.
Elements identified by interviewees as essential to the success of the approach are:
- the physical location of the CEG within the local health economy
- the credibility of the clinical leaders
- the relationships developed through the collaborative process.
CEG leaders also highlight the importance of choosing targets for improvement wisely, which they described as needing to be achievable, measurable, and aligned with local and financial incentives. The role of facilitators in implementation was also felt to be crucial. Facilitators are carefully recruited by the CEG, and often come from practice management or nursing backgrounds. Each facilitator is responsible for a geographical area and works closely with practices to help them use the CEG templates, comparative data and improvement tools to maximum effect. Facilitators take feedback from practices to the CEG, so that it too can continuously improve.
Case study 2: Modality
Background
Modality is a GP-led organisation operating across 35 practices in Birmingham, Sandwell, Walsall, Hull and Wokingham to deliver care to more than 300,000 patients. Formed in 2009 from the merger of two GP practices in Birmingham, Modality became the UK’s first GP super-partnership. In its role as a multi-specialty community provider, Modality was part of NHS England’s new care models programme. The organisation aims to ‘combine the advantages of small practices who understand their local communities with the medical and technological opportunities of a large-scale operation’.
Approach
Modality aims to improve performance and reduce variation across its practices through an approach centred on its clinical dashboard, which is run in Microsoft Excel. This is updated manually on a monthly basis by an analyst, who runs searches to pull in data from each practice on a variety of agreed metrics. The medical director chooses areas for improvement, with additional input from clinical colleagues. Selection is loosely based on what the Modality medical director described as ‘difficult to hit Quality and Outcome Framework (QOF) indicators’ (such as HbA1c control in diabetics), patient safety alerts and prescribing safety alerts, or locally identified areas of concern, such as pertussis vaccination (see Box 2).
Comparative data are presented by the medical director to a monthly clinical management group meeting. This group includes at least one GP partner from each Modality practice. The agenda at each meeting always includes a discussion on performance on quality metrics, an exchange of ideas and learning for improvement, and agreement on actions. Updated data are circulated each month so that progress is monitored and shared. There is no formal quality improvement training for participating GPs, and no internal financial incentives are offered for improved performance. The Modality team consider a professional desire to improve to be the main driver for change: showing people what they’re doing and asking them to reflect, rather than telling them what to do.
As Modality is a single organisation, data-sharing agreements are not required. This contrasts with the CEG and Enabling Quality Improvement in Practice (EQUIP – see case study 4), which require data-sharing agreements from all practices. Data from any Modality practice can be accessed centrally and analysed at an individual patient level for clinical care purposes. This work is carried out by a data analyst, with support from an information governance manager.
Impact
The Modality team feels that its data-driven approach to improvement has helped to produce a culture of self-reflection in the organisation. Box 2 highlights the results of one improvement effort.
Box 2: Improving pertussis vaccination rates
Pregnant women are advised to have a pertussis vaccination between 16 and 32 weeks of pregnancy to reduce the chances of their baby contracting whooping cough. The deaths of two local young babies from whooping cough led to a drive to increase the rates of vaccination in expectant mothers. The first step was to improve the quality of recording and coding of last menstrual period dates for pregnant women, to make sure Modality was accurately capturing everyone who was eligible. This was done manually by the Modality data analyst, who searched all relevant clinical records and created a set of bespoke EMIS searches.
An education campaign was then launched among practices and clinicians to increase awareness of the improvement effort: why it was needed and what they were being asked to do. A weekly search was run centrally across all Modality practices to identify eligible patients. Practices were then sent a list of patients to vaccinate.
Before starting the campaign, the vaccination rate across Modality practices was 63%. This rose to 73% following the introduction of the scheme. Most of those who were not vaccinated either declined or could not be contacted despite several attempts.
Learning points
The Modality approach is based on clinical leadership and engagement, the provision and analysis of data, and regular feedback to monitor improvement and enable course correction. The Modality team highlights the importance of locally respected clinical leaders, who are engaged with the improvement agenda and often hold positions of influence in other important local organisations. For example, one Modality director chairs a local CCG, while another is a CCG prescribing lead. Interviewees feel these individuals have significant credibility and leverage in their improvement work.
Directors offer ongoing feedback and advice to their practices, and the organisation considers regular clinical meetings and data sharing to be useful for engaging clinicians in improvement efforts. Modality’s leadership team believes that, when shown there is an opportunity for improvement, clinicians will be driven by professionalism to engage with it.
Modality’s approach is underpinned by the provision of analytical capability and high quality data. The super-partnership model means that Modality can run central searches without having to ask individual practices to send in data. It is also able to employ the necessary staff to do this efficiently – in this case a data analyst and information governance manager.
Case study 3: AT Medics
Background
AT Medics (ATM) is a GP-led provider of primary care services in London and Surrey. Established in 2004 by six GP ‘directors’, its clinical leadership has remained constant since then. ATM employs 180 GPs, who provide care for more than 200,000 patients over 37 sites. Each of the six directors takes responsibility for a group of practices in a geographical neighbourhood.
ATM takes over previously struggling practices, usually under alternative provider medical services (APMS) contracts, and works to stabilise them and support them to improve. It has a track record of innovation, including a document-handling system to reduce GP workload that was featured in an NHS England case study. It looks to improve and manage clinical care, and create a system that provides early warning signs of drops in quality of care.
Approach
In 2016, ATM started to present comparative data on a series of dashboards across the organisation. This approach emerged as the leadership sought a means to assure quality of care across practices as the scale of the organisation increased. A centrally managed approach to data collection was developed in response to the realisation that practices submitting their own data led to problems with data quality, timeliness and consistency, which limited the productive use of the data.
ATM formed a partnership with Surrey University and appointed a business intelligence manager. A team of clinicians and managers created a dashboard (using Microsoft Business Intelligence software) containing data on more than 500 indicators across all ATM practices. As ATM is a single organisation, information governance is relatively straightforward and data-sharing agreements between practices are not required. Although the dashboard was initially intended for assurance, it is now also used for improvement. The director responsible for quality chooses priorities for improvement, with input from clinicians and senior managers. These choices are based primarily on QOF requirements, patient safety and prescribing safety.
Searches are run from ATM’s head office, and there is no requirement for individual practices to send in data. Comparative data are presented on a dashboard, for which role-specific views are available – these present the most relevant information to each individual in a practice. Practices can compare their performance to other ATM practices and, where data are available, local and national averages. Indicators for financial performance are also included, such as income for locally enhanced services.
ATM’s approach to change is directive and led from a senior level. Practice managers attend monthly regional meetings with a director and the chief executive, providing them with an opportunity to discuss the dashboard and to share ideas for improvement. Directors work closely with practice managers and clinicians at individual practices to implement improvements. Senior managers interviewed for this briefing believe the comparative element of ATM’s approach drives competition between practices and that this is a significant enabler of change within the organisation: ‘they all want to be top – that’s a cultural thing.’
Impact
The ATM dashboard has been live since early summer 2016, so it is too early to assess the impact of ATM’s data-enabled approach to improvement at an organisational level. One specific example of the new approach, however, is the winter 2016/17 flu vaccine campaign. The prototype approach was tested and is now the approach for all of ATM’s public health targets (see Box 3).
Box 3: The flu vaccine campaign – ATM’s approach
The flu vaccine campaign is a yearly NHS-wide initiative run from September to January. The aim is to minimise avoidable illness by protecting vulnerable populations from influenza. GP practices are paid per dose administered.
ATM built a dashboard to monitor weekly practice performance on flu vaccinations against agreed targets. In 2016/17, data from each practice were extracted and compared against other practices and the overall ATM performance target. The chief executive sent a weekly email newsletter with tips to improve performance, while highlighting top performers.
A hybrid role was developed for receptionists, who received vaccination training, including Care Certificate training, so they could administer flu vaccinations. These staff subsequently delivered 34% of vaccines opportunistically, by offering to give patients the vaccine ‘there and then’, and administering it themselves. Underperforming practices were contacted to explore the reasons for their performance. An agreed plan was then made, and daily reporting introduced if required. With this approach, 20% more ATM patients received flu vaccinations than in the previous year.
Figure 6: Flu vaccination rates across ATM practices in London, 2015/16 and 2016/17
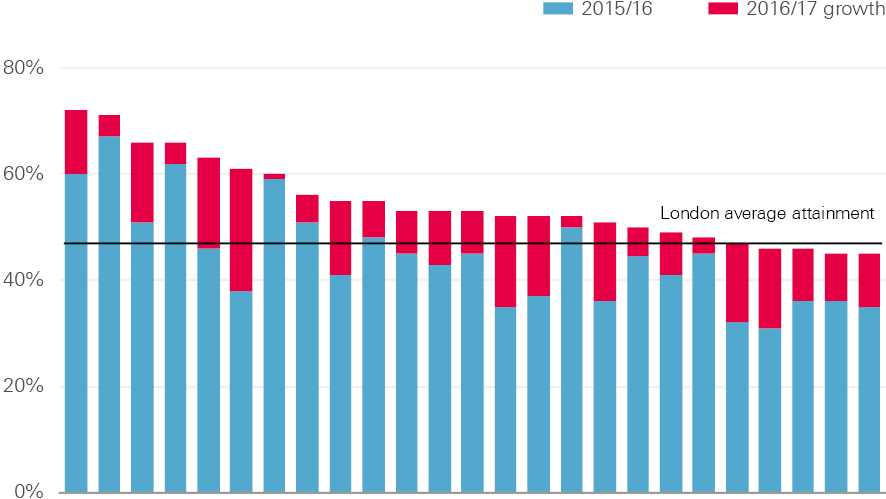
Note: Data relate to those aged under 65. Each bar represents an ATM practice.
Learning points
ATM has had the same six directors since its foundation in 2003. These directors believe this has helped them build trust in each other’s judgement, which has enabled rapid decision making with minimal bureaucracy. It has also provided a stable environment for improvement, including the ability within the organisation to test and implement ideas quickly. ATM has provided the technical capability to develop a dashboard by employing a business intelligence manager (who is able to program and do data analytics). It has also made the necessary financial investments to develop the approach.
Case study 4: Enabling Quality Improvement in Practice (EQUIP)
Background
EQUIP is a quality improvement programme that aims to enable all practice staff to make continuous and sustainable improvements to operational aspects of general practice. These include improvements to appointment availability, call handling efficiency and ‘do not attend’ rates. Established in Tower Hamlets in 2014, the 12 team members have a range of clinical and non-clinical backgrounds, as GPs, practice managers, data analysts and improvement coaches. Funding is received in part from Tower Hamlets CCG, and in part through competitively obtained grants (this includes an Innovating for Improvement grant from the Health Foundation awarded in 2017).
The organisation currently works with 26 practices across Tower Hamlets in London, many of which also work with the CEG (see case study 1). Although the organisations cover the same practices, their work is very different: the focus of the CEG is on clinical performance, while EQUIP focuses on operational performance. Despite this difference, the EQUIP team are clear that the work of the CEG has paved the way for them, in part through changing the culture around improvement in their locality.
Approach
EQUIP focuses on improving the operational aspects of primary care by using quality improvement methods to identify opportunities for improvement and to track the impact of change projects. Improvement coaches deliver weekly quality improvement coaching to practices and train practice teams to understand and lead quality improvement. The programme uses cross-practice collaboration to address challenging themes that many practices have in common, such as improving access.
The EQUIP approach is a 2-year programme containing six key delivery elements.
- Quality improvement training for almost 300 primary care staff. This is made up of:
- a 1-day introduction to quality improvement
- a 6-month action-learning course for team members leading the improvement work in their practice
- a 6-month improvement coach-training course to help build sustainable coaching capability and capacity for the longer term.
- One-to-one coaching, involving weekly or fortnightly problem solving with a dedicated quality improvement coach.
- Team and individual development, through which participating practice teams receive coaching, communication training and practice manager mentorship.
- Centralised comparative data – this allows practices to benchmark their performance and compare this with their local peers. The EQUIP team worked with a software company, Edenbridge, to create a dashboard, which includes standardised data-entry templates and automated searches. Practice staff receive training to make sure they have the skills to interpret the data they receive.
- Centralised resources for change – practices are encouraged to record their improvement plans in the Life QI platform, which is an online platform for quality improvement projects. This information is made available to all other EQUIP practices, so that baseline performance data and data on improvement are shared across practices. The central team also shares case studies with evidence of impact, and templates and tools for financial or workforce planning.
- Development collaboratives – these consist of a facilitator with a group of four to eight practices working on one theme. They work to find cross-practice solutions to common problems, and share best practice.
A core value of the project team is that this work should be driven and owned by local practices. A memorandum of understanding is agreed between the central team and practices at the start of their involvement in the project, laying out expectations. One of these is that the improvement work is done with and by the practices, not for them. Each practice chooses its own priorities for improvement.
To create an enabling culture, EQUIP has also found it important to eliminate hierarchy from the work. It works hard to make sure everyone is considered equal in the work – the programme team noted that sometimes in general practice authority is held more as a burden than a privilege.
Impact
The first cohort of 26 practices is engaged in the programme from April 2017 to April 2019. A pilot programme that ran with four practices reported encouraging results. One practice freed up 86 GP appointments per week by streamlining its processes, and another was able to allocate 16% of its GP appointments to other health professionals, creating extra GP capacity. Box 4 gives an example of EQUIP’s work to reduce ‘do not attend’ (DNA) rates.
Box 4: ‘Do not attend’
Appointments where the patient does not attend (DNA) are often a target for improvement when practices seek to increase capacity. One EQUIP practice analysed DNA data and found a GP DNA rate of 8% (representing more than 40 missed appointments a week). Closer analysis of this data showed that people who booked appointments online and people who booked within 48 hours of their appointment were more likely to show up.
This resulted in two interventions. First, the practice has made appointments available only 48 hours in advance, apart from for a group of exceptions decided by the practice team. Second, the practice has made all Saturday appointments bookable online only. As a result, the overall DNA rate reduced by 50%, which means GPs now see 20 extra patients each week.
Learning points
EQUIP team leaders believe that the following elements underpin the successes of the EQUIP model.
- Its multi-component nature – this incorporates team development with psychotherapist support, alongside technical and analytical support.
- The 2-year cycle of the programme – this is longer than most micro-level organisational change programmes.
- The coaching nature of the intervention – this simultaneously upskills staff.
- The data collection and tracking systems the team uses.
- All participating practices have volunteered to be involved – this increases engagement.
‡ For more information on these contracts see: www.bma.org.uk/advice/employment/gp-practices/service-provision/prescribing/the-gp-practice/nhs-contracts-for-primary-medical-services
§ For more information about the Innovating for Improvement programme see: www.health.org.uk/programmes/innovating-improvement
What we learned: ingredients for successful data-enabled, collaborative improvement in general pract
The case studies in this briefing represent very different approaches to data-driven improvement. In this section, we draw out some of the learning from these. Some important differences are underpinned by organisational structure (see Table 1), and these have implications for the practicalities of sharing data and the motivations for participating practices.
The case studies in this briefing represent a spectrum. At one end are the provider organisations (Modality and ATM), which face lower barriers in relation to data governance and the cooperation of constituent practices, yet also have to fund the data extraction and analysis themselves. At the other end are the CEG and EQUIP, which are working voluntarily with independent practices, with additional quality improvement support.
Table 1: Commonalities and differences across the case study organisations
|
CEG |
Modality |
ATM |
EQUIP |
|
|
Organisation type |
Academic unit |
GP provider |
GP provider |
Quality improvement group |
|
Information governance: data-sharing agreements |
Required |
Not required |
Not required |
Required |
|
Participation from practices |
Voluntary |
Mandatory |
Mandatory |
Voluntary |
|
Bespoke support |
Data analysts, practice facilitators |
Data analyst, information governance manager |
Business intelligence manager |
Data analyst, quality improvement coaches |
|
Mechanisms to enable improvement |
Individual practice support from facilitators |
Clinical meetings |
Clinical meetings |
Individual practice support from quality improvement coaches, shared Life QI platform |
|
Funding |
Research grants, CCG |
Self-funded |
Self-funded |
Research grants, CCG |
1. Getting the basics right: accessing and analysing data
Collating, analysing and sharing data are fundamental to the models studied in this briefing.
All of the case study groups can run searches on all participating practices from a central location, as opposed to each practice running a search and then sending in the data. This serves two positive functions: it improves data consistency, as the analyst can run the same search across all practices, and it saves time for practices, as they don’t have additional work to submit data.
If all practices within an improvement group are using the same electronic health records, then running searches is more straightforward. For example, the CEG encouraged all Tower Hamlets practices to use EMIS Web, which means a single search works across them all. Data-sharing approaches to improvement are not impossible if practices are using different electronic health records, but equivalent searches need to be created in each system.
Adequate information governance to protect patient data is essential to data-sharing approaches to quality improvement. Some organisational forms may hold advantages in this area. As non-provider organisations, the CEG and EQUIP require data-sharing agreements with all participating practices, and both noted relationship building had been a vital, if time-consuming, step in getting these agreements. Provider organisations, however, can access data from all practices in their organisation within the remit of direct patient care. Modality and ATM therefore do not require data-sharing agreements to be able to centrally analyse data from any of their constituent practices.
All of the case study organisations employ staff beyond the usual scope of the general practice workforce to support their improvement work. Data analysts devise, execute and interpret searches, while practice facilitators and quality improvement coaches support practices to make improvements. Several groups described challenges with recruiting to these roles. There is a known lack of analytical capacity in health care services in the UK, and some organisations trained people especially for roles. For example, the CEG developed its own analysts and practice facilitators, and EQUIP designed an on-the-job programme to train its quality improvement coaches. All of our case study groups met the cost of funding these posts themselves, though the source of their revenue varies. Modality and ATM generate their own income as GP providers, whereas the CEG and EQUIP receive income from competitive grants and from their local CCG.
All four organisations use dashboards to present data to practices, though they take different approaches to making data identifiable. At the start of its work, the CEG presented data back to practices so they could compare their performance against their local peers, but could only identify their own practice. This was important to begin with, although practices subsequently asked to become identifiable to each other so they could better share learning. ATM, EQUIP and the CEG’s dashboards all provide role-specific data, in order to present the most relevant data to individuals; for example, GPs see different information to practice managers. The aim is to avoid data oversaturation and to make the dashboards easier to engage with.
At ATM and Modality, monthly clinical meetings are used as a forum to discuss the quality dashboards, identify unwarranted variation and agree actions. Where possible these meetings include the same clinicians each month, so that continuity is maintained. Understanding when variation is warranted or unwarranted, even within relatively local areas, can be challenging, and these meetings act to build consensus among peers, and to share ideas to enable improvement.
The CEG employs practice facilitators, each of whom has responsibility for a small group of practices in the same geographical locality. Facilitators act as links between data analysts and practices, helping teams to interpret and act on their data. Facilitators are then able to take learning from teams back to the CEG to continue a cycle of learning and improvement. At EQUIP, quality improvement coaches work alongside practices to provide support. Practices share reflections on progress and lessons learned with other participating practices via an online platform, so that the whole network learns together.
2: Choosing areas for data-driven improvement
The breadth of targets for improvement in these case studies shows that data sharing can inform improvement across a range of clinical outcomes and processes. The sites have made careful choices about where to focus their efforts.
Both the CEG and EQUIP make sure that chosen improvement goals have the support of the clinical communities in which they will be applied. For the CEG, this involves engaging clinicians at local meetings to identify areas for improvement that will have the support of the local GP community. The EQUIP team facilitates a ‘data wall’ exercise: all staff at a practice come together with quality improvement coaches around a wall, on which their practice performance data is presented. They then collaborate to identify opportunities for improvement and agree which to prioritise.
All sites use incentive alignment as a tool to increase GP engagement. In England this often means choosing areas for improvement that will result in additional payment for practices, either from QOF or locally enhanced service specifications (services not deemed essential under most GP contracts and for which extra payment is made if provided). For GP providers, aligning improvement efforts with financial incentives may be particularly appealing, since they will directly benefit from improved outcomes. For non-provider organisations, incentive alignment may act as an effective tool to engage practices, as financial benefits may flow directly to individual practices.
Financial incentives complement professional motivations. Competition to do better can be seen as a motivator because it appeals to professional pride and the desire to do better for patients. At ATM, for example, creating a sense of competitiveness between practices is viewed as a desirable element of the organisational culture, whereas the CEG and EQUIP place more emphasis on collaborative approaches to learning.
The CEG and EQUIP both highlighted the importance of picking goals that are ambitious but achievable. For example, reducing teenage pregnancies is likely to be more complicated than improving adherence to existing blood pressure medication guidelines. The chosen areas of focus must also be evidence based and measurable – it can otherwise be challenging to directly attribute improvements in patient outcomes to improved care processes or adherence to clinical guidelines.
Conclusions
The prognosis for driving improvement in general practice through data sharing is positive, and there is good availability of high quality data. General practice adopted electronic health records early in comparison to most hospitals, and the data from these records can be searched relatively easily. As coding systems are replaced with a common system in England – which began being rolled out in phases from April 2018, – coding consistency should improve. Improving the quality of coding should increase the reliability of data for research and quality improvement.
There are an increasing number of academic- and government-led initiatives to make comparative data available. For example, the openprescribing.net website publishes anonymised data on drug prescribing by general practices. The RCGP and the Clinical Practice Research Datalink (CPRD) are also collaborating to provide practices with quality improvement reports that compare their performance against unidentified peers, in return for submission of data to the CPRD.
This process will be helped by moves towards larger networks in general practice in England. Closer collaboration between practices may create new opportunities for quality improvement through sharing data, but data sharing for improvement is new to many GPs and support will be needed.
In England, CCGs – with their local oversight and access to analytical support – are well placed to drive data-enabled improvement efforts, and some are experimenting with these approaches. However, CCGs’ responsibilities for performance management mean they are likely to need to make it clear to GPs that these efforts are explicitly designed to support improvement, rather than to manage performance. Practices may feel vulnerable if they perceive their performance to be judged, and the history of QOF and CCG performance management frameworks may make some GPs wary of sharing data.
A common theme identified by interviews for this briefing was the need for data to be used to create an environment for learning, and for practices to be supported to make changes. This reflects the findings of the Health Foundation’s previous work on indicators of quality of care in general practices in England. Studies show that even the best-intentioned measurement efforts can reduce engagement from staff, who may feel that such initiatives are designed to judge performance and attribute blame.
In Scotland, collaborative data-sharing approaches to quality improvement in general practice are being introduced nationally. The country’s new GP contract mandates the arrangement of practices in quality improvement clusters of between six and eight practices. These clusters provide a mechanism through which GPs can engage in peer-led quality improvement within and across practices. Healthcare Improvement Scotland has freed up time for GPs to engage with clusters, and each practice has a quality improvement lead. Public Health Intelligence Scotland is working with Healthcare Improvement Scotland to offer data support and analytical capabilities.
In England, the commitment of NHS England to allow a variety of GP organisations to develop makes a nationally driven approach less suitable. The case studies in this briefing show that a variety of governance approaches are possible, including leadership from academic groups and GP providers. The CEG and EQUIP are examples of external bodies that have effectively negotiated voluntary participation from practices, after significant efforts to build relationships with local communities. For provider organisations like Modality and ATM, stakeholder engagement is – on the surface at least – more straightforward, as they can use formal authority structures to secure the cooperation of the practices within their groups.
These case studies offer promising early indications that collaborative data-sharing approaches to improvement – in different configurations of general practice – have potential to make a meaningful contribution to improving quality of care.
References
- Royal College of General Practitioners. Quality Improvement. Available from: www.rcgp.org.uk/clinical-and-research/our-programmes/quality-improvement.aspx
- Royal College of General Practitioners. QI Ready. Available from: www.rcgp.org.uk/QI-Ready
- Royal College of General Practitioners. Quality improvement for General Practice: A guide for GPs and the whole practice team. Royal College of General Practitioners, 2015. Available from: www.rcgp.org.uk/clinical-and-research/our-programmes/quality-improvement/quality-improvement-guide-for-general-practice.aspx
- NHS Digital. Individual GP level data: data provision notice. Health and Social Care Information Centre, 2017. Available from: https://digital.nhs.uk/Individual-GP-level-data-Data-Provision-Notice
- Kumpunen S, Curry N, Farnworth M, Rosen R. Collaboration in general practice: Surveys of GP practice and clinical commissioning groups. Nuffield Trust and Royal College of General Practitioners, 2017. Available from: www.nuffieldtrust.org.uk/files/2017-10/collaboration-in-general-practice-2017-final.pdf
- Robson J, Hull S, Mathur R, Boomla K. Improving cardiovascular disease using managed networks in general practice: an observational study in inner London. Br J Gen Pract. 2014;64(622):e268-74. Available from: http://bjgp.org/content/64/622/e268.long
- Hull S, Chowdhury TA, Mathur R, Robson J. Improving outcomes for patients with type 2 diabetes using general practice networks: a quality improvement project in east London. BMJ Qual Saf. 2014 Feb;23(2):171-6. Available from: http://qualitysafety.bmj.com/content/23/2/171.long
- Hull S, Mathur R, Lloyd-Owen S, Round T, Robson J. Improving outcomes for people with COPD by developing networks of general practices: evaluation of a quality improvement project in east London. NPJ Prim Care Respir Med. 2014;24:14082. Available from: www.ncbi.nlm.nih.gov/pmc/articles/PMC4373497
- Cockman P, Dawson L, Mathur R, Hull S. Improving MMR vaccination rates: herd immunity is a realistic goal. BMJ. 2011;343:d5703. Available from: www.bmj.com/content/343/bmj.d5703
- Modality Partnership. About Us. Available from: https://modalitypartnership.nhs.uk/about-us
- Public Health England. Vaccination against pertussis (Whooping cough) for pregnant women –2016: Information for healthcare professionals. Available from: https://assets.publishing.service.gov.uk/government/uploads/system/uploads/attachment_data/file/529956/FV_JUNE_2016_PHE_pertussis_in_pregnancy_information_for_HP_.pdf
- NHS England. New ways to work in general practice: Workplace changes benefit all. Available from: http://atmedics.com/wp-content/uploads/2016/12/NHSEngland-ATMedics-innovations-case-study-160728.pdf
- East London NHS Foundation Trust. Life QI. Available from: https://qi.elft.nhs.uk/resource/qi-life
- Information Commissioner’s Office. Data sharing code of practice. 2011. Available from: https://ico.org.uk/media/for-organisations/documents/1068/data_sharing_code_of_practice.pdf
- Bardsley M. Understanding analytical capability in health care: Do we have more data than insight? The Health Foundation, 2016. Available from: www.health.org.uk/publication/understanding-analytical-capability-health-care
- Tai TW, Anandarajah S, Dhoul N, de Lusignan S. Variation in clinical coding lists in UK general practice: a barrier to consistent data entry? Informatics in Primary Care. 2007;15(3):143-150. Available from: http://europepmc.org/abstract/MED/18005561
- The Health Foundation. Scaling up a clinical effectiveness approach for Southwark to drive up quality and reduce unwarranted variation in general practice. Available from: www.health.org.uk/programmes/scaling-improvement/projects/scaling-clinical-effectiveness-approach-southwark-drive
- NHS Digital. SNOMED CT implementation in primary care. Available from: https://digital.nhs.uk/SNOMED-CT-implementation-in-primary-care
- Dixon J, Spencelayh E, Howells A, Mandel A, Gille F. Indicators of quality of care in general practices in England: An independent review for the Secretary of State for Health. The Health Foundation, 2015. Available from: www.health.org.uk/publication/indicators-quality-care-general-practices-england
- Armstrong N, Brewster L, Tarrant C, Dixon R, Willars J, Power M, Dixon-Woods M. 2018. Taking the heat or taking the temperature? A qualitative study of a large-scale exercise in seeking to measure for improvement, not blame. Soc Sci Med. 2018;198:157-164. Available from: www.ncbi.nlm.nih.gov/pubmed/29353103
- Scottish Government. The GP cluster. Improving together: A national framework for quality and GP clusters in Scotland. Available from: www.gov.scot/Publications/2017/01/7911/4
Acknowledgements
A number of people contributed to the development of this briefing and we are very grateful for their help. We would like to thank the case study sites, peer reviewers and Health Foundation colleagues for their time, comments and advice.
Errors and omissions remain the responsibility of the authors alone.