Acknowledgements
The authors are grateful for input and comment given by Jill Manthorpe and Katherine Checkland; Chris Hatton at the Department of Social Care and Social Work, Manchester Metropolitan University; Julien Forder at the Personal Social Services Research Unit (PSSRU); José-Luis Fernández at the Care Policy and Evaluation Centre (CPEC); John Craig and Jenny Shand from Care City; colleagues from the Department of Health and Social Care and ADASS; and the REAL Centre’s Oversight Board. Their input has informed development of our analytical approach, interpretation of results and the key implications identified.
We would like to thank the Health Economics Unit for their work analysing social care need in North West London and Mark Carter for his role in the ELSA analysis. In addition, the authors would like to thank REAL Centre and wider Health Foundation colleagues for their input, support and guidance, with particular thanks to: Hugh Alderwick, Lucinda Allen, Anita Charlesworth, Jennifer Dixon, Rebecca Fisher, Abigail Lampkin, Laurie Rachet-Jacquet, George Stevenson, Ruth Thorlby, Finlay Turner-Berry and Toby Watt.
We would also like to thank the Inclusion Panel for their time and the thoughtful discussion we had regarding this work. Their contributions about the role of different report formats particularly impacted this work. We would also like to especially thank the panel members who shared their own experiences of social care.
We would also like to thank members of the Health Foundation communications team, particularly: Kate Addison, Sean Agass, and Peter Stilwell.
Errors and omissions remain the responsibility of the authors alone.
When referencing this publication please use the following URL: https://doi.org/10.37829/HF-2021-RC16
Executive summary
England’s population is ageing. In the next 25 years, the number of people older than 85 will double to 2.6 million. In many ways this is something to celebrate. Older people make a valuable contribution to society and the economy, including through continued employment, informal care for grandchildren and other relatives, and volunteering. However, as people age the risk of developing illnesses and becoming frail increases, leading to greater need for health and social care. But does our ageing population mean an inevitable rise in demand and the costs of care? As this report explores, the reality is more subtle and complex.
The relationship between age, health and social care need is changing. Improvements in living standards and medicine mean people are often able to remain healthy and independent much later into life. There are more 70-year olds today than there were 20 years ago, but are they just as healthy and independent? Can any of the impacts of an ageing population be offset by a cohort of older people who ‘age’ less quickly and remain healthier than the generations before them?
This report explores this dynamic by analysing changes in two measures of need: an estimate of social care need, drawn from the English Longitudinal Study of Ageing (ELSA); and long-term conditions as a proxy for health and health care service demand, drawn from primary care records in the Clinical Practice Research Datalink (CPRD).
The REAL Centre aims to provide independent analysis that supports better long-term decision making. Understanding how the health and social care needs of the population are changing, in terms of the overall population numbers and prevalence by age, is crucial to understanding the future demand pressures facing the health and care system. Likely trends in demand influence future funding, patterns of service delivery and future workforce needs.
We summarise our conclusions according to three themes: how needs change as we age; how this relationship changed between 2006 and 2018; and how long-term conditions and social care needs interact.
How health and care needs change with age
Health and care needs rise with age, irrespective of whether measures are self-reported or recorded in administrative data, although they rise earlier in life for health than for social care need.
Limitations in the activities of daily living (ADLs) are a measure of whether someone needs support with certain daily activities – such as showering or eating. We use these as a proxy for social care need, while acknowledging that this is not a perfect measure. ADL limitations form part of local authority assessments of social care need. Those with two or more ADL limitations have high rates of social care use. In ELSA, which samples people older than 50 living in the community, the share of people who report ADL limitations rises gradually between ages 65 and 84, before increasing more rapidly after 85. Of those aged 65–69, only 13% report at least one ADL limitation. But this rises to 42% at age 85 and older. In contrast, long-term conditions are already common at age 65, with two-thirds of those aged 65–69 reporting at least one long-term condition. The proportion of people with conditions then increases more slowly with age.
The relationship between need and age has changed over time
The proportion of older people who need social care support at any given age has fallen over time. For those living in the community, the change was greatest for those in their 80s, with the share of those aged 80–84 with no ADL limitations rising from 68% in 2006 to 75% in 2018. This means a higher proportion of older people in the community are now able to live independent lives.
This fall has counterbalanced some of the increase in need driven by our ageing population. The REAL Centre estimates that in 2018, the number of people living in the community with two or more ADL limitations (and therefore high social care need) was 0.2 million lower and the number of people with no social care needs was 0.6 million higher than they would have been if age-related prevalence had remained at 2006 rates. There has been a similar pattern in data on residential social care, where the average age of people in care homes has increased and the overall number of people in care homes for older people has increased less quickly than the growth in the population older than 85 (who are mostly likely to use these homes).
But the share of people with two or more long-term conditions in age groups aged 75 and older increased and the share with no long-term conditions fell. For example, the share of those aged 80–84 with two or more conditions increased from 30% in 2006 to 38% in 2015. For the younger age groups, rates of long-term conditions remained largely unchanged.
This implies that older people are living with an increased number of long-term conditions, typically managed by the NHS, without on average needing more support with social care. However, the results also imply that those who do have social care needs may now also be managing an increased number of long-term conditions. This finding, however, does not tell us much about the types of social care that are needed and how this has changed. The type of care people receive, state-funded, privately funded, or unpaid care, is affected by factors beyond people's needs. For example, because social care is means tested, users of state-funded social care tend to be poorer, and they may not have experienced the same reductions in social care need as the population as a whole.
How social care need and long-term conditions interact
It is possible to have a long-term condition without having social care needs – a third of those with no ADL limitations have two or more long-term conditions. The reverse is less often true – when people have ADL limitations, particularly multiple ADL limitations, almost all also have a long-term condition.
This too is changing with time. The proportion of people with no social care needs but multiple long-term conditions rose between 2006 and 2018; in 2018 there were around 430,000 more people with multiple conditions but no problems with ADLs. Conversely, the number with high social care needs but no long-term conditions fell; in 2018 there were around 60,000 fewer people with high social care needs but no long-term conditions. This suggests an increased share of people are able to live independently with long-term conditions.
In this report we also look at which long-term conditions are most associated with ADL limitations. This does not necessarily mean the relationship is causal given, for example, age, socioeconomic deprivation and lifestyle risk factors can increase the likelihood of both independently. But it does give us a sense of the strongest associations. Neurological conditions – such as motor neurone disease, multiple sclerosis, Parkinson’s, dementia and stroke – are associated with higher levels of social care need, with up to 85% of people with these conditions also having a social care need. This is consistent with the impact that the advanced stages of these conditions can have on people’s ability to live independently. The number of people with dementia, the most prevalent of these conditions, has increased over time. But the prevalence by age has fallen.
Insights from our analysis
Policymakers need to be aware of the complexities involved in predicting future demand for health and social care based on demographic changes. Our analysis leads us to outline five insights for policymakers and system leaders.
- An ageing society does not inexorably lead to comparable increases in the number of people with social care needs. This is because the rate at which people develop social care needs by age can change. On average, older people now have fewer social care needs than people of the same age 15 years ago. This has meant that despite the rise in the number of older people, the number of older people with high social care need has increased only slightly. Future need is therefore going to depend on the outcome of this ‘race’ between numbers and prevalence.
- But people with the highest needs have seen their needs become increasingly complex – an individual with a social care need typically also has several long-term conditions. Neurological conditions are associated with the highest levels of social care need. By far the most prevalent of these conditions is dementia. Local and national policymakers should therefore be alert to trends not only in the numbers of people with social care needs, but also the mix of people needing care.
- Unlike social care need, the likelihood of having two or more long-term conditions has increased for those aged 75 and older. But the extent to which this trend is ‘real’ and associated with actual changes to underlying health and wellbeing remains unclear. For example, the increase could be primarily driven by changes in diagnostic practices, such as the emphasis on diagnosing dementia earlier. Further research in this area would be valuable.
- These are national trends but the patterns and trends are likely to vary for different population groups and in different areas of the country. To ensure that people receive coordinated services that meet their needs, integrated care systems will need a sophisticated understanding of need in their populations, based on evidence and analysis of joined-up datasets.
- The number of older people, and in particular those living to advanced ages (85 and older), is expected to rise substantially in the next 20 years. To be able to plan future service delivery effectively, national and local policymakers will need to understand how these changes in population structure will impact overall demand. This would be aided by projections of need that are informed by the latest, best available data and evidence.
* The number of people with two or more ADL limitations still increased by 90,000 between 2006 and 2018.
Introduction
As with most other advanced economies, England’s population is ageing. Over the past 20 years the proportion of the population aged older than 65 has risen from 16% to 18%, with almost 50% (or 440,000) more people older than 85. This trend is expected to continue. Over the next 25 years, the number of people older than 85 is projected to nearly double from around 1.3 million to 2.6 million.
The fact that we are living longer is something to be celebrated. Increased life expectancy means we have more time to spend with friends and family and to enjoy life. Older people make a valuable contribution to society, including through continued employment, informal care for grandchildren and other relatives, and volunteering. However, as people get older they also face an increased risk of developing health conditions and becoming frail. This may lead to an increased need for health and social care support – a contribution we explored in the 2020 REAL Centre publication, The bigger picture.
The rate at which we develop additional health and care needs as we age is important for two reasons. First, these needs can affect our quality of life, and so the longer they can be delayed the better for individuals. Second, the rate at which we develop health and care needs by age, influences how an ageing population will affect demand for health and social care, and therefore costs. Our report Health and social care funding projections 2021 considered the funding pressures generated both from an ageing population and rising chronic conditions. If the prevalence of health and care needs for each age group were to fall over time (for example, if 65 year olds have fewer needs in 10 years’ time than 65 year olds today), this could counterbalance funding pressures driven by an increase in the number of people living into older age. By contrast, if each cohort were developing more needs, this would add to the funding pressures from a changing size and age structure of the older population.
About this report
This report focuses on two of the ways in which ageing can affect our lives that are closely linked with our need for support from the health and social care systems: limitations on activities of daily living (ADLs), such as showering and eating, and diagnosed long-term conditions, such as dementia, diabetes and coronary heart disease. We focus on the population aged 65 and older, as this is when measures of this type begin to rise most steeply with age.
ADL limitations approximate social care need, at least in terms of how it is currently measured by the system. For the purpose of this report, we will use the terms ADL limitations and social care need interchangeably, while acknowledging that, more broadly, ADL limitations are an incomplete proxy for social care need. Long-term conditions are diagnosed by the health service, and result in demand for both primary and acute NHS services. The aim is to highlight the complex relationship between ageing and health and care need, and to explore how the relationship between ageing and need can change over time and what this means for total population-level need. We then provide insights for policymakers planning for the health and social care need of the future.
In chapter 2 we document the relationship between age and our two measures of need: ADL limitations or social care need and long-term conditions. In chapter 3, we explore how the relationships between age and our need measures have changed over time, and how these changes have influenced total population need. Finally, in chapter 4, we explore the relationship between ADL limitations and long-term conditions, including how this has changed over time.
We have two main sources of data. The first is the English Longitudinal Study of Ageing (ELSA) – a cohort study of people aged 50 and older in England. These data include self-reported ADL limitations and long-term conditions up to 2018. The sample is drawn from the population living in the community and therefore does not capture people with social care needs living in residential care. We do however supplement our ELSA analysis with information on the size of the residential population using data from LiangBuisson. The second is primary care administrative data from the Clinical Practice Research Datalink (CPRD), which provides information about diagnosed long-term conditions up to 2015.
Measuring long-term conditions and adult social care need
Key points
- In this report we use two main data sources: the English Longitudinal Study of Ageing (ELSA), and Clinical Practice Research Datalink (CPRD) primary care data. ELSA is a survey of people aged 50 and older living in the community, run every 2 years, and gives us data on both social care use and health. CPRD consists of GP patient records from a sample of GP practices in England, and gives us data on health including diagnosed medical conditions, prescriptions and tests.
- All measures of need increase with age, whether self-reported or recorded in administrative records.
- ADL limitations increase slowly for people until age 85, before rising more rapidly thereafter. At ages 65–69 around 13% report needing some help with at least one ADL, meaning nearly 90% report not needing any support. By age 85 and older, this has increased to 42% needing help with at least one ADL and 58% reporting no need for support.
- The proportion of people who report having a long-term condition also rises with age. The increase with age is more gradual than the increase in need for social care support but the proportion of people reporting one or more long-term conditions is much higher at all ages.
- At ages 65–69 almost a third of people (31%) self-report having one long-term condition, and around a third have two or more long-term conditions (34%). By age 85 this has risen to a third and over half (33% and 53%). This means only 14% of this age group report having no long-term conditions.
- The prevalence of long-term conditions in primary care records is lower for every age group than the self-reported prevalence in ELSA. At ages 65–69, less than half of people (42%) have at least one recorded long-term condition in CPRD, while nearly two-thirds (65%) report having at least one long-term condition in ELSA.
This chapter introduces our two data sources, and summarises what these tell us about current patterns of social care use and health by age. Both sources have some limitations, which are discussed further in Appendix 2.
The English Longitudinal Study of Ageing (ELSA)
ELSA is a panel study of people aged 50 and older living in England. ELSA began in 2002 with a sample of around 12,000 people, and is periodically refreshed with new members to ensure the sample is representative as respondents age. The survey includes only people living in the community – not those who live in residential care. Respondents are re-surveyed every 2 years.
The survey collects measures of most aspects of life, including objective and subjective measures of physical and mental health, wellbeing, social networks, finances and employment. For the purposes of this report, we focus on two measures of health and care need: ADLs and self-reported long-term conditions. As we have information on both for the same respondents, it is possible to examine how the two measures overlap, which we look at in chapter 4.
Activities of daily living and social care need
ELSA includes the metric activities of daily living (ADLs). The six ADLs are: eating and cutting up food; dressing, including putting on shoes and socks; walking across a room; getting in and out of bed; washing or showering and using the toilet.
Our analysis focuses on ADL limitations as a proxy for social care need in the community. ADL limitations also form a part of local authority assessments of need. We analyse the share of people who have zero, one and two or more ADL limitations, first by age and then over time. We define people with ‘high levels of need’ as those requiring support with two or more ADLs.
Although ADLs are not a perfect measure of social care need, ELSA data show that there is a lot of overlap between ADL limitations and social care use. In 2018, two-thirds (67%) of people aged 65 and older with two or more ADLs reported receiving social care (paid or unpaid). Most of the older population receiving care is made up of people with high social care need. Among those who reported receiving some form of paid or unpaid care, nearly three-quarters (74%) had two or more ADL limitations.
The main limitation of using ADLs to capture need is that the measure does not account for the frequency or levels of support. In this report we can therefore only assess changes in the number or share of people who need care by age or over time, rather than the intensity of care required. This limitation is discussed further in Appendix 2. However, more detailed measures of levels of dependency – which do account for level of need – are not available in ELSA.
Long-term conditions in ELSA
Long-term conditions are conditions that cannot be cured and need ongoing management through treatment or medication. These conditions are a major driver of activity in both primary and secondary care. The approach used to group and analyse long-term conditions in ELSA is described in Appendix 1. In ELSA data, information on panel members’ long-term conditions are based on their self-reported conditions. Self-reported measures can be subject to error as they rely on an individual remembering all the long-term conditions they have, or the individual having knowledge of their condition(s). Conversely, the measure is likely to capture those long-term conditions that result in frequent interactions with the NHS and have the biggest impact on quality of life.
Clinical Practice Research Datalink (CPRD) primary care data
CPRD data are administrative records of anonymised patient data from a network of GP practices across the UK. These data include all the interactions patients have with their GP practice, including consultations, referrals and diagnoses. The data are provided by patients and collected by the NHS as part of their care and support. Scientific approval for this study was given by the CPRD Independent Scientific Advisory Committee (ISAC). The study was approved by the Independent Scientific Advisory Committee for CPRD research (19_220). Data permissions mean that we have access to data from a sample of 3 million patients from 2000 to 2015.
Long-term conditions in CPRD
We use these CPRD data to calculate the rates of long-term conditions diagnosed and recorded by GPs. These data enrich our analysis in two ways. First, the larger sample size means that we can gain a more precise estimate of patterns of long-term conditions than in ELSA. This is particularly the case for the 85 and older age group, where the sample in ELSA becomes quite small. Second, primary care administrative records do not have the same problems associated with recollection errors in self-reporting long-term conditions, nor are they restricted to older people living in the community. As with all measures, however, there are limitations and caveats. The most important of these is that diagnosed conditions are subject to changes in diagnostic practices as well as underlying health. If clinical definitions change (‘diagnosis creep’), or diagnostic tools become more sensitive, the prevalence of long-term conditions could rise even with no change in underlying population health.
The limitations of different methods of capturing long-term conditions is discussed in more detail in Appendix 2.
Results
Both ADL limitations and long-term conditions increase with age
Figure 1 shows the proportion of people reporting the need for social care support, measured by those needing help with one or two or more ADLs, increases gradually with age between 65 and 84. There are then bigger increases after the age of 85.
Figure 1: The percentage of people older than 65 who self-report needing help with activities of daily living (ADLs) by age group, 2018
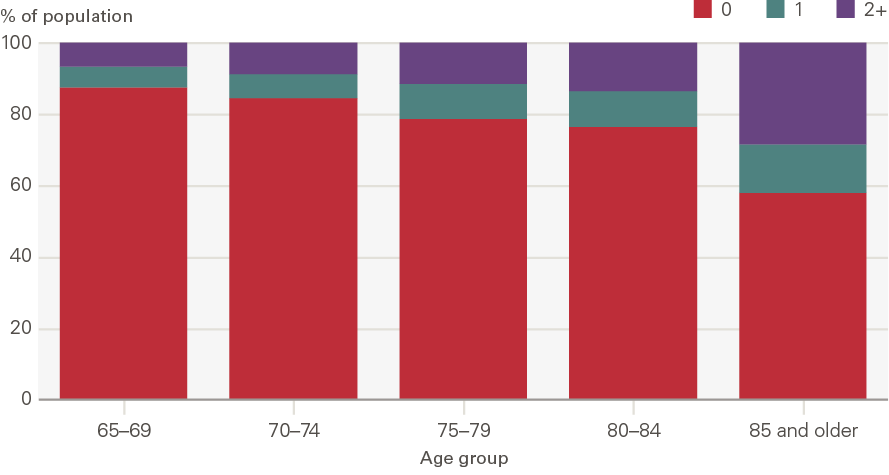
Source: ELSA, 2018.
At ages 65–69 around 13% report needing some help with at least one ADL (6% with one ADL and 7% with two or more ADLs) – meaning around 87% report having no need for help. By age 85 and older, this has increased to 42% needing help with at least one ADL (14% needing help with one ADL and 28% needing help with two or more ADLs), and 58% reporting no need for help.
Figure 2 shows that the proportion of people that report having a long-term condition also rises with age. This increase with age is more gradual than the increase in need for social care support (Figure 1), however, the proportions reporting one or more long-term conditions are much higher.
Figure 2: The percentage of people older than 65 self-reporting long-term conditions by age group, 2018
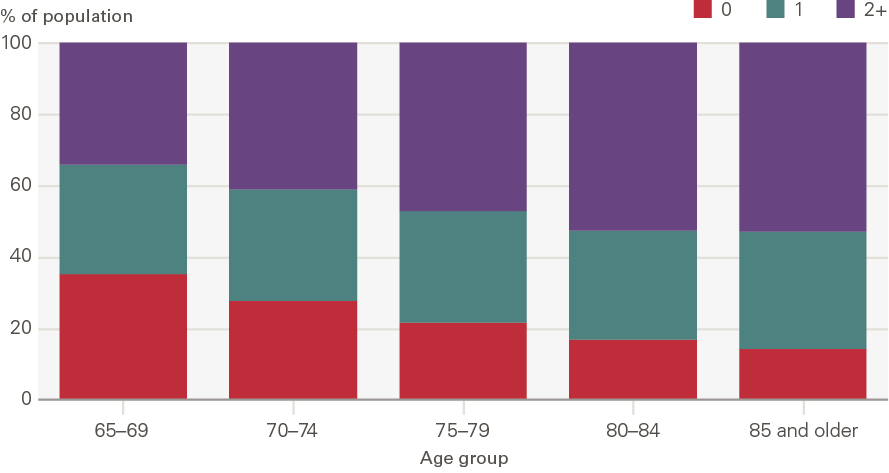
Source: ELSA, 2018.
At ages 65–69 around 31% report having one long-term condition and 34% two or more long-term conditions. By age 85 and older this has risen to 33% and 53%, meaning only 14% of people report having no long-term condition.
Figure 3 shows the proportion of people with long-term conditions recorded in primary care records by 5-year age band in 2015. As in Figure 2, the prevalence of long-term conditions increases with age. The percentage with two or more long-term conditions increases from 16% for the 65–69 age group to 42% for the 85 and older age group. However, at each age band the number of long-term conditions is higher in the self-reported data in ELSA than in the GP records in CPRD. At ages 65–69, less than half of people (42%) have at least one recorded long-term condition in CPRD, while nearly two-thirds (65%) report having at least one long-term condition in ELSA.
Figure 3: The prevalence of diagnosed long-term conditions among people older than 65 by age group, 2015
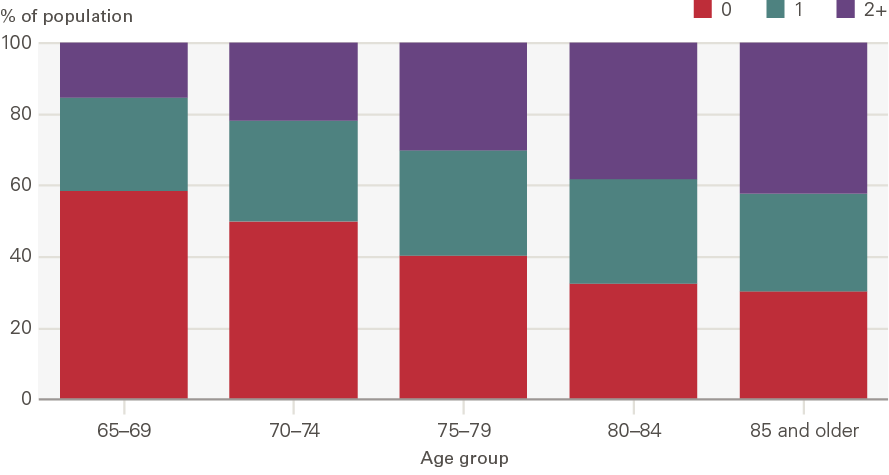
Source: CPRD, 2015.
Taken together, Figures 1 to 3 demonstrate that all measures of health decline at older ages. However, the relationship between age and health and care need will depend on the metric used. When comparing ADL limitations and long-term conditions, this in part reflects differences in how needs develop. More people enter retirement with long-term conditions than ADL limitations, which means that health needs are much greater than care needs for those in their late 60s and early 70s. ADL limitations and therefore social care need develops at older ages.
Comparing Figures 2 and 3 shows that even when we consider a single measure of health, in this case long-term conditions, how the information is captured can affect our conclusions about the precise relationship between ageing and measured health. Which measure is preferred will depend on the question being addressed.
How have social care needs and long-term conditions changed over time?
Key points
- This chapter considers how the relationship between age and the rate of social care need and long-term conditions shown in chapter 2 has changed over time.
- Between 2006 and 2018, there was a fall in the share of people with social care needs in each age group. The change was greatest for those aged 80 and older, meaning a higher share of people are now able to live independent lives.
- By contrast, the share of people 75 and older with two or more long-term conditions (according to primary care records) increased and the share of those with no recorded long-term conditions fell. For those younger than 75, rates of long-term conditions remained largely unchanged.
- The reduction in the rate of social care need by age has counteracted some of the increase in the total number of people with need which is the result of an ageing population. We estimate that the number of people with two or more social care needs is 0.2 million lower, and the number of people with no social care needs 0.6 million higher in 2018 than they would have been if age-related prevalence had remained at 2006 rates.
- The change in the rate of long-term conditions by age exacerbated the increases in the total number of people with long-term conditions because of a rise in the number of older people. The estimated number of people with two or more diagnosed long-term conditions was 0.4 million higher, and the number of people with no diagnosed conditions 0.4 million lower, than if prevalence by age had remained at 2006 rates.
- The total number of people living in residential settings, those with the highest social care needs, grew 9% between 2007 and 2019, while the population aged 85 and older grew by a quarter. This suggests that a smaller fraction of this age group now uses residential care and is consistent with a lower fraction – but a higher total number of people in their 80s and 90s – having social care needs. The number of people in residential care will also be affected by factors other than need, including local authority policies and funding and the availability of unpaid care provided by family.
This chapter considers how social care need, as measured by ADL limitations, and long-term conditions have changed over the past 15 years. We begin with an individual perspective, looking at how the chances of having a social care or health care need have changed over this period. We then consider what this means at the population level, estimating the total number of people who need care, and how this has changed.
We focus on two ways of measuring how ageing might affect an individual’s life. The first looks at social care need, measured by no ADL limitations (‘no need’) and two or more ADL limitations (‘high social care need’) from ELSA. The second is long-term conditions, as diagnosed and reported in primary care CPRD data, measured by zero long-term conditions and two or more long-term conditions. We use CPRD administrative data rather than self-reported long-term conditions from ELSA to allow for larger sample sizes, and because this measure is likely to have more direct implications for NHS service use. We do not focus on one ADL limitation or one long-term condition, as trends are typically less clear or informative. All trends have been age-sex standardised using the 2018 population as the reference. This means for every year for our measures, we take the proportion by 5-year age bands and sex, and apply it to the corresponding population for that age band and sex in 2018. This means that we adjust for changes in population structure over time.
The rate of social care needs within age groups has fallen over time
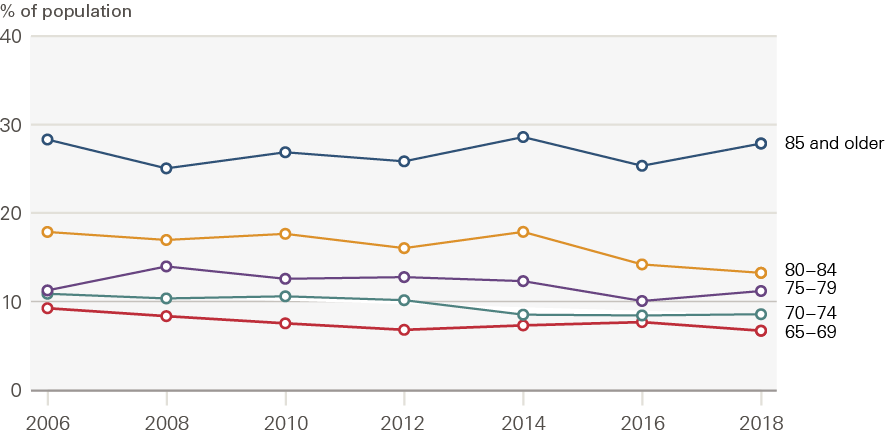
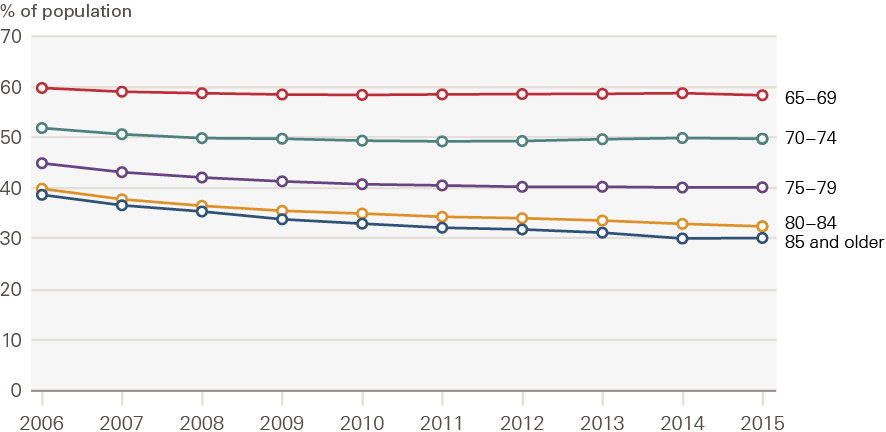
Figures 4 and 5 show the share of ELSA respondents who have no ADL limitations and two or more ADL limitations in each of the biennial surveys between 2006 and 2018. Figure 4 shows that the share of the population with no ADL limitations is increasing in all age groups and that the share of people with any ADLs is declining. The trends are not very smooth due to the relatively small sample size. Changes are particularly large for those aged 80 and older; the share of those aged 80–84 with no ADL limitations rose from 68% in 2006 to 75% in 2018, while the same share for those aged 85 rose from 51% to 57%.
Figure 5 shows that the share of those with two or more ADL limitations is trending downwards for those younger than 85. There is no real trend for those aged 85 and older.
Both these figures only represent people who are living in the community – they exclude those living in residential care homes. They will therefore overestimate the true population prevalence of ‘no need’ (as people in care homes will have social care needs), and underestimate the true prevalence of need. The final section of this chapter documents trends in the residential care home population to provide a more complete picture of how need across the older population as a whole has changed.
Figure 4: The percentage of the older population with no ADL limitations (no social care need) by age group, 2006–2018
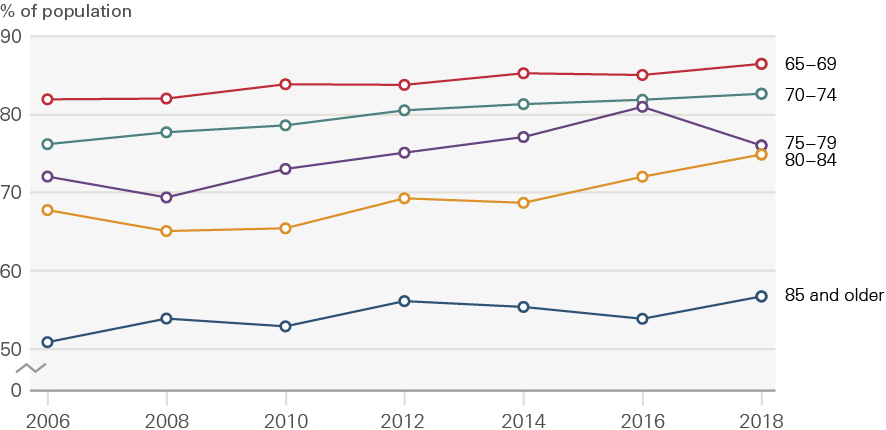
Source: ELSA, 2006–2018.
Figure 5: The percentage of the older population needing help with two or more ADL limitations (high social care need) by age group, 2006–2018
Source: ELSA, 2006–2018.
Rates of long-term conditions are increasing for those 75 and older
Figures 6 and 7 show how the shares of people with no long-term conditions and two or more long-term conditions have changed between 2006 and 2015, by age group.
For the 65–69 and 70–74 age groups, there was an increase in the rate of diagnosed conditions between 2006 and 2008. The share of people with no long-term conditions fell, and there was an increase in the share of people with two or more long-term conditions. After 2008 (our ELSA data runs 2006–2018), these trends halted, and there was very little change in the rate of diagnosed conditions among these age groups. For those aged 75–79, rates of long-term conditions increased up until 2010, but remained stable thereafter.
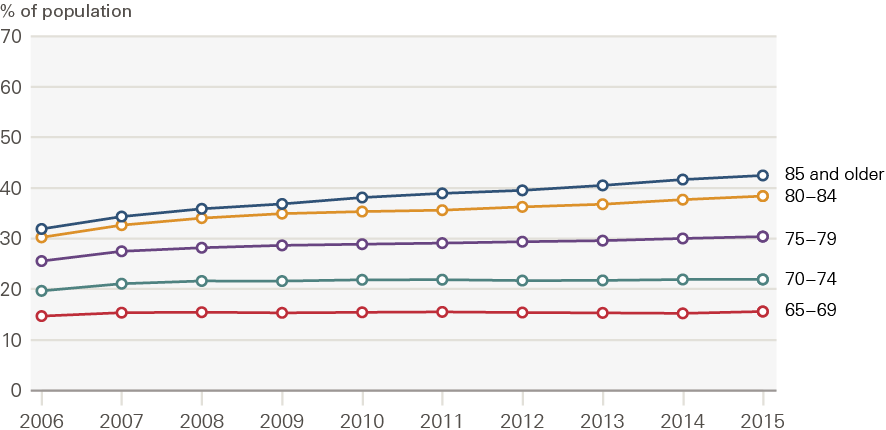
For the 80–84 and 85+ age groups, the rates of diagnosed long-term conditions increased at a faster rate than for younger cohorts, and continued for the whole period between 2006 and 2015. For those aged 80–84, the proportion of people with no long-term conditions fell from 40% to 32%. For those aged 85+, this share fell from 39% to 31%.
The increases in long-term conditions for those older than 80 could be due to real changes in the underlying prevalence of disease, or changes in the frequency of diagnosis (for example due to changes in diagnostic guidance or an improvement in diagnostic tools). What is clear is that the increase in diagnosed long-term conditions for those aged 80 and older occurs at the same time as a reduction in social care need.
Figure 6: Percentage of the older population with no diagnosed long-term conditions by age group, 2006–2015
Source: CPRD, 2006–2015.
Figure 7: Percentage of the older population with two or more diagnosed long-term conditions by age group, 2006–2015
Source: CPRD, 2006–2015.
What do the changing rates by age mean for the population?
The number of older people with a social care need is defined by two things: the prevalence of need in the population (ie how common it is), and the size of the population. As populations age, the number of older people will increase and – unless there are reductions in the prevalence of need – so too will the number of people with social care needs. In this section we disaggregate these two factors.
To do this, we start by estimating what the total number of people with needs would have been if prevalence of need by age had not changed. We estimate this by fixing our rates of need by age at their 2006 values and applying actual population numbers in each age group over time. We then compare these projected totals with estimated needs using the actual rates of need by age, which change over time, and the actual population numbers.
Figure 8 shows the results of these estimates and projections for those with no ADL limitations and no long-term conditions. In both cases, the estimated number of people with needs increases over time. However, the fall in ADL limitations over time, shown in Figure 8, means that the projected population living without ADLs, based on the 2006 rate and shown by the dotted line, is below the actual estimate shown by the solid line. In other words, there are more people living without social care need than we would have expected based on the change in the size and age structure of the population alone. For long-term conditions, the opposite is true: there are fewer people living without long-term conditions than we would have expected purely from demographic changes. This is because the rates of diagnosed long-term conditions within each age group have risen.
Figure 9 presents the same analysis for the population with two or more ADL limitations and two or more long-term conditions. The number of people with two or more ADL limitations has increased slightly over time, but is lower than we might have expected based on population growth alone. Conversely, the number of people with two or more long-term conditions is higher than we might have expected.
Table 1 summarises the change in the estimated number of people with no needs and high needs between 2006 and 2018 for ADL limitations, and 2006 and 2015 for long-term conditions. It also shows the relative contributions of demographic change (the size and age structure of the population) and the change in the rate of need by age.
For low need, the demographic changes increase both the number with no long-term conditions and those with no ADL limitations. In the case of ADL limitations, the change in the rate of ADL limitations by age acts to further increase the population with no needs. By contrast, demographic changes alone (with the 2006 prevalence rates) would have led to a 0.9 million increase in the number of people living with no conditions between 2006 and 2015. Instead, due to an increased rate of diagnosed long-term conditions, the actual increase in those living with no conditions was 0.5 million.
Turning to those with two or more ADL limitations or two or more long-term conditions, we would have expected to see a growth of 0.3 million in the number of people with two or more ADL limitations between 2006 and 2018. Instead, the reduced rate of social care need has led to an actual growth of 0.1 million (0.2 million lower than expected). Conversely, we would have expected the number of people with multiple long-term conditions to have increased by 0.3 million between 2006 and 2018 had rates of diagnosed conditions by age remained at 2006 levels. Instead, the actual growth was 0.8 million (0.5 million higher than expected) as a result of the increased prevalence of individuals with two or more long-term conditions.
Figure 8: Estimated population living without ADL limitations and long-term conditions, 2006–2018
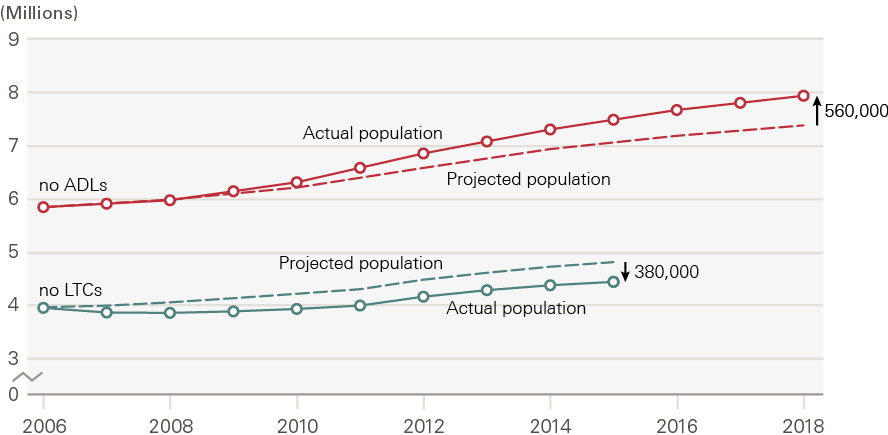
Source: ELSA and CPRD, 2006–2018.
Figure 9: Estimated population living with multiple ADL limitations and long-term conditions, 2006–2018
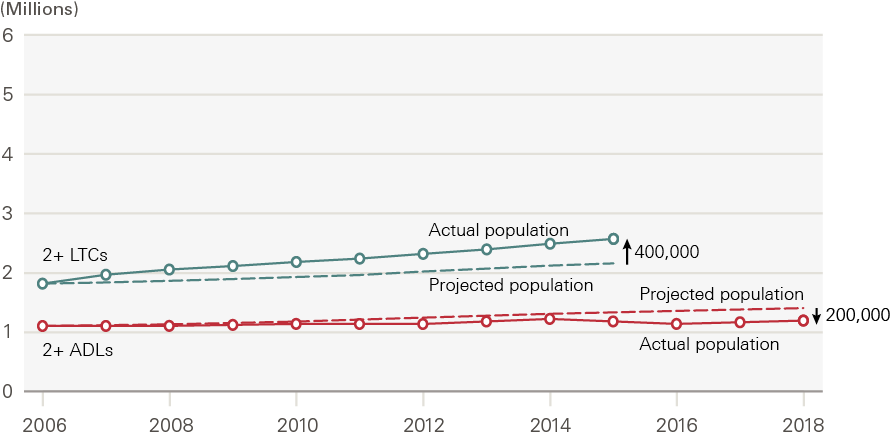
Source: ELSA and CPRD, 2006–2018.
Table 1: Changes in the total number of people with ADL limitations and diagnosed long-term conditions between 2006 and 2018: the contributions of demographic change and changes in rates of prevalence by age (millions)
|
0 ADL limitations |
0 long-term conditions |
2+ ADL limitations |
2+ long-term conditions |
|
|
2006 estimate |
5.8 |
4.0 |
1.1 |
1.8 |
|
Change in population size and age structure |
+ 1.5 |
+0.9 |
+0.3 |
+ 0.3 |
|
Change in prevalence by age |
+ 0.6 |
-0.4 |
-0.2 |
+0.4 |
|
Final year estimate (2018 ADL/2015 long-term condition) |
7.9 |
4.4 |
1.2 |
2.6 |
Note: Figures may not add up as a result of rounding. ADL limitations estimated using ELSA. Long-term conditions based on diagnosed long-term conditions in CPRD. Estimates given by applying prevalence to ONS population estimates.
The residential care home population
ELSA is representative of older people living in the community, but not those living in residential homes. The decline in ADL limitations in ELSA for the oldest in our population may therefore not reflect what is happening for the overall population – if the threshold for who is admitted to a residential home has changed. We therefore assess how the ELSA results match up with the residential home population.
Figure 10 shows that the total number of people in residential settings in the UK (both state and self-funded) has risen by around 9% between 2007 and 2019. At the same time, the number of people aged 65 and older, and number of people aged 85 and older, has risen by around a quarter. This indicates that a smaller proportion of older people are living in residential settings. We also know that recent data on social care need in residential settings shows increased levels of severe disability, as well as rising average age., The median age in care homes rose from around 84 to 88 between 1992 and 2012.
This pattern of care home use appears consistent with our ELSA results. The share of people with social care needs in each age group is falling over time, but the total number of people with needs is increasing due to the rise in the number of people living to advanced ages. There are likely to be other contributing factors to the care home occupancy rate, including preferences of care recipients and supply side constraints (such as limited capacity). However, if this were the dominant factor, we would expect to see an increase in the prevalence of ADL limitations in ELSA, which is not the case. The patterns we observe for care homes and ADL limitations are also consistent with trends in dementia, where rates for a given age group have declined but the total number with dementia has risen.
Figure 10: Number of older people in residential settings in the UK by source of funding, 2007–2019
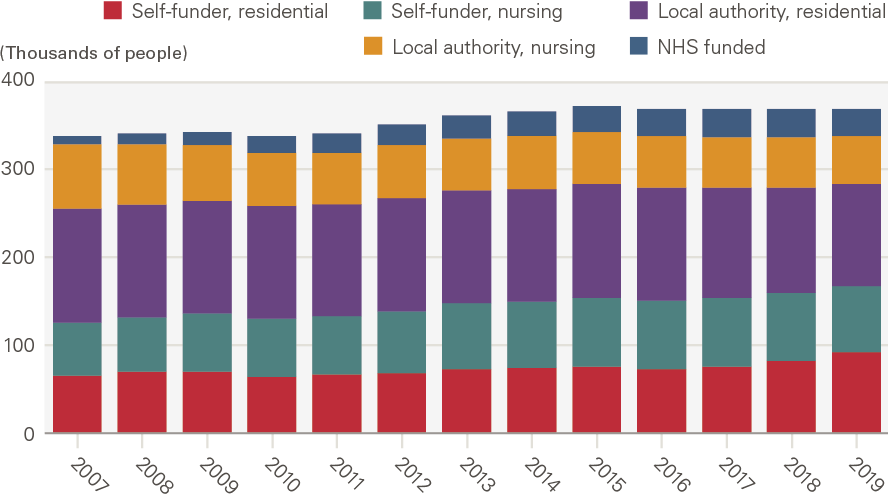
Source: LaingBuisson. Care homes for older people, 30th edition.
Overall, this chapter’s findings suggest that the number of older people needing social care has not risen as quickly as the population of older people. However, this relates to what people report as their social care needs, which is not the same as the care they receive, nor where they get this care from. Demand for different types of care – state-funded, privately funded, or unpaid care – will have grown at different rates, as each is affected by different factors. For example, because social care is means tested, users of state-funded social care tend to be poorer, and may not have experienced the same reductions in social care need as the population as a whole. The demand for state-funded care will also be influenced by the availability of unpaid care provided by family and friends.
The relationship between long-term conditions and social care need
Key points
- It is possible to be older than 65 and to have a long-term condition without having social care needs – in 2018 a third of those with no ADL limitations had two or more long-term conditions. The reverse is less often true – when people have social care needs, particularly multiple social care needs, they are very likely to also have a long-term condition. Only 2% of those with two or more ADL limitations do not have a long-term condition.
- More people now have long-term conditions without social care need than 15 years ago. In 2006, 33% of people with no social care needs had two or more long-term conditions. By 2018, this had risen to 36% – a 10% increase. This translates to 430,000 more people with multiple conditions but no social care need than in 2006. Turning to those with two or more ADL limitations, in 2006, 6% had no long-term conditions; by 2018 this had fallen to 2%, a 70% decrease. This means, in 2018, 61,000 fewer people had high social care need and were also free of conditions.
- Only the second of these changes is statistically significant, but both are consistent with an increased share of people being able to live independently with long-term conditions. The shift could be explained by a variety of factors. It may indicate that, in some ways, 2018’s older population is ‘healthier’. That is, although this population may be more likely to have long-term conditions in 2018, these conditions are less likely to be affecting day-to-day life, allowing people to remain independent for longer.
- The chances of having a social care need also vary according to the type of long-term condition a person has. People with neurological conditions – including motor neurone disease, multiple sclerosis, Parkinson’s and dementia – have the highest level of measured social care need. This is consistent with the nature of these conditions at advanced stages, although there may be other contributing factors.
The previous chapter showed that rates of social care need within each age group, as measured by ADL limitations, declined over time. In contrast, the rate of diagnosed long-term conditions increased for those aged 75 and older. This implies that more people with long-term conditions can live independently, and conversely that those with social care needs are likely to have more long-term conditions. In this chapter we look at the relationship between long-term conditions and social care need, and how this has changed over time.
We start by considering whether those with social care needs, as measured by ADL limitations, now are more or less likely to have long-term conditions than in the past. We then explore the association between social care need and particular long-term conditions. We know that it is possible to have a long-term condition but no ADL limitation, or to have an ADL limitation with no long-term condition. Long-term conditions can directly cause social care needs, either because of the nature of the condition or because the condition has been badly managed. But there are also many other factors that may influence people developing health and social care needs – such as age, experiencing socioeconomic deprivation, or injury. This chapter explores which conditions are most associated with social care need, using both national and local data – and discusses what the nature of this relationship might be.
More people now have long-term conditions without social care need than 15 years ago
The previous chapter separately analysed trends in long-term conditions and ADLs. But what happens when we look at these two things together? To what degree do they overlap and has the relationship between ADLs and long-term conditions been changing over time?
Table 2 divides the sample into those with zero, one and two or more ADL limitations as recorded in ELSA. Within each ADL group, it gives the percentage who have zero, one and two or more long-term conditions (as self-reported in ELSA). Focusing on 2018, we can see that over a third of those with no ADL limitations have two or more long-term conditions. This highlights that it is possible to have long-term conditions without automatically reducing a person’s ability to live independently, at least on the ADL measure. However, among those with one ADL, more than three in five have two or more long-term conditions, and this rises to three-quarters of those with two ADL limitations. Only 2% of those with two or more ADL limitations have no long-term conditions. This means that the great majority of those with social care needs also have multiple long-term conditions that must be managed alongside these.
The changes between 2006 and 2018 are relatively small. Given that the sample size is also relatively small, it is difficult to detect changes that are statistically significant. But we can assess whether the patterns are consistent with our results in chapter 3.
A central finding of chapter 3 was that the rate of diagnosed long-term conditions increased over time, but ADL limitations did not. Table 2 suggests that this occurred for those with different levels of social care need. In 2006, 33% of people with no social care needs had two or more long-term conditions. By 2018, this had risen to 36% – a 10% increase. This translates into an increase of 430,000 people with multiple long-term conditions but no social care need between 2006 and 2018.
Turning to those with two or more ADL limitations, in 2006 6% had no long-term conditions; by 2018 this had fallen to 2%, a 70% decrease. This means in 2018 61,000 fewer people had high social care need and were also free of conditions. Only the second of these changes is statistically significant, but both are consistent with an increased share of people being able to live independently with long-term conditions.
Table 2: The percentage of older people by number of ADL limitations reporting long-term conditions (2006 and 2018)
|
2006 |
2018 |
||
|
0 ADLS |
0 LTCs |
31% |
31% |
|
1 LTC |
36% |
33% |
|
|
2+ LTC |
33% |
36% |
|
|
1 ADL |
0 LTCs |
11% |
11% |
|
1 LTC |
27% |
27% |
|
|
2+ LTC |
62% |
62% |
|
|
2 + ADLs |
0 LTCs |
6% |
2% |
|
1 LTC |
21% |
23% |
|
|
2+ LTC |
73% |
76% |
Note: Percentages within each ADL grouping add up to 100%.
This shift could be explained by a variety of factors. It may indicate that, in some ways, 2018’s older population is ‘healthier’ than in 2006. That is, although this population may be more likely to have long-term conditions in 2018, these conditions are less likely to be affecting day-to-day life, allowing people to remain independent for longer.
Other factors are also likely to play into this, as discussed in previous chapters. This includes increased early diagnosis of some conditions, such as dementia. This means we identify people in 2018 earlier on in their illness than we did in 2006 – and therefore likely before social care needs develop.
The increased rate of long-term conditions was concentrated in those older than 80, where the rate of social care need is typically higher. A further implication is that this means those with social care needs may also be contending with an increased number of long-term conditions. This is consistent with what we see in Table 2, as for those with two or more ADL needs, the share with no long-term conditions fell from 6% to 2%, while the share of those with two or more long-term conditions rose from 73% to 76%.
Not all long-term conditions are associated with a social care need
Having a long-term condition does not automatically mean having a social care need. This could be because the condition does not affect an individual’s independence or the ability to perform daily activities, or because the condition is in its early stages or well managed. For example, if well managed, people with diabetes are able to live independently, and to avoid complications that might result in a need for social care support.
Figure 11 shows that the likelihood of having a social care need varies substantially by condition. The proportion of people who need social care support ranges from more than 80% for multiple sclerosis or motor neurone disease to 30% for cancer. Notably, around half of those with heart failure and half of those suffering from stroke reported a social care need – conditions that are perhaps less commonly discussed in the public debate on social care and social care reform.
Figure 11: Percentage of the older population needing ADL support by long-term condition, 2018
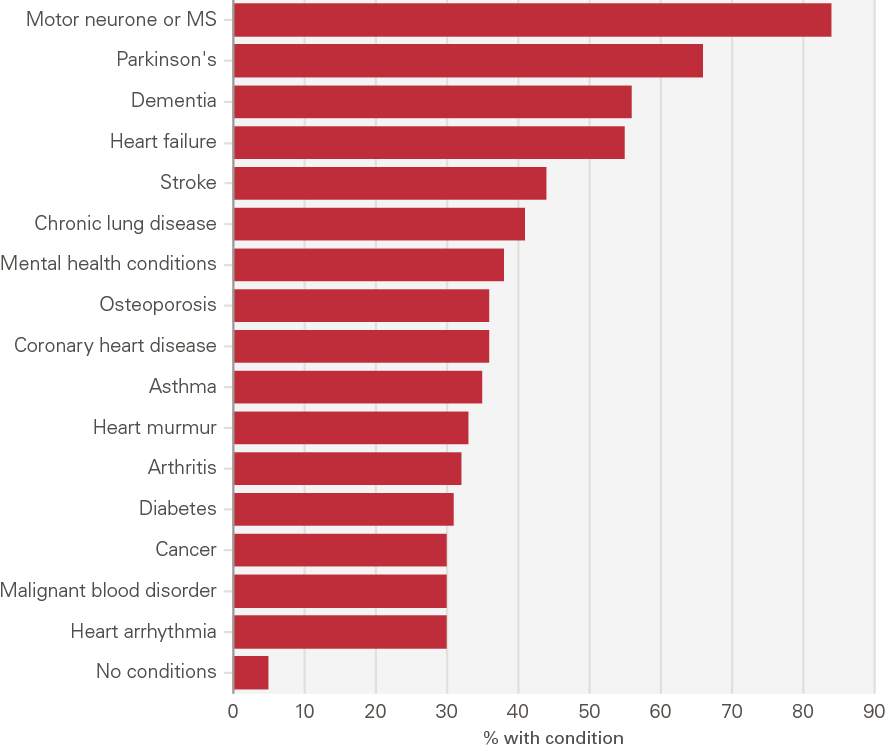
Source: ELSA, 2018.
The quantity of support someone receives also varies by condition type
ELSA data also report the amount of care people actually receive, rather than just their social care need. We use these data to explore how the quantity of care received varies by condition, calculated by looking at the number of times someone reports receiving paid or unpaid care for any of the six ADLs defined in ELSA. ELSA does not have individual questions for paid and unpaid care associated with each ADL. Instead, individuals report paid care for help with walking, using the toilet and getting in and out of bed in a single question. This would equate to one receipt of care. Paid care for help with showering and dressing are combined together in the next question (which would equate to another receipt of care) and paid care for help with eating is a separate question. In total, individuals could have up to three reported receipts of paid care. Questions related to unpaid care follow a similar pattern. This means an individual can have up to six reported receipts of paid and unpaid care.
This gives an indication of the variety of support needed by people with different long-term conditions in a nationally representative dataset, helping us to also understand the costs of care – paid or unpaid – that someone needs. There are limitations. We do not calculate the intensity of support as it is not available in this dataset; this relates only to people in the community. And we do not control for comorbidities or assess causality (so we do not know if the condition is actually causing the social care need). But this still provides some detail on how much support someone with a given condition typically needs, even if that support need may not be directly caused by the long-term condition.
Figure 12 shows that people with neurological conditions – motor neurone disease, Parkinson’s, stroke and dementia – report more instances of receiving paid and unpaid support than those with other conditions. These are conditions where there is a clear clinical pathway between the long-term condition and ADL limitation, although the same caveats around the joint determination of ADL limitations and long-term conditions remain. As Figure 13 shows, the presence of a neurological condition is associated with three times as many instances of paid and unpaid care compared with no neurological condition. Unpaid support was reported more frequently for this group.
Figure 12: The volume of paid and unpaid care by long-term condition, 2018
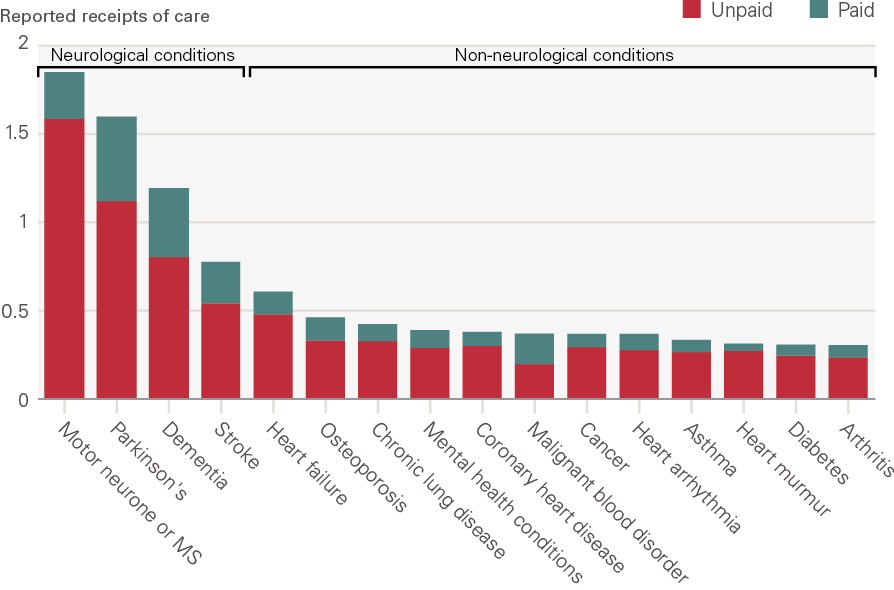
Source: ELSA, 2018. Note: Receipts of care are the number of times someone reports receiving paid or unpaid care for the three sets of ADLs. Respondents are asked whether they receive care for three sets of ADLs. Paid and unpaid care are counted separately giving a maximum total number of six receipts. These are: (1) walking, toileting and getting in and out of bed; (2) showering and dressing; (3) eating.
Figure 13: Paid and unpaid care – neurological conditions compared with other conditions, 2018
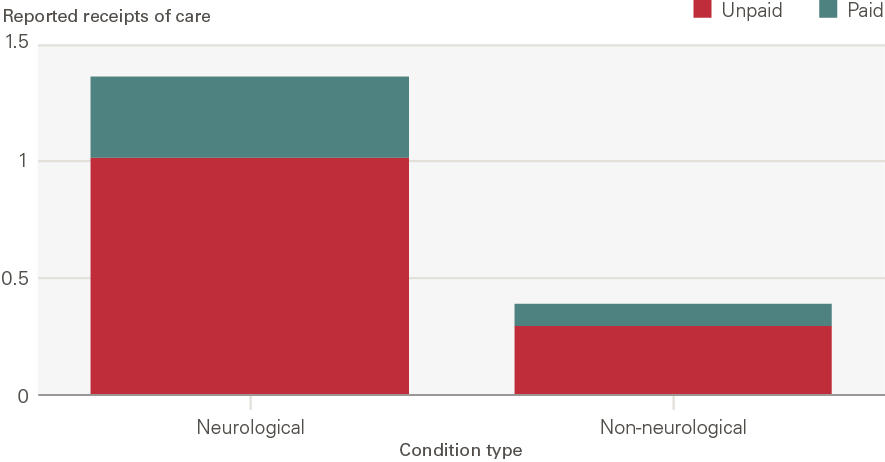
Source: ELSA, 2018. Note: Receipts of care are the number of times someone reports receiving paid or unpaid care for the three sets of ADLs. Respondents are asked whether they receive care for three sets of ADLs. Paid and unpaid care are counted separately giving a maximum total number of six receipts. These are: (1) walking, toileting and getting in and out of bed; (2) showering and dressing; (3) eating.
Just because a long-term condition is associated with high levels of social care need, this does not mean it is especially costly to society – how common that condition is also matters. For example, though motor neurone disease is the condition associated with most social care need, it is relatively uncommon – over four-fifths of people with motor neurone disease require support with two or more ADLs, but only 0.2% of the population has motor neurone disease.
Similarly, when thinking about the future demand for social care, policymakers need to be especially cognisant of the conditions becoming more common – usually because these are associated with ageing (such as dementia), and so will rise in prevalence as the number of older people increases. For example, one model projects an 80% increase in the number of individuals with dementia by 2035 – even under the assumption of declining age-specific incidence, in line with the wider literature. The social care needed to support individuals with dementia is already substantial, and likely to rise much further.
Those with some of the most common long-term conditions, including diabetes, arthritis and coronary heart disease have a lower number of ADL limitations than those with neurological conditions, although still more than those with no conditions. There are many reasons for this and many contributing factors. For example, the average person with diabetes is younger than the average person with dementia. We would therefore expect, all else being equal, that people with diabetes would have on average fewer ADL limitations than those with dementia, but due to difference in the age distribution not the long-term condition. However, the number of people with these conditions means that if there are causal pathways between these conditions and ADL limitations, even if relatively limited, any increase in prevalence could have important implications for social care need.
Case study: Social care need in North West London
Our analysis provides a national-level insight into the association between certain long-term conditions and social care need. This case study looks specifically at North West London, allowing us to draw on richer local datasets. This analysis, developed for the Health Foundation by the Health Economics Unit (HEU), uses a deidentified linked primary care, acute, mental health, community health and social care record for over 2.5 million people who live and are registered with a GP in North West London. Where ELSA data relies on individuals self-reporting their health conditions and social care needs and use, this uses actual NHS and local authority records of people’s use of care.
We analysed records of 444,000 people aged 65 and older in North West London who, at some point between 2015 and 2021, were registered with a GP within the area. Compared with the UK as a whole, this population is more ethnically diverse (~60% white, ~25% Asian, ~7% black), and 27% of the population live in the top third most deprived local areas in England.
In keeping with what we found in national level data, neurological conditions are associated with much higher social care spending. Figure 14 shows the total and average local authority social care spend by condition over the period 2015–2021. This is only for local authority spend, so excludes private spend by those with needs below the local authority thresholds – and by those whose wealth means that they do not qualify for state financial support.
The top five average spending per service users were multiple sclerosis, Parkinson’s disease, motor neurone disease, mental health conditions and dementia. When we take account of the prevalence of particular conditions we see that rarer conditions like motor neurone disease account for a smaller amount of total funding, but others rise in importance. The main five conditions in terms of total social care spending for North West London are anxiety, hypertension, Parkinson’s, dementia and diabetes.
Figure 14: Total and average local authority social care spend and number of people, by long-term condition (2015–2021)
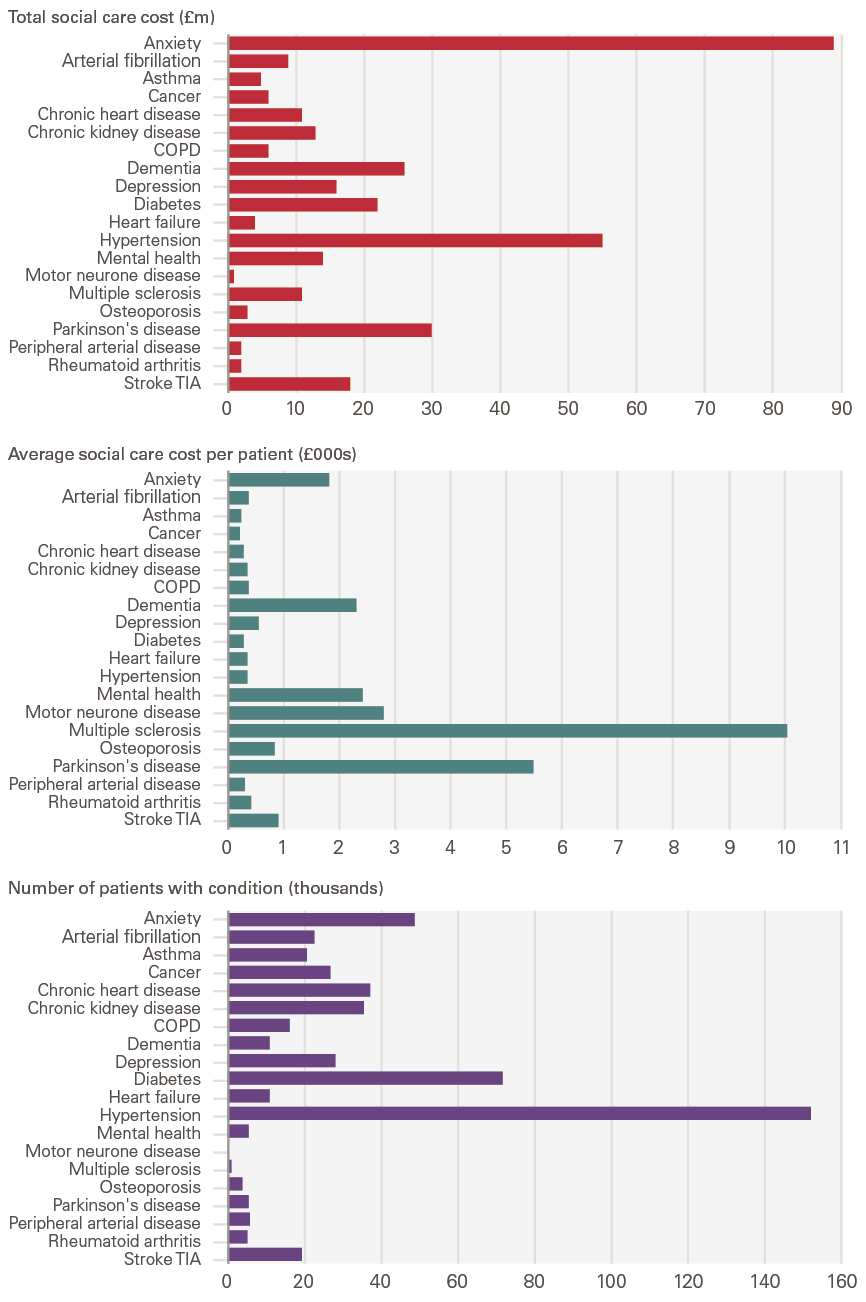
Source: Analysis by the Health Economics Unit of the Whole Systems Integrated Care (WSIC) dataset in North West London.
Discussion and conclusion
It is well established that England has an ageing population, in keeping with other advanced economies. That we are all likely to experience greater health and social care needs as we age is also well established. What is less well known is whether this relationship – between age, health and social care need – remains unchanged, or whether the effects of our ageing population are at least partly offset by an increasingly healthy older generation.
In this report we have explored this idea by looking at two measures of need: ADL limitations (as an estimate of social care need) and long-term conditions (as a proxy for health, and health care service demand). There are three overarching conclusions:
- Health and care needs rise with age, irrespective of the measure used. However, the rate at which need increases depends on the metric used. ADL limitations, which are a proxy for social care need, are relatively uncommon for people entering retirement and increase more rapidly after age 80. By contrast, long-term conditions are already common by age 65, with two-thirds of those aged 65–69 reporting at least one long-term condition. The proportion of people with conditions then increases more slowly with age.
- There has been a change in the relationship between age and social care need over time. This means a greater share of people are now able to live independent lives. Between 2006 and 2018, there was a fall in the share of people with social care needs in each age group. The change was greatest for those aged 80 and older. In contrast, according to primary care records the share of people aged 75 and older with two or more long-term conditions increased, and the share of those with no recorded long-term conditions fell. For those younger than age 75, rates of long-term conditions remained largely unchanged. These changes in prevalence interact with the increasing number of older people (driven by our ageing population) to mean that the number of people with social care needs has increased at a slower rate than the growth in the population over 65. By contrast, the number of people with diagnosed long-term conditions has increased at a faster rate than the growth in the older population.
- There is a substantial overlap between ADL limitations and long-term conditions, but you can have one without the other. It is possible to be older than 65 and to have a long-term condition without having social care needs – a third of those with no ADLs have two or more long-term conditions. The reverse is less often true – when people have social care needs, particularly multiple social care needs, they are very likely to also have a long-term condition. Only 2% of those with two or more ADL limitations do not have a long-term condition.
Insights for policymakers and system leaders
Our analysis leads us to outline five insights for policymakers:
- People with the highest needs also have increasingly complex needs – an individual with a social care need probably also has several long-term conditions. This makes delivering integrated care even more important and challenging. National policymakers and local integrated care systems will need to be prepared for a rise in the number of these individuals with particularly complex needs. Conversely, we also know that many people now have one or more long-term condition without social care need. Integration here will be about integrating within health care, not between health and social care.
- An ageing society does not inexorably lead to commensurate increases in the number of people with social care needs. Over the past 15 years, the number of people with social care needs has increased more slowly than the growth in the older population. This is because the rise in the number of older people has been counteracted by reductions in the rate of social care need by age. That is, any given older person is now less likely to have a social care need than in the past. Future need is therefore going to depend on the outcome of this ‘race’ between numbers and prevalence. If the trend of reduced prevalence of social care need by age stops or slows, overall need will rapidly increase.
- Unlike social care need, the likelihood of having two or more long-term conditions has increased for those aged 75 and older. But the extent to which this trend is ‘real’ and associated with actual changes to underlying health and wellbeing remains unclear. For example, the increase could be primarily driven by changes in diagnostic practices, such as the emphasis on diagnosing dementia earlier. To fully understand future need here, local areas and national policymakers will need a better grasp both of what is driving the increase, and the degree to which this increase has real implications for people’s health, wellbeing and use of health care services. In particular, they will need to be alert to changes in the types of conditions that increase in prevalence – and the specific services needed by neurological conditions such as dementia.
- These are national trends but the patterns and trends are likely to vary for different population groups and in different areas of the country. Integrated care systems have been charged with integrating care across different organisations and settings, joining up hospital and community-based services, physical and mental health, and health and social care. To do this, and to ensure that people receive coordinated services that meet their needs, integrated care systems will need a sophisticated understanding of need in their populations, based on evidence and analysis of joined-up datasets.
- The number of older people, and in particular those living to advanced ages (85 and older), is expected to rise substantially in the next 20 years. To be able to plan future service delivery effectively, national and local policymakers will need to understand how these changes in population structure will impact overall demand. This would be aided by projections of need that are informed by the latest, best available data and evidence.
References
- ONS. National population projections: 2018-based [webpage]. ONS; 2019 (www.ons.gov.uk/peoplepopulationandcommunity/populationandmigration/populationprojections/bulletins/nationalpopulationprojections/2018based#changing-age-structure).
- Iparraguirre J. The Economic Contribution of Older People in the United Kingdom – An Update to 2017. Age UK; 2017 (www.ageuk.org.uk/globalassets/age-uk/documents/reports-and-publications/reports-and-briefings/active-communities/the_economic_contribution_of_older_-people_-update_-to_-2017.pdf).
- Tallack C, Charlesworth A, Kelly E, McConkey R, Rocks S. The bigger picture: learning from two decades of changing NHS care in England. The Health Foundation; 2020 (www.health.org.uk/publications/reports/the-bigger-picture).
- Rocks S, Boccarini G, Charlesworth A, Idriss O, McConkey R, Rachet-Jacquet L. Health and Social Care Funding Projections 2021. The Health Foundation; 2021 (www.health.org.uk/publications/health-and-social-care-funding-projections-2021).
- Banks J, Batty GD, Breedvelt JJF, Coughlin K. (2021) English Longitudinal Study of Ageing: Waves 0-9, 1998-2019 [data collection]. 36th Edition. UK Data Service. SN: 5050.
- Herrett E, Gallagher AM, Bhaskaran K. Data resource profile: clinical practice research Datalink (CPRD). Int J Epidemiol. 2015; 44: 827–36.
- Kingston A, Wohland P, Wittenberg R, Robinson L, Brayne C, Matthews F. Is late-life dependency increasing or not? A comparison of the Cognitive Function and Ageing Studies (CFAS). The Lancet. 2017; 390: 1676-1684.
- Wittenberg R, Hu B, Jagger C, Kingston A, Knapp M, Comas-Herrera A, King D, Rehill A, Banerjee S. Projections of care for older people with dementia in England: 2015 to 2040. Age and Ageing. 2020; 49: 264–269.
- Barker R, Hanratty B, Kingston A, Ramsey S, Matthews F. Changes in health and functioning of care home residents over two decades: what can we learn from population-based studies? Age and Ageing. 2020; 00: 1-7.
- Ahmadi-Abhari S, Guzman-Castillo M, Bandosz P, Shipley MJ, Muniz-Terrera G, Singh-Manoux A. Temporal trend in dementia incidence since 2002 and projections for prevalence in England and Wales to 2040: modelling study. BMJ. 2017;358:j2856 doi:10.1136/bmj.j2856.
- NICE. NICE impact diabetes. NICE; 2018 (www.nice.org.uk/media/default/about/what-we-do/into-practice/measuring-uptake/impact-diabetes.pdf).
- Kingston A, Robinson L, Booth H, Knapp M, Jagger C, MODEM project. Projections of multi-morbidity in the older population in England to 2035: estimates from the Population Ageing and Care Simulation (PACSim) model. Age and Ageing. 2018; 47: 374–380.
- Matthews F, Stephan B, Robinson L. A two decade dementia incidence comparison from the Cognitive Function and Ageing Studies I and II. Nature Communications. 2016; 7: 11398.
- Stoye G, Zaranko B. How accurate are self-reported diagnoses? Comparing self-reported health events in the English Longitudinal Study of Ageing with administrative hospital records. IFS; 2020 (https://ifs.org.uk/publications/14864).
Appendix 1: Analysing long-term conditions in ELSA and CPRD
English Longitudinal Study of Ageing (ELSA) asks individuals questions about 21 long-term health-related issues: chronic lung disease, asthma, arthritis, osteoporosis, cancer, Parkinson’s, emotional, nervous or psychiatric disorders, Alzheimer’s, dementia, malignant blood disorders, motor neurone disease or multiple sclerosis, high blood pressure, angina, heart attack, heart failure, heart murmur, heart arrhythmia, diabetes, stroke, high cholesterol and heart disease.
The Clinical Practice Research Datalink (CPRD) data has a higher level of aggregation for some of these conditions and so in order to maintain consistency across the two data sources, we have combined angina, heart attack and heart disease to create a variable for coronary heart disease and dementia and Alzheimer’s into a combined dementia variable.
High blood pressure and high cholesterol are highly prevalent biological markers rather than conditions. They are indirectly associated with social care need since they are risk factors for cardiovascular diseases such as coronary heart disease and stroke which are included in the final list of conditions. For these reasons, we exclude high blood pressure and high cholesterol from the analysis.
Arthritis is also a condition associated with high prevalence and moderate to high social care need among older people and so it has been included in the final list. Arthritis in ELSA doesn’t map to what is measured in CPRD. ELSA asks about arthritis in general whereas CPRD only includes information about rheumatoid arthritis which is a less common type of arthritis.
Chronic lung disease in ELSA is comparable to COPD in CPRD. Heart arrhythmia in ELSA is comparable to atrial fibrillation (AF) in CPRD. Although AF is only one type of heart arrhythmia, it is the most prevalent. ELSA asks individuals about motor neuron disease and multiple sclerosis (MS) whereas CPRD only has information about MS. But this is still fairly comparable due to the very low prevalence of these conditions.
The final list of 16 conditions that have been included from ELSA are asthma, arthritis, cancer, chronic lung disease, coronary heart disease, dementia, diabetes, emotional, nervous or psychiatric disorders, heart arrhythmia, heart failure, heart murmur, malignant blood disorders, motor neurone disease/multiple sclerosis, osteoporosis, Parkinson’s and stroke.
The final list of 16 conditions that have been included from CPRD are anxiety/depression, asthma, atrial fibrillation, cancer, coronary heart disease, chronic liver disease, chronic kidney disease, COPD, dementia, diabetes, heart failure, multiple sclerosis, Parkinson’s, rheumatoid arthritis, schizophrenia and stroke.
Appendix 2: Subjective, objective and diagnosed measures of health and social care need
Activities of daily living (ADLs)
ADLs have limitations when used as a proxy for need for social care support. Firstly ADLs represent social care need from a system perspective rather than from an individual perspective. ADL limitations are used to assess whether an individual needs help with a social care need. In reality an individual may have a social care need but not have any ADL limitations.
Various studies instead use a measure of dependency – which takes into account how often someone needs support. These studies use evidence based on data from the Cognitive Function and Ageing Studies (CFAS) – a population-based study of individuals living in the community and institutional settings., The use of dependency, rather than simply ADLs, is a better measure of the level of resources that would be needed to support the individual. It also recognises that not all individuals needing support with an ADL have the same needs; some will require more support than others. However, it is not possible to create a dependency metric using ELSA – the primary data source of this report. We therefore rely on simpler measures of the quantity of ADLs someone needs support with.
We use ADLs as measured in ELSA, which is a self-reported survey. It is therefore a subjective measure of someone’s own views of their abilities to complete tasks of daily living. ADLs can also be measured subjectively by local authorities, as part of their assessments of whether someone reaches the threshold of need to qualify for local authority funded care.
Long-term conditions
People have needs for which they potentially need long-term care and support, either in primary care (eg condition and medication review, advice and support), the community, in residential care settings, in day care settings and at home.
These needs will derive from long-term health conditions that require ongoing management, and conditions such as diabetes or those which involve neurological impairment which make it more difficult to undertake activities of daily living. Information about these conditions and needs can come from a variety of sources – some objective, some subjective and some diagnostic. Each has its advantages and flaws.
There is information from direct objective measurement of an individual’s health across a sample of the population. Examples include BMI as a measure of obesity and blood pressure as a measure of cardiovascular health. There are also objective social care measures – such as an individual’s ability to balance or walk in a straight line – indications of their ability to safely undertake daily activities.
If a population is randomly sampled and their health measured using an objective instrument, we can get a good idea of population prevalence – either of the condition itself or the risk factors associated with it. But there are relatively few such measures readily available for a representative sample, mainly due to the cost of carrying out diagnostic tests at scale.
The second source is information from diagnosis or assessment. This may be recorded in a person’s health record or social care records. For example, following a consultation or health check, a GP may record the long-term conditions that a person has. Following an episode in hospital, an individual’s hospital record may record any conditions they have, regardless of whether it was directly relevant to the reason for admission. However, information from these sources may not always tell us a reliable story about the prevalence of needs in the population as a whole.
The information will not necessarily be recorded for everyone who has that condition (or a representative sample). For example, someone who has not visited their GP may not have a condition recorded. GPs may also not always diagnose a condition that an individual has if they have no reason to suspect it.
What is diagnosed and recorded in health records will depend on policy and practice and these change over time. For example, diagnosis of dementia in health records has increased hugely over the past 10 years. Internal analysis using primary care records shows that the prevalence of diagnosed dementia among people aged 65 and older more than doubled from 1.2% to 3.2% between 2000 and 2015. This is not because the prevalence of dementia has grown, but because awareness of the condition and its symptoms has grown and because there have been policy pushes to encourage diagnosis.
The third source is information from individuals themselves about their health and its impact on their life. For example, the English Longitudinal Study of Ageing asks people aged 50 and older about the long-term conditions they have and whether they have difficulty with ADLs. For some measures of need information from self-reports is more relevant than objective measures. For example, asking about how someone’s health affects what they can do may be more relevant than knowing that they have a certain condition.
The weakness of self-reported measures is that individuals do not always know about and accurately report their conditions. The Institute for Fiscal Studies compares self-reported information on the incidence of heart attacks, stroke and cancer in the past 2 years with diagnostic information from hospital records. They found that more than half of respondents diagnosed in hospital with a condition in the previous 2 years fail to report the condition when surveyed. Conversely, half of those who self-report a cancer or heart attack diagnosis, and two-thirds of those who self-report a stroke diagnosis, have no corresponding hospital record. A major driver of this reporting error appears to be misunderstanding or being unaware of their diagnoses, with false negative reporting rates falling significantly for heart attacks and strokes when using only primary hospital diagnoses to define objective diagnoses.
If people’s reporting biases do not change over time, self-reported measures may be more reliable in telling us about the changes that have taken place over time.
There are links between these measures. As the real and actual prevalence across the population changes, this would be reflected in all three measures. If the prevalence by age and sex (eg the proportion of women aged 80–84 with a condition) is not changing but awareness is, this may be reflected in GP and hospital records (if more diagnoses are made and recorded) and may also be reflected in self-reports.