Acknowledgements
The authors acknowledge NHS Digital, the Office for National Statistics and the Organisation for Economic Co-operation and Development (OECD) for providing data and guidance on data usage and referencing. The authors are also grateful for background information provided by the Office of Manpower Economics, the Department of Health and Social Care, NHS England and NHS Improvement, NHS Employers and NHS Providers in supporting discussions, as well as additional peer review of international comparisons data by the OECD. Further, the authors are grateful for background information provided by national nurses’ associations in Australia, Canada, Germany, New Zealand, Sweden and the United States.
In addition, the authors would like to thank REAL Centre and wider Health Foundation colleagues for their input, support and guidance, with particular thanks to:
- Elaine Kelly, Anita Charlesworth, Charles Tallack, Omar Idriss, Giulia Boccarini and Jennifer Dixon who reviewed the report
- members of the Health Foundation communications team: Simon Perry, Sarah Witts, Kate Addison, Sean Agass, Pete Stilwell and Creina Lilburne.
Errors and omissions remain the responsibility of the authors alone.
When referencing this publication please use the following URL: https://doi.org/10.37829/HF-2021-RC19
Executive summary
The NHS Hospital and Community Health Service (HCHS) in England directly employs around 311,000 full-time equivalent nurses and health visitors. These staff account for a quarter of all NHS staff and nearly half of NHS vacancies. In 2019/20, their pay bill accounted for nearly one-third of the overall NHS Agenda for Change staff pay bill of around £43.4bn. Better understanding of the pay determination process for NHS nurses is therefore crucial for informing policy on NHS nurse recruitment and retention, staff pay and, more broadly, funding.
In this report, we explore the method underlying this process of determining NHS nurses’ pay and its outcome in terms of nurses’ actual earnings, particularly in the NHS HCHS in England. Practice nurses and nurses working for non-NHS employers are not the primary focus due to a lack of relevant data. We also analyse long-term trends in UK nurses’ earnings, drawing on Organisation for Economic Co-operation and Development (OECD) data and stakeholder input for additional insights from international comparisons. Our goal is to generate evidence that provides insights into the long-term outcomes on nurses’ earnings, and highlights scope for potential improvements to the UK’s current approach to nurse pay determination.
There have been significant changes in NHS staff pay determination since the NHS was established in 1948. In the 1950s and 1960s, arbitration was frequently used to settle Whitley council disputes. In 1983, separate review bodies were established to streamline pay determination for NHS nurses and allied health professionals. Subsequently, these review bodies were merged to form the NHS Pay Review Body (NHSPRB), which has since made recommendations on pay increases for most NHS staff (except doctors, dentists and very senior managers) to the UK government, usually on an annual basis. Major landmarks in NHS nurses’ pay determination since the 1980s were the introduction of clinical grading in 1988 and the initiation of Agenda for Change in 2004. Clinical grading introduced a new pay structure which used job evaluation techniques to link nurses’ pay rates to their roles, skills and responsibilities, rather than merely their job titles. The Agenda for Change framework is characterised by harmonised pay scales and career progression systems across different NHS occupations.
We present analysis of long-term trends in UK nurses’ earnings, exploring how the changes in nurses’ earnings since the 1980s compare with inflation, all-employee average earnings and the average earnings of police officers and secondary teachers, two public sector occupations which provide useful points of comparison. NHS nurses’ earnings comprise basic and non-basic elements. Basic earnings generally account for over 80% of nurses’ overall earnings and over 90% of overall earnings for higher Agenda for Change pay bands. Non-basic earnings include additional components such as overtime pay, geographic allowances and shift work payments. The relative size of these components varies between different nurses and different pay bands. Our analysis focuses on basic earnings, for which trend data are more widely available. Due to data constraints, we do not examine non-basic earnings components and ‘total reward’ considerations (pensions and other benefits recorded in Total Reward Statements), although these are important in developing a fuller understanding of nurses’ compensation and labour market behaviour. We also do not consider the impact on nurses’ labour market participation decisions of other, non-financial factors such as childcare and other care support and flexible working.
Overall, female full-time nurses’ average gross weekly earnings doubled in real terms between 1988 and 2009. This was followed by the public sector pay cap period of 2010–2017 which led to a real-terms earnings decrease for nurses. This meant that female full-time nurses’ mean gross weekly earnings in 2019 were virtually the same as in 2008.
Taking inflation into account reinforces the point about the negative impact of the pay cap. NHS nurses’ basic earnings in England grew by 13% in nominal terms over the period from March 2011 to March 2021. After accounting for consumer price inflation, this amounts to a fall of 5% in real terms. Taking a longer term perspective, between 1989 and 2019 female full-time nurses’ real-terms weekly earnings grew by a very similar factor to overall full-time employee earnings in the UK.
When we consider comparable public sector occupations such as policing and teaching, our analysis shows that since 1989, female full-time nurses’ average real-terms weekly gross earnings have grown more rapidly than those of female full-time police officers and secondary teachers. This includes the public sector pay cap period.
This report also makes a crucial point about earnings trends analyses: the results can vary markedly depending on the choice of start year. For example, taking 1989 as a start date UK nurses’ average weekly earnings increased by 59% in real terms by 2019. However, if the start date for analysis is moved by one year to 1988, then the increase in earnings to 2019 was 94%. This difference is due to the introduction of clinical grading in 1988 which, in a single year, increased average real-terms earnings of NHS nurses by 22%.
Further, we undertake international comparisons analysis using OECD data. This gives insights into the variations in the earnings of nurses across a selection of broadly comparable OECD countries, some of which compete with the UK for international nurse recruitment. On average, hospital nurses’ earnings in the UK are lower than the corresponding averages in key comparator economies such as Australia, Canada, New Zealand and the United States. This holds both in absolute terms (when comparing remuneration levels across countries adjusted for cost of living in each country) and relative terms (when comparing the remuneration of nurses to the average wage of all workers in each country).
Additional consideration of the pay determination systems in place in major comparator countries (Australia, Canada, Germany, New Zealand, Sweden and the United States) reveals that most of these countries have a national or regional framework for nurses’ pay determination, underpinned by trade union recognition and collective bargaining. The majority also have options for targeted additional incentives for posts that are particularly difficult to fill. The UK stands out as having long-term reliance on an independent review process as a central element in pay determination for nurses and other professionals working in the public sector.
The effects of COVID-19 on the wellbeing and workload of the nursing workforce in these countries have varied, reflecting differences in the prevalence of the pandemic. However, all the countries have had to scale up the workforce in preparation, and most have experienced very significant increases in surge related workload, stress and reported burnout. All with the exception of England and New Zealand report having made some type of additional COVID-19 related payment to nursing staff.
On the whole, we conclude that over the long term, since it was established in 1983, the pay review body approach has contributed to overall pay determination stability for UK nurses. The ability to reach independent recommendations provides scope to take a considered and evidence-based view of an issue that is always contested and sometimes controversial, and which has significant public funding implications. However the process can only be judged as successful if recommendations are fully implemented by the governments in the four UK countries, which we highlight has not always been the case. In addition, our major qualification to this overall assessment is the negative impact of the 7-year public sector pay cap which ended in 2017. The review body approach also gives scope for planned and agreed changes to be made in the overall pay determination process and structure, and as such it has also been able to underpin several major overall changes in pay structure; however the most recent substantial restructuring was some time ago, with the Agenda for Change reform introduced in 2004.
The broader policy emphasis in the NHS is now on how to ‘build back better’, and part of that broader focus must be to assess if the NHS pay system remains fit for purpose. In its most recent report, the NHSPRB has identified the need for further reform of the system. Along with other key stakeholders, it has highlighted the need for improved pay rates and career pathways for experienced and advanced practice nurses. Further, it has emphasised the need for a more in-depth examination of pay rates and career pathways for experienced and advanced practice nurses, as well as the use of targeted pay supplements, pay equity and the overall reward package. The emerging divergence in the approaches of the four UK countries to NHS staff pay also merits further attention. Accommodating differences within a unified system is leading to tension and it may be time to consider a more devolved pay system across the four UK countries for NHS nurses.
The pandemic has accelerated the need to review the current approach to NHS nurses’ pay determination. The UK government’s recent announcement of a full public sector pay round for 2021/22 is a start. In the longer term, post-pandemic NHS recovery and rebuilding calls for an NHS nurse pay system that is built around supporting workforce sustainability and the achievement of service objectives. However, at the time of writing, the most recent NHS People Plan gives no detailed consideration of NHS staff pay, pay determination processes, and related career structures. Our analysis underscores the need for a comprehensive NHS workforce strategy which places the staff reward package front and centre and acknowledges the centrality of pay as a powerful driver of nurse motivation and retention.
Introduction
Pay is a critical aspect of the relationship between the NHS as an employer and its staff. If employees and potential employees perceive the NHS payment system as being fair, this can have positive impacts on recruitment and retention. In particular, pay structures are a crucial element of career progression and maintaining competitiveness with other career options. They can also be used to motivate staff to work in certain regions and specialties and at unsociable hours. Conversely, when staff do not view the pay determination process as clear and fair, this can demotivate them and make them think that their contribution and skills are not valued.
In this report, we focus on two key aspects of the pay determination system that are closely connected. First, we consider the actual method that determines what NHS nurses are paid and how it has evolved over time. Second, we look at the outcome of that process, in terms of the actual pay levels that NHS nurses receive. We take a long-term view. We are primarily concerned with analysing NHS nurse pay and earning trends, making comparisons with other occupations and examining the long-term outcomes of the pay determination process. We also make some international comparisons to provide reference points and comparisons. For the purposes of this report, we focus on pay and do not examine broader aspects of the reward package.
This report focuses on NHS nurses’ and health visitors’ earnings because this staff group is the largest professional group in the NHS, comprising about 26% of the NHS Hospital and Community Health Service (HCHS) workforce in England. It also accounts for nearly half of NHS staff vacancies, and has been the centre of concerns about the impact of staff burnout as a result. We bring together a range of data in order to contextualise the current pay debate in the longer term trends and we highlight and reflect on key changes that have occurred in the pay determination process for NHS nurses (Annex 1 provides a summary of data sources). Further, we look at international comparisons, both to illustrate the relative position of nurses’ pay in some comparator/competitor OECD countries and to review the pay determination process in these countries.
Our overall aim is to assess the current NHS nurses’ pay determination process and its outcomes. At a time of major recruitment and retention challenges, we also examine major changes in the process over time. Our international perspective gives an insight into how much nurses are paid in other countries, but also how they are paid. The evidence we generate gives insights into the scope for change and improvement in the UK’s current approach.
The current NHS pay system for nurses
The NHS HCHS in England directly employs around 311,000 full-time equivalent nurses and health visitors (around 347,000 by headcount, 88% of whom are female). In 2019/20, the pay bill for these staff amounted to around £14.3bn, or nearly a third of the overall NHS Agenda for Change staff pay bill of around £43.4bn. For nurses and other health care professions, the national NHS pay recommendations are made by independent Pay Review Bodies (PRBs).
Each PRB is a committee of independent experts appointed by the UK government, with a secretariat provided by the Office of Manpower Economics. The pay of NHS nurses is considered by the NHS Pay Review Body (NHSPRB), which is also responsible for reviewing the pay of most other NHS staff covered by the Agenda for Change system. This includes NHS nurses and clinical support staff, maintenance staff, porters and administrative and clerical staff, but not doctors, dentists or very senior managers (approximately 1.5 million staff by headcount across the UK). There is a separate Review Body on Doctors’ and Dentists’ Remuneration (DDRB), which covers consultants, specialty doctors and associate specialists, doctors and dentists in training, general medical practitioners and general dental practitioners.
The NHSPRB therefore has a remit covering very different occupations. Its recommendations are based on several main considerations, including the need to recruit, retain and motivate suitably able and qualified staff; the implications of regional and local labour market variations; the UK government’s inflation target; how pay links to the recruitment and retention of staff; the principle of equal pay for work of equal value; and ‘affordability’: the funds made available. The NHSPRB currently provides independent advice on the pay of NHS staff to the Prime Minister, the Secretary of State for Health and Social Care, the First Minister of Scotland, the First Minister of Wales, and the First Minister and Deputy First Minister of Northern Ireland.
The review bodies make their recommendations on pay increases based on evidence submitted by trade unions, employers and the governments in the four UK countries, and on any additional research which they have commissioned. In ‘normal’ times this has been an annual process. In the most recent pay round (2021/22) the Scottish government decided not to take part in the full review body process, making its own pay recommendations for staff covered by the NHSPRB.
The NHS in England employs about four out of every five working nurses. The remaining 22% of nurses work across a range of other organisations including social care, charities, non-governmental organisations (NGOs) and the private sector. Their pay is determined by their employers, thus pay rates and employment conditions will vary; however, the NHS can be regarded as determining the ‘going rate’ in most labour markets.
The review body for NHS nurses and midwives’ pay was first established in 1983, ‘following a rancorous 18-month long pay dispute that involved most NHS staff other than doctors and dentists’. The DDRB had been set up much earlier, firstly in 1963, and then with a replacement body in 1971, and was the working model for the other review bodies. Subsequently the nurses’ review body was restructured to form the NHSPRB, which by 2007 had coverage expanded to all other NHS staff apart from doctors, dentists and very senior managers.
The main potential strength of the review body approach is that it provides an independent source of analysis that can take evidence from the different main stakeholders – the governments in the four UK countries, employers, trade unions – and arrive at evidence-based recommendations on increases in pay rates. The main weakness is that the governments in the four UK countries and employers are not bound to implement these recommendations in full, or at all. As we will show later in this chapter, there have been many years in which the recommendations have not been fully implemented, usually because the governments in the four UK countries have delayed implementation or have initiated pay constraints.
In the past, the review body process was normally an annual cycle of evidence taking, followed by pay recommendations made to the governments in the four UK countries for its consideration or implementation. However, this relatively stable pattern has been disrupted across the last 10 years. A 7-year austerity related pay cap for public sector workers (2010–2017) essentially marginalised the review bodies from making pay recommendations, and this was followed by a 3-year pay agreement for NHS Agenda for Change staff (2018–2021), which ended this year. During the NHS staff pay round for 2021/22, the Department for Health and Social Care initially submitted a 1% pay increase offer for NHS Agenda for Change staff in England. In July 2021 the UK government accepted and implemented the consolidated 3% pay increase recommended by the NHSPRB. In October 2021, the UK government announced that it would run a full public sector pay round for the following year, with pay awards to be announced in 2022 following the responses of the governments in the four UK countries to pay review body recommendations.
There is an additional challenge to the review body system. Its remit covers the NHS in each of the four UK countries, but there are some differences in approach as well as broader policy divergence occurring across the UK countries, which have become more apparent in recent years. As noted above, in the 2021/22 pay round the Scottish government took its own collective bargaining approach. This raises questions about the continuing ability to maintain internal coherence across four countries which have different electoral and funding cycles, differing NHS priorities, and may have different labour market dynamics.
Table 1 summarises the recommendations made by the NHS nurses’ pay review body since it was first set up in 1983. There have been three time periods when there were significant changes in the process:
- In 1988 ‘clinical grading’, a new pay structure for NHS nurses, was implemented. The new structure was developed using job evaluation techniques to identify key criteria for grading jobs systematically. The aim was for the pay rates to be determined by the key elements of the roles, skills and responsibilities undertaken by the nurse, not just job titles. Clinical grading represented a step change in the approach to NHS nurses’ pay determination.
- In the mid-1990s (1995,1996) there was a government-led attempt to shift more of the pay process for most NHS staff, including nurses, from a national pay approach to one that had local level pay determination. This largely failed, and a national focus has been retained for virtually all staff.
- In 2004 Agenda for Change was introduced, after several years of negotiation between the governments in the four UK countries, employers and unions to develop a pay system that would harmonise pay scales and career progression arrangements across different NHS occupations and professions. This introduced an NHS-wide new pay structure for all NHS staff other than doctors, dentists and very senior managers. It was partly driven by the need to comply with pay equity legislation and to ensure that the NHS pay system enabled equal pay for equal worth.
Table 1 also highlights that, while the governments in the four UK countries often accepted, funded and implemented the review body recommendations, there were many other years in which they then delayed or ‘staged’ the implementation in order to reduce the increase in pay bill costs.
NHS nurses’ pay is therefore primarily determined at the national level. Since 1983, this has been based on a review body process, which has some degree of independence, but is always open to government constraints. In addition, any new national contracts are negotiated directly between the governments in the four UK countries and unions.
Table 1: Summary of nurses’ pay review body recommendations and actual implementation, 1984 to current
- The rows shaded in grey represent the 7-year public sector pay restraint period (2010/11–2017/18).
- The rows shaded in teal represent periods in which the implementation of nurses’ pay awards was delayed or ‘staged’.
|
Year(s) |
Recommended headline pay rise |
Actual implementation of recommendations |
|
2021/22 |
3% |
PRB recommended a 3% consolidated pay increase for all staff – accepted by the UK government but subject to trade union ballots at the time of writing. |
|
2018/19–2020/21 |
6.5% |
3-year deal. Not a PRB recommendation but the result of negotiations to deliver pay rises, new structure and reduced number of increments. Fully funded. |
|
2017/18 |
1% |
Recommended 1% to Agenda for Change pay points and 1% on High-Cost Area Supplements (HCAS) in England, Wales and Northern Ireland – paid in full. |
|
2016/17 |
1% |
1% consolidated rise on all pay points paid in full. |
|
2015/16 |
1% for some |
Not a PRB report/recommendation. Negotiated outcome. |
|
2014/15 |
1% rejected by the UK government |
PRB recommended 1% on all pay points and high-cost area allowances. |
|
2013/14 |
1% |
PRB awarded 1% on all scales and high-cost area allowances. |
|
2012 |
|
PRB response to Chancellor’s invitation to consider ‘How Agenda for Change pay can be made more appropriate to local labour markets’. |
|
2012 |
0% and £250 for staff earning under £21,000pa |
Second year of the 2-year pay freeze imposed by the coalition UK government. |
|
2011 |
0% and £250 for staff earning under £21,000pa |
The UK coalition government stated no annual pay rise for anyone earning over £21,000, for 2 years from 1 April 2011. |
|
2009/10 |
2.25% |
Year 3 of a 3-year deal. |
|
2008/09 |
2.4% |
Year 2 of a 3-year deal. |
|
2007/08 |
2.75% |
Year 1 of a 3-year deal. |
|
2006/07 |
2.5%(staged award in England) |
Staged award, in England: 1.5% payable from 1 April 2006, the remaining 1% from November. |
|
2004/05 |
3.225% for each year, over 3 years |
Not a PRB award. The 3.225% over 3 years was part of the negotiated implementation of Agenda for Change. |
|
2003 |
2.5% |
2.5% on pay, leads and allowances. Paid in full. |
|
2002 |
3.6% |
Paid in full. |
|
2001 |
3.7% |
Paid in full. |
|
2000 |
3.4% |
Paid in full. |
|
1999 |
4.7% |
Paid in full. |
|
1998 |
3.8% |
Staged award: 2% from April, remainder from December. |
|
1997 |
3.3% |
Staged award: 2% from April, remainder from December. |
|
1996 |
2% |
Second year of local pay. 2% national award, topped up by further 0.8% in 14th report under Framework Agreement. |
|
1995 |
1% |
First year of ‘local pay’. 1% national award, topped up to 3% in 13th Report under Framework Agreement. |
|
1994 |
3% |
Paid in full. |
|
1993 |
1.5% |
Pay ‘squeeze’ in line with public sector pay policy. |
|
1992 |
5.8% |
Paid in full. |
|
1991 |
9.5% |
Staged award: 7.5% from April, remainder from December. |
|
1990 |
9% |
Staged award: 7% from April, remainder from July. |
|
1989 |
6.7% |
Paid in full. |
|
1988 |
Approximately 15% (on average) |
Not a PRB award. Clinical grading introduced. Paid in full but a significant number of appeals were lodged. |
|
1987 |
11% |
Paid in full. |
|
1986 |
8% |
Payment delayed from April until July. |
|
1985 |
9% |
Staged award: 5% from April, remainder from June. |
|
1984 |
8% |
Paid in full. |
Source: Authors’ notes based on stakeholder input.
73 years of NHS pay
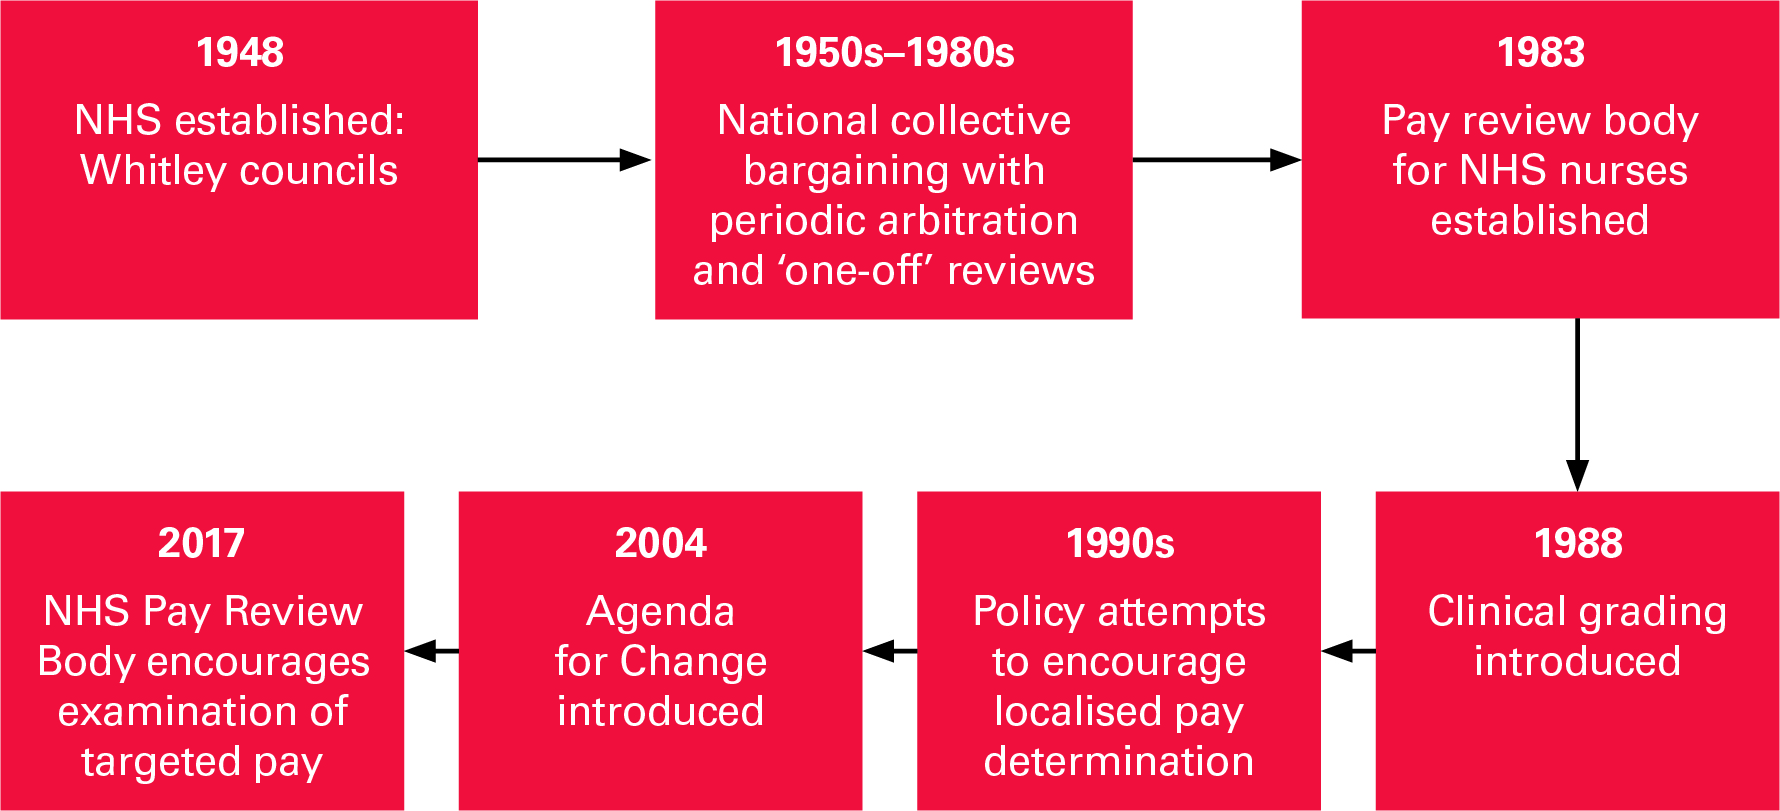
Figure 1 provides a timeline of the major shifts in the NHS pay determination process for nurses since 1948. When the NHS was established in 1948, pay determination was based on national bargaining units (‘Whitley councils’), each involving multiple staff associations or trade unions representing different staff groups.
In the 1950s and 1960s, there was frequent recourse to arbitration to settle Whitley council disputes; for example, there were four reviews of NHS nurses’ pay in the 1960s, and two further independent reviews in the 1970s. These were essentially ‘catch up’ exercises, with NHS pay having fallen behind that of other workers in between these reviews.
In more recent decades, broader plans for NHS reform and restructuring included suggestions that that NHS pay determination process be shifted to a more localised approach. The rationale for this was that it would enable local NHS management autonomy and control and reflect more closely varying labour market conditions. The need for localised or ‘regional’ pay determination was a theme of the NHS reforms of the 1980s and 1990s., Despite this emphasis on additional local pay flexibility during these decades, the reality was that only a very small number of NHS employers withdrew from the national pay system, and some of those who did have subsequently returned. The main reasons given for this repeated stalled shift away from a national approach have included a lack of funds, limited local management capacity (or lack of interest) and opposition from trade unions.,
The last significant reform of the pay structures for NHS nurses and other staff was implemented about 15 years ago. Agenda for Change took several years to negotiate and implement fully, with its introduction beginning in 2004. The main stated objectives of these reforms were to improve recruitment and retention, increase pay flexibility within a national framework and improve productivity, as well as to ensure that NHS staff pay determination processes complied with equal pay legislation (Chapter 2 provides more detail on the Agenda for Change pay framework). A National Audit Office review of its implementation highlighted that despite the significant overall costs of implementation, there was no systematic assessment of the costs, benefits and impact of Agenda for Change.
Figure 1: Timeline of major changes in NHS nurses’ pay determination in the UK, 1948–2020
 Source: The Health Foundation
The current national system does make some provision for local pay flexibility, notably London weighting for staff in the capital and HCAS for staff working in specified regions, mainly in the South East, but use of these supplements has been limited. The NHSPRB has also expressed interest in looking at targeted pay and noted in 2017 that, ‘There is, however, clearly a case for pay targeting given that there are recruitment and retention pressures in certain occupational groups and in some geographical areas.’
Use of the limited flexibilities that exist in the system have also been constrained in recent years by national pay restraint and central pay bill control. Local flexibility within a national system is particularly difficult to sustain when there is little capacity or additional resources for individual organisations to be innovative in determining pay, and when the external labour market is challenging, with many NHS employers in England reporting significant difficulties in recruiting nurses.
Pay flexibility means that local NHS employers can make their own decisions on the mix of nursing staff on different grades. These localised variations in so-called ‘grade mix’ have in turn led to examples of ‘grade drift’, as some employers upgrade posts to achieve a more competitive pay rate. The NHSPRB has several times noted that these flexibilities are only infrequently used by local NHS employers, and has reviewed options for increasing flexibility or targeted pay. It has not recommended a specific approach but places the emphasis on employers and unions deciding how this can be achieved. In 2017, the NHSPRB stated, ‘Our judgement is that we are approaching the point when the current pay policy will require some modification, and greater flexibility, within the NHS.’
In its 2021 report, the NHSPRB highlighted again its assessment that the current Agenda for Change system requires review and updating to be applied more flexibly, and to reflect changed labour market conditions and increased roles and contributions being made by some nursing and midwifery staff. It urged the governments in the four UK countries, employers and unions ‘to consider whether the Agenda for Change system accurately reflects the relative job weight of the realities, complexities and development trajectories of nursing as a modern graduate profession, best to enable the recruitment, retention and motivation of nurses in the short and medium term’. At the time of finalising this report, several of the trade unions involved in the NHSPRB process have not yet concluded consulting and balloting members on this year’s pay award.
* Much of the available data on staff earnings from NHS Digital refers to nurses and health visitors in the NHS HCHS sector as a combined group, so we largely focus on that group in addition to analysing broader averages of all UK nurses’ earnings based on data from the Office for National Statistics. We do not separately analyse nurses’ earnings in general practice and the independent and voluntary sectors as there is a lack of data in those areas. Further, we do not look at the earnings of registered nurses in the adult social care sector as that sector is dominated by private providers, whereas our analysis focuses on nurses working in the public sector.
† This is based on input from the Department of Health and Social Care, which the authors gratefully acknowledge.
UK nurse pay analysis
This chapter develops a long-term picture of UK nurses’ earnings by presenting analysis of historical trends in registered NHS nurses’ earnings in England and, more widely, of nurses’ earnings in the UK. We discuss the composition of the NHS nursing workforce in England in the context of the Agenda for Change framework. We also analyse Office for National Statistics (ONS) data to place trends in UK nurses’ pay in a broader labour market context, accounting for changes in inflation and changes in the earnings of comparable professional occupations.
The Agenda for Change framework and NHS nurses’ earnings
Under the Agenda for Change framework, NHS nurses, health visitors and other staff groups are classified under a number of pay bands (Band 5 to Band 9 for nurses), each of which has several spine points. Newly registered nurses in England typically start at the first Band 5 spine point (currently set at £24,907 per year) and generally then move up the band, spine point by spine point, until they reach the top of Band 5. In December 2020, close to half (44%) of NHS nurses and health visitors were in Band 5, with nearly another third (32%) being in Band 6 (Figure 2). The remainder were in Band 7 (17%) and Band 8 or Band 9 (6%).
Figure 2: Distribution of NHS nurses and health visitors (FTE) in England across Agenda for Change pay bands, December 2020
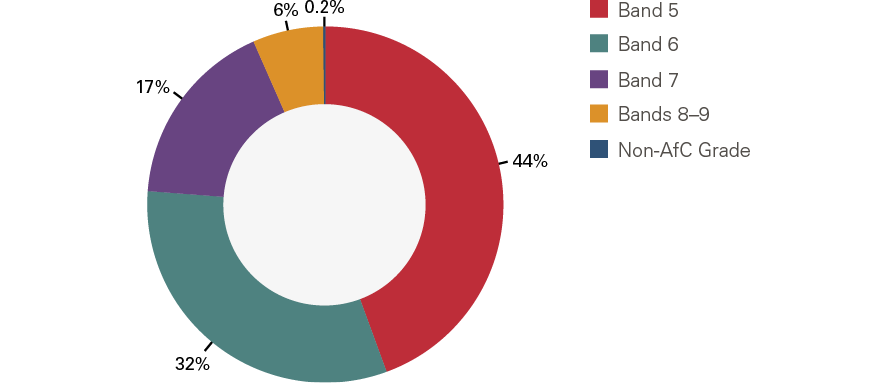
Source: NHS Digital Notes: The data are sourced from NHS Digital’s Electronic Staff Record (ESR) system. See NHS Digital (2020), Nurse and health visitor data pack (https://digital.nhs.uk/data-and-information/supplementary-information/2021/nurse--health-visitor-data-pack-december-2020). Full-time equivalent (FTE) figures are rounded to the nearest whole number. Due to rounding and a small number of Band 2 – Band 4 employees from the data not having been shown (as these do not represent qualified nurses, who start at Band 5), the percentages shown may not sum to 100%.
The earnings of NHS nurses and health visitors comprise basic and non-basic elements. In December 2020, average annual basic earnings per full-time equivalent (FTE) for NHS nurses ranged from around £28,000 for Band 5 to £95,400 for Band 9 (Figure 3). Basic earnings generally account for over 80% of nurses’ overall earnings and over 90% of overall earnings for higher bands. In December 2020, basic FTE pay accounted for 84% of average overall Band 5 nurse earnings; the corresponding figure for Band 9 was 94%.
Non-basic earnings include additional components such as overtime pay, geographic allowances and local payments (eg HCAS) and shift work payments. The relative size of these components varies between different nurses and different pay bands – on average, they comprise a higher proportion of total compensation for younger or more junior nurses (eg in December 2020, non-basic earnings accounted for 16% of overall mean annual earnings of Band 5 nurses and 6% of overall mean annual earnings of Band 9 nurses). Our analysis focuses on basic earnings, for which trend data are more widely available. Due to data constraints, we do not examine non-basic earnings components and ‘total reward’ considerations (pensions and other benefits recorded in Total Reward Statements), although these issues remain relevant to developing a fuller understanding of nurses’ compensation and labour market behaviour. Similarly, the impact on nurses’ labour market participation decisions of non-financial factors such as childcare and other care support and flexible working is outside the scope of our study.
Figure 3: Average annual basic earnings per FTE for NHS nurses and health visitors in England by Agenda for Change pay band, December 2020
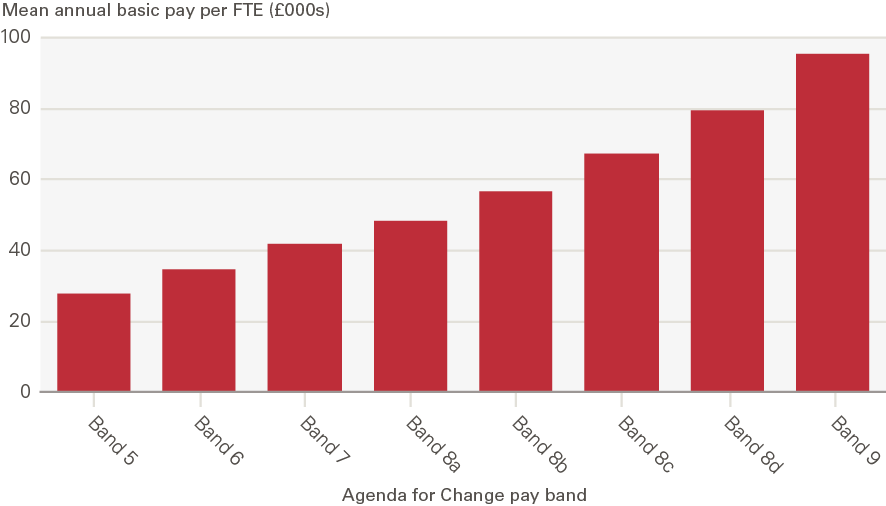
Source: NHS Digital Note: The data are sourced from NHS Digital’s ESR system. See NHS Digital (2020), Nurse and health visitor data pack (https://digital.nhs.uk/data-and-information/supplementary-information/2021/nurse--health-visitor-data-pack-december-2020). The data represent average (mean) annual basic earnings per FTE for nurses and health visitors in the NHS HCHS in England in December 2020. Individual staff earnings vary within each Agenda for Change pay band as each band covers a number of spine points.
As they move up the Agenda for Change band spine points, NHS nurses’ pay increases in line with the national pay scales and any additional individual supplements for non-basic earnings, such as unsocial hours payments. They also benefit from the general staff pay rise agreed by the NHSPRB. After nurses reach the top of their pay band, their earnings increases are limited to the general staff pay rise and individual supplements. With over 40% of nurses and health visitors having been at the top of their pay band in December 2020, this is a hurdle for career and pay progression. Even in the case of nurses who work for the NHS for longer periods of time, pay progression can vary substantially and is often dependent on promotion.
Another aspect of NHS nurses’ earnings that can be assessed is the lifetime returns to nurse education, which looks at the relative return in comparison to alternative career choices. Research undertaken by the Institute for Fiscal Studies using the Longitudinal Education Outcomes dataset, previously noted by the NHSPRB, shows that nurses’ lifetime earnings tend to yield positive returns to nursing education (net of taxes and student loans). Over a lifetime, the earnings of those who study nursing are almost always higher than they would have been had they not gone to university. Relative returns to nursing education earlier in their career are higher for women with low or medium prior attainment (as measured by GCSE scores), as alternative careers for this group tend to be less well paid.
While this points to nursing being a relatively stable career avenue, the analysis underlines concerns around earnings progression: the difference between real median earnings at age 30 and age 40 tends to be low for nurses. 2017/18 data suggest that the median earnings of individuals who had studied nursing were higher than the overall median and above the median for a majority of other subjects 1 year after graduation, but fell below the overall median 10 years after graduation. By contrast, the median earnings of those who had studied medicine and dentistry remained above the median for all other subjects up to 10 years after graduation.
This lack of earnings progression for nurses has long-term implications for NHS nurse retention if the alternative non-NHS career ‘outside options’ for NHS nurses are able to offer better pay and/or greater pay progression. The NHSPRB notes a wider issue for the Agenda for Change system in that ‘earnings in nursing do not keep pace with other graduate earnings over the course of a career, and this raises the question of whether the Agenda for Change system fully reflects the professional demands on nurses and their contribution to the NHS’.
In terms of demographic characteristics, 88% of NHS nurses and health visitors are female and this has not changed significantly across pay bands between 2010 and 2020. The NHS nurse earnings distribution varies by gender, age and ethnicity within pay bands: the NHSPRB has highlighted evidence gaps in the interactions between different drivers of NHS nurses’ earnings, such as gender, ethnicity, age profile and region of residence. Recent research suggests that changes in local living costs (measured through changes in house prices) influence the labour market choices of nurses working in acute NHS trusts. Regional fluctuations in living costs may therefore be linked to changes in nurse labour supply, retention and staff turnover.
In this context, we acknowledge that it can be oversimplistic to analyse long-term trends in ‘average’ NHS nurse pay, as there is considerable variation between individuals and between pay rates within and across Agenda for Change pay bands. In addition, a significant proportion of NHS nurses work on part-time contracts – 36% of NHS HCHS nurse and health visitor contracts were part time in October 2019. This implies that analysis of average annual earnings per person cannot be extrapolated to the lived experiences of individual NHS nurses. But as in most cases, the average offers perhaps the best way to capture changes over time and so we use it to explore historical trends in nurses’ pay.
Trends in NHS nurses’ pay
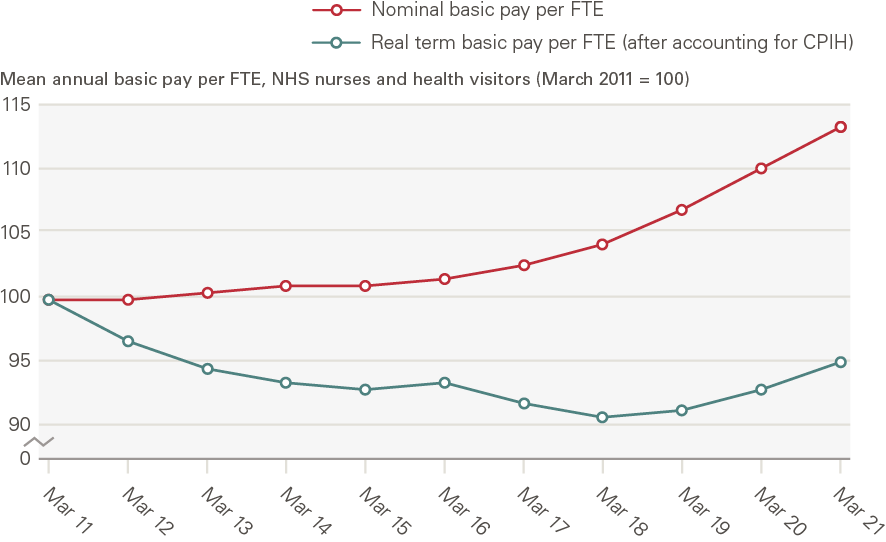
NHS Digital data show that on average, nurses in bands 5 to 9 in the NHS HCHS in England earned a mean of £34,671 per person per year (in nominal terms) in March 2021. Average basic earnings per FTE nurse, perhaps the most consistent yardstick over time, were £34,275 in March 2021, 13% higher than in March 2011 (Figure 4). Average earnings for all professionally qualified clinical staff (which includes HCHS doctors, nurses and health visitors, midwives, ambulance staff and scientific, therapeutic and technical staff) registered a very similar trend across the same period of 2011–2021.
Price inflation offers a basic gauge to measure the extent to which increases in earnings might deliver a better standard of living over time. We therefore compared annual increases in nurses’ earnings with annual consumer price inflation. Between March 2011 and March 2021, average FTE NHS nurses’ basic earnings in England grew by 1.3% a year. In this period, inflation as measured by the Consumer Prices Index (CPI) including owner occupiers’ housing costs (CPIH), the ONS’ lead measure of inflation, increased by an average of 1.7% a year. Using CPIH as a measure, on average, NHS nurses’ earnings fell by 5% in real terms in the 2011–2021 period (Figure 5).
The public sector pay cap between 2010/11 and 2017/18 largely accounts for this real-term decline in NHS nurses’ earnings. Taking December 2017 as a more recent start date for analysis, average NHS nurses’ basic earnings per FTE have increased by more than CPIH growth, due to the Agenda for Change pay deal for 2018–2021 and relatively low annual CPIH inflation during the period. This comparison highlights both that trends across time are subject to different impacts from inflation, and that different start dates can give a very different picture of relative growth or decline of comparative earnings.
Figure 4: Mean annual basic earnings per FTE, NHS HCHS staff in England, nominal and real term (in comparison with CPIH inflation), March 2011 – March 2021
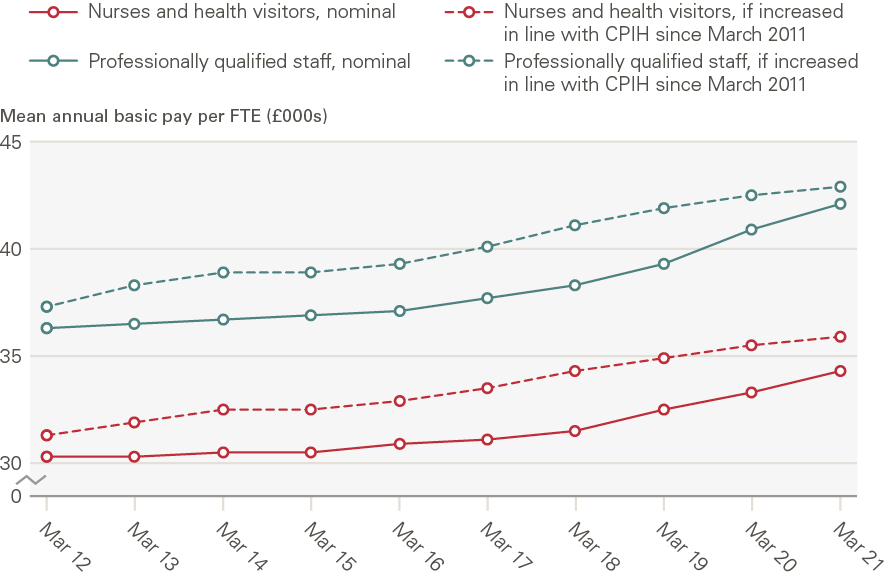
Source: NHS Digital staff earnings data, ONS CPIH data Note: Earnings data are sourced from NHS Digital’s ESR system and CPIH estimates are sourced from ONS data. NHS Digital defines mean annual basic pay per FTE to be the ‘mean amount of basic pay paid per 1 Full-Time Equivalent post in a 12 month period’. Professionally qualified staff include HCHS doctors, nurses and health visitors, midwives, ambulance staff and scientific, therapeutic and technical staff. We use ONS data on the 12-month CPIH for March in each year from 2011 to 2021 to estimate real-terms earnings.
Figure 5: Index of nominal and real-terms mean annual basic earnings per FTE, NHS HCHS nurses and health visitors in England, March 2011 – March 2021
Source: NHS Digital staff earnings data, ONS CPIH data Note: Earnings data are sourced from NHS Digital’s ESR system and CPIH estimates are sourced from ONS data. NHS Digital defines mean annual basic pay per FTE to be the ‘mean amount of basic pay paid per 1 Full-Time Equivalent post in a 12 month period’. We use ONS data on the 12-month CPIH for March in each year from 2011 to 2021 to estimate real-terms earnings.
Insights from ONS data into UK nurses’ pay
Overall long-term trends (1973–2019)
As most NHS Trusts began using the Electronic Staff Record (ESR) system in 2009 and NHS Digital earnings data are derived from the ESR, NHS Digital earnings estimates do not go further back in time. However, an alternative source which can provide longer term trends is the ONS Annual Survey of Hours and Earnings (ASHE) and its predecessor, the New Earnings Survey (NES). This allows us to explore longer term trends in mean gross weekly earnings for nurses and other occupational groups, going back to 1997 and, in the separate cases of full-time female and male employees, to 1973. Unlike the NHS Digital data which only represent nurses working in the NHS HCHS sector, the ONS data cover all nurses in the economy: nurses in the NHS HCHS sector as well as those working in general practice, the private and independent sector and social care. However, the NHS is by far the largest source of employment for nurses in the UK, so an examination of ONS data on nurses’ earnings will largely reflect trends in NHS nurses’ earnings.
Overall, ASHE data show that in absolute terms, average weekly pay across the UK nursing workforce is around the same as the average for all UK employees. It is important to bear in mind, however, that nurses are more likely to work part time than the average employee: 36% of NHS nurse and health visitor contracts were part time in October 2019, while 24% of all employees worked part time in October 2019. This is partly attributable to 9 in 10 NHS nurses being female and female nurses being significantly more likely to work part time: 39% of NHS HCHS contracts for female nurses and health visitors were part time in October 2019 as opposed to only 14% for their male counterparts.
Simply analysing changes in average weekly earnings for the entire nursing workforce over time therefore risks conflating actual shifts in the average earnings trend, compositional changes in the nursing workforce over time (eg changes in the proportion of nurses working on part-time contracts) and changes in the number of hours worked. To focus on actual movements in average earnings trends, given the data limitation we have noted above, we restrict our analysis to female full-time employees (for which ONS time series go back to 1973).
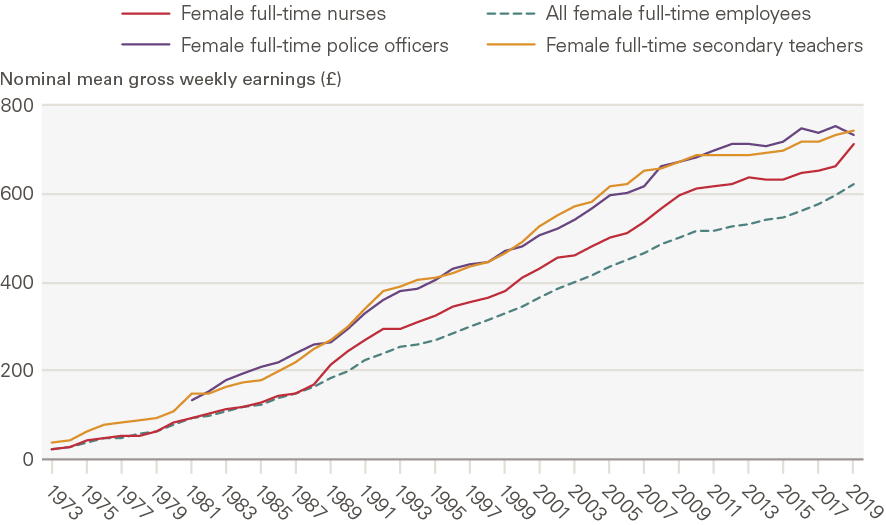
NES/ASHE data suggest that female full-time nurses’ nominal average weekly earnings trailed those of comparable public sector occupations for much of the period 1973–2009 (Figure 6). In more recent years, there has been a convergence and in 2019, the average weekly earnings of female full-time nurses were close to those of female full-time police officers (sergeant level and below) and secondary school teachers. Police officers and teachers are useful public sector points of comparison for nurses, and are covered by Review Bodies, but also have differences that must be kept in mind. Teaching is graduate entry, as is nursing, but does not have the varying shift patterns that many nurses must work. Policing is ‘front-line’ and ‘24/7’ in nature, like nursing, but does not require graduate qualification.
All four UK countries had implemented degree-only nurse education by 2013, but there is little evidence available about what impact this may have had on nurses’ earnings. Analysis of whether the convergence visible in Figure 6 between the earnings of female full-time nurses and their counterparts in teaching, also a degree-entry profession, is partly driven by this policy shift is complicated by the overlap with the 7-year public sector pay cap (2010–2017). But better understanding of the degree effect is important for future workforce planning and calls for further analysis.
Figure 6: Nominal mean gross weekly pay, female full-time nurses and female full-time employees in selected other occupations in the UK, 1973–2019
Source: ONS Annual Survey of Hours and Earnings and New Earnings Survey Note: The data represent female full-time employees only. 2020 data have not been included as they are provisional and may reflect some impacts of the COVID-19 pandemic. Estimates for police officers refer to police officers at sergeant level and below. Time-series data for female full-time police officers are available from 1981 onwards, though 1997 data are missing, so we estimate mean gross weekly pay by taking the average of the values for 1996 and 1998.
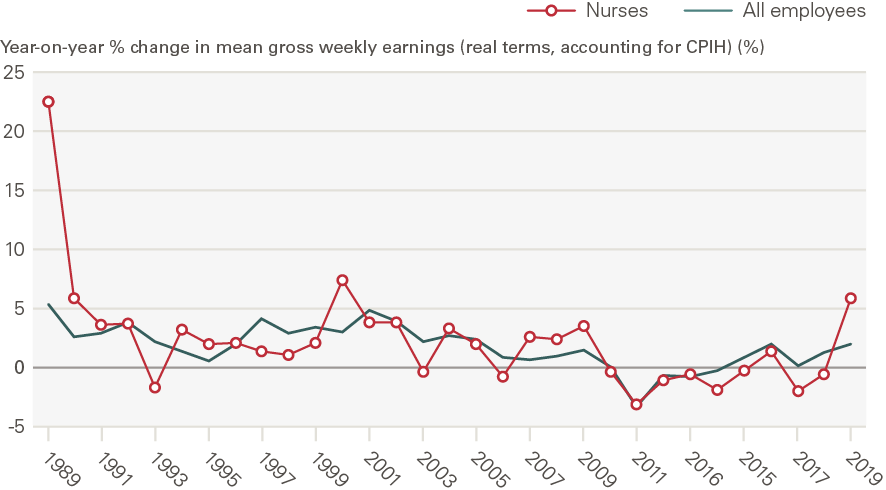
As ONS data on CPIH inflation go back to 1989, we are able to examine how the observed trends in nominal earnings (Figure 7) compare with consumer price inflation from 1989. In the 1988–2009 period, year-on-year growth in female full-time nurses’ nominal mean gross weekly earnings exceeded CPIH inflation in the UK, but the picture was largely reversed with the 2010–2017 public sector pay cap (Figure 7 and Figure 8).
In real terms, female full-time nurses’ gross weekly earnings increased on average by 22% in 1989, as a result of the introduction of clinical grading. As discussed in Chapter 1, the new clinical grading pay structure used job evaluation techniques to link nurses’ pay rates to their roles, skills and responsibilities, rather than merely their job titles. The transition to the new clinical grading structure led to variable changes in the pay of individual nurses, but was on average a relatively large one-off pay increase for NHS nurses. Thereafter, in the last three decades, nurses’ real-terms weekly earnings grew largely in line with the overall female full-time employee average (Table 2), but this growth masks considerable variation (Figure 7), visible for instance in some increase in the period soon after the implementation of Agenda for Change (2006–2009) and a relative reduction during the public sector pay cap period (2010–2017).
Overall, after accounting for CPIH inflation, female full-time nurses’ average gross weekly earnings doubled in real terms between 1988 and 2009, alongside a comparable increase in overall female full-time employees’ average earnings in this period (70%). Thereafter, however, female full-time nurses’ average earnings declined by 1.1% a year during the 2010–2017 period of public sector pay restraint, while overall female full-time employee earnings declined more slowly by 0.3% a year on average. After inflation, female full-time nurses’ mean gross weekly earnings in 2019 were virtually the same as in 2008.
Figure 7: Year-on-year percentage change in mean gross weekly earnings, all female full-time employees and female full-time nurses in the UK, 1988–2019
Source: ONS Annual Survey of Hours and Earnings and New Earnings Survey; ONS CPIH data Note: The data represent female full-time employees only. 1988 is used as a starting year as ONS CPIH data currently go back to January 1989. The all-employee trendline for 2009–2013 overlaps the trendline for nurses in that period and is therefore not visible. 2020 data have not been included as they are provisional and may reflect some impacts of the COVID-19 pandemic.
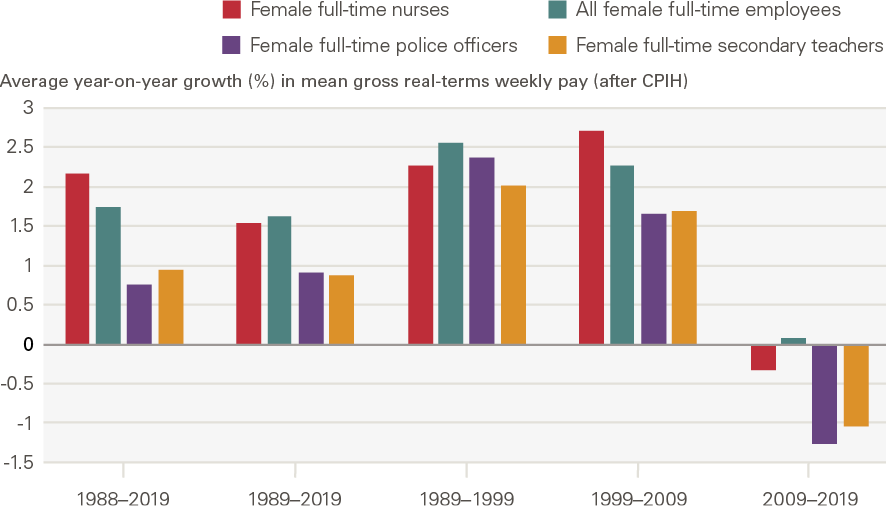
Figure 8: Average annual real-terms growth in mean gross weekly earnings, female full-time nurses and female full-time employees in selected other occupations in the UK, time periods between 1988 and 2019
Source: ONS Annual Survey of Hours and Earnings and New Earnings Survey; ONS CPIH data Note: The data represent female full-time employees only. Compound annual growth rates are calculated to estimate average year-on-year earnings growth over different periods. 1988 is used as a starting year as ONS CPIH data currently go back to January 1989. 2020 data have not been included as they are provisional and may reflect some impacts of the COVID-19 pandemic. Estimates for police officers refer to police officers at sergeant level and below.
One important presentational point for analysis is that the choice of different start dates for analysis can lead to different results. The next subsection explores this further.
The effect of using different start dates
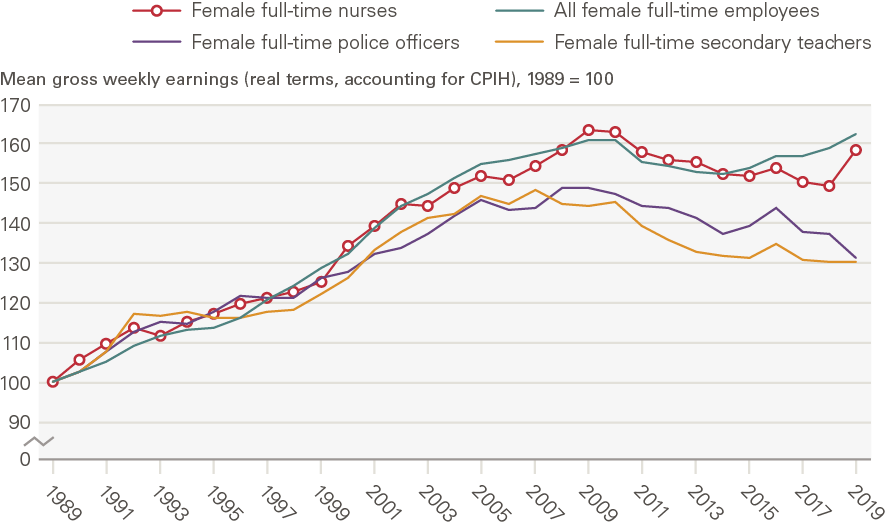
Figure 9 and Figure 10 plot indices of real-terms mean gross weekly earnings (after accounting for CPIH inflation) for female full-time nurses, police officers and secondary teachers, using 1988 and 1989 as alternative start dates. These graphs differ from Figure 6 as they highlight differences in the growth rates of real-terms earnings of nurses and other occupational groups, whereas Figure 6 highlights variations in nominal earnings levels.
Both these indices graphs and Table 2 underline the relevance of considering alternative start dates for the analysis. Figure 9 highlights the substantial ‘one-off’ increase in nurses’ earnings immediately after the introduction of clinical grading in 1988: between 1988 and 2009 nurses’ weekly earnings doubled in real terms, rising by 101% (Table 2). However, if instead we begin with 1989, the year after the one-off clinical grading pay uplift (Figure 10), we find that nurses’ weekly earnings increased by 64% between 1989 and 2009 (Table 2). Similarly, if we consider the 1988–2019 period, we find that nurses’ real-terms average weekly earnings increased by 94%, whereas for the 1989–2019 period the increase was significantly smaller (59%). Moreover, Figure 9’s index shows nurses’ real-terms weekly earnings staying well above the line for all employees through to 2019, whereas Figure 10’s index (starting from 1989 rather than 1988) shows the nurses’ line being much closer to and indeed falling below that for all employees over time up to 2019. Moving the start date even by 1 year can therefore drive very different results.
Table 2: The effect of different start dates: Real-terms growth in mean gross weekly earnings, female full-time nurses and female full-time employees in selected other occupations in the UK, time periods between 1988 and 2019
|
1988–2009 |
1989–2009 |
1988–2019 |
1989–2019 |
|
|
All female full-time employees |
69.5% |
61.0% |
70.9% |
62.3% |
|
Female full-time nurses |
100.5% |
63.7% |
94.0% |
58.4% |
|
Female full-time police officers |
44.3% |
50.0% |
27.0% |
32.1% |
|
Female full-time secondary teachers |
48.4% |
44.6% |
33.6% |
30.2% |
Source: ONS ASHE, ONS CPIH data Note: The data represent female full-time employees only. 1988 is used as a starting year as ONS CPIH data currently go back to January 1989. 2020 data have not been included as they are provisional and may reflect some impacts of the COVID-19 pandemic. Estimates for police officers refer to police officers at sergeant level and below.
Overall, between 1988 and 2019 nurses’ real-terms earnings registered a higher increase compared with the average trend for the comparable public sector occupations of policing and teaching. In the period between 2009 and 2019, following the 2007–2009 financial crisis, female full-time nurses’ average weekly earnings fell by 3.2% in real terms (over 10 years). This was worse than the real-terms average for all female full-time employees, which rose by 0.8% over the same period, but it compares favourably with the corresponding statistics for police officers and secondary school teachers (whose average weekly earnings declined by 12% and 10% in real terms between 2009 and 2019).
To further illustrate the impact of using different start dates, Figure A2 and Figure A3 (Annex 3) plot the same indices as in Figure 9 and Figure 10, using 1999 and 2009 as alternative start dates. Figure A3 highlights the impact of the public sector pay restraint period of 2010–2017. In real terms, nurses’ average weekly earnings steadily declined between 2009 and 2018, only recovering with the implementation of the 3-year Agenda for Change pay deal.
Figure 9: Index of mean gross weekly earnings of female full-time nurses and selected other occupations in the UK in real terms (after accounting for CPIH inflation), 1988–2019 (1988 = 100)
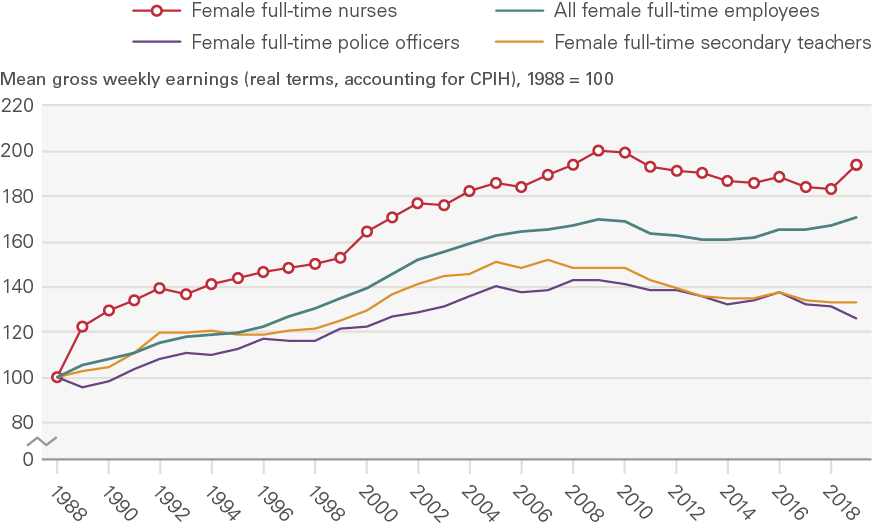
Figure 10: Index of mean gross weekly earnings of female full-time nurses and selected other occupations in the UK in real terms (after accounting for CPIH inflation), 1989–2019 (1989 = 100)
Source: ONS Annual Survey of Hours and Earnings and New Earnings Survey; ONS CPIH data Note: The data represent female full-time employees only. 2020 data have not been included as they are provisional and may reflect some impacts of the COVID-19 pandemic. Estimates for police officers refer to police officers at sergeant level and below. For female full-time police officers, 1997 data are missing, so we estimate mean gross weekly pay by taking the average of the values for 1996 and 1998.
Having considered how the pay determination process for NHS nurses has changed over time and analysed long-term trends in UK nurses’ earnings, it is worth exploring those points in comparable other countries. This is the focus of Chapter 3.
‡ See Annex 2 for a short summary of the wider research on public sector pay determination and references for further reading.
§ For a detailed description of how the Agenda for Change pay scales currently work, see www.nhsemployers.org/articles/2021-pay-and-tcs-advisory-notices
¶ NHS data on staff earnings in the HCHS in England provide average earnings estimates for nurses and health visitors as a combined entity. For simplicity, in this report we refer to these data as NHS nurses’ earnings although they also cover health visitors. The data do not cover midwives.
** We use estimates of mean annual basic pay per FTE, defined by NHS Digital as ‘the mean amount of basic pay paid per 1 Full-Time Equivalent post in a 12-month period’.
†† We use the CPIH to capture inflation as it is the ONS’ lead measure of inflation. Alternative inflation measures include the CPI, which does not account for certain housing costs, and the Retail Price Index (RPI), the use of which has been discouraged by the ONS (see www.ons.gov.uk/economy/inflationandpriceindices/articles/shortcomingsoftheretailpricesindexasameasureofinflation/2018-03-08).
‡‡ To have kept pace with CPIH inflation, average FTE nurse and health visitor basic earnings would have had to increase from £30,231 to £35,820 between March 2011 and March 2021, but in reality they increased to £34,275. Therefore, after accounting for CPIH inflation, NHS nurses and health visitors’ average FTE basic earnings fell by 5% between March 2011 and March 2021 (this is the difference between £34,275 and £35,820 as a proportion of £30,231).
§§ This is because publicly accessible NES data is only available in the form of separate earnings estimates for full-time female and male employees.
¶¶ We focus on female rather than male full-time employees as this report focuses on nurses’ earnings and 88% of NHS nurses are female. For completeness, the corresponding time series for male full-time nurses and selected other occupations is presented in Annex 3 (Figure A1). As the numbers of male nurses in the UK have historically been small, many of the average earnings estimates for male full-time nurses are based on relatively small sample sizes and therefore subject to greater uncertainty, so we do not analyse this time series in depth.
International nurse pay comparisons
In this chapter we cover two main objectives. First, we compare UK nurses’ current earnings with those of comparator OECD countries. This gives some insight into the variations in earnings of nurses in different countries which are broadly comparable, and in some cases are in competition for international recruitment. We then give brief summaries of how nurses’ pay is determined in comparator countries, and report on any recent changes in processes. Our aim is to provide insights into some of the different pay models that exist, to highlight these alternative approaches and flag any scope for UK application. This is particularly relevant as the UK has historically relied heavily on international recruitment for nurse staffing, and may increasingly have to compete with other OECD countries for a nursing labour supply pool which may not be growing quickly enough to meet overall demand in the coming years.
International earnings comparisons
We use OECD data dating back to 2000 on the average (mean) gross annual incomes of full-time registered nurses working in hospitals or in all health care facilities in some countries. The OECD time series begin in different years for different countries, depending on data availability. As NHS Digital is the source for data on UK nurses’ earnings, the UK time series begins in 2009 (when NHS trusts started using the ESR, as noted in Chapter 2). However, to provide a more complete picture on international comparisons, we use data going back to 2000 or as far back as possible for other countries. Our analysis compares the UK with the overall OECD average (from countries which provide data, with some gaps resulting from a lack of data provision in some years) and in particular with four key comparator countries: Australia, Canada, New Zealand and the United States. Annex 4 provides detail on the OECD data underpinning the numbers for the UK and these key comparator countries.
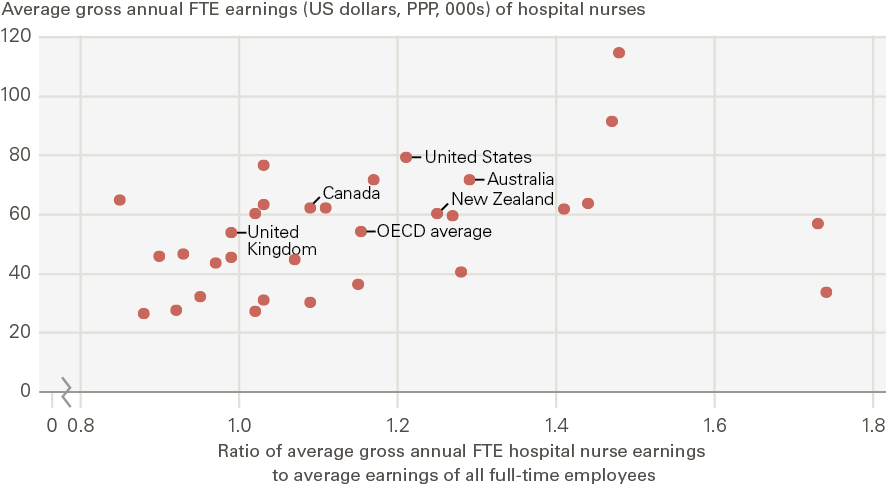
We start by considering hospital nurse earnings converted in US dollars and adjusted for purchasing power parity (PPP), which provides a measure of the standard of living in each country. By this PPP measure, UK nurses’ earnings have been lower than in comparator countries in recent years (Figure 11). In the decade to 2019, the UK has fallen below the OECD average, which in part reflects the impact of the 7-year UK public sector pay cap.
Figure 11: Hospital nurses’ (full time) average gross annual FTE earnings in selected OECD countries, 2000–2019*
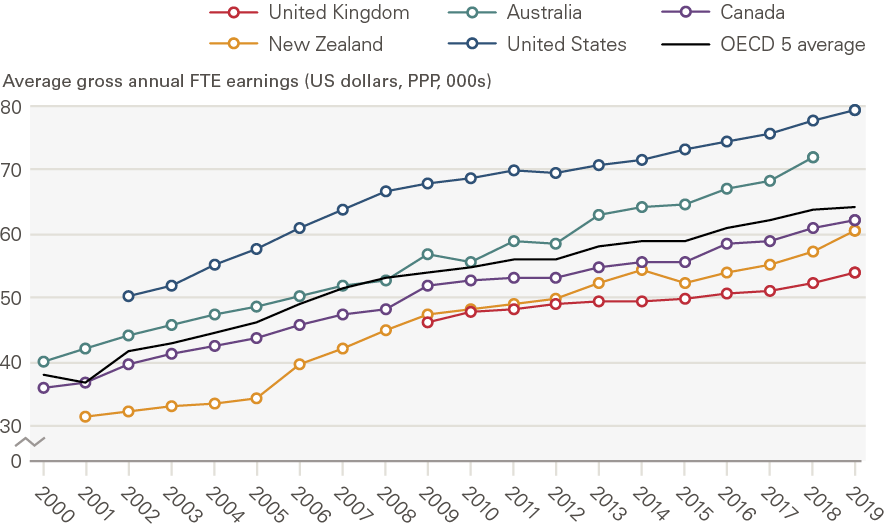
Source: OECD Health Statistics: Remuneration of health professionals (https://stats.oecd.org/) Note: These estimates are based on OECD data on hospital nurses’ remuneration. Remuneration is defined as average gross annual income, including social security contributions and income taxes payable by the employee. It should normally include all extra formal payments, such as bonuses and payments for night shifts and overtime, but it does not account for differences in hours worked and pension payments and so cannot be used to compare total reward packages across countries. National statistics have been converted to USD and adjusted for PPP to provide an indication of the relative economic wellbeing of nurses compared with their counterparts in other countries. The data are for salaried hospital nurses, a category that covers certified/registered nurses actively practising in public hospitals and also in other health care facilities in some countries. In some countries, it includes all qualified nurses, while in others (eg in Canada and the United States) it only includes registered nurses and not licensed practical or vocational nurses. 2020 data were not available at the time of writing.*The ‘OECD 5’ refers to the UK, Australia, Canada, New Zealand and the United States. UK data apply to England only and begin in 2009 as they are sourced from NHS Digital’s ESR system, which NHS trusts started using in 2009. For further detail on the data, see Annex 4.
In addition to absolute earnings, the OECD data include estimates of the ratio of mean hospital nurse earnings to the mean wage of all workers in the economy. This is a measure of the relative earnings of hospital nurses compared to other workers.
UK hospital nurses’ earnings relative to average full-time employee earnings have been the lowest of the selected OECD comparators across the period since 2009 and have generally been below the OECD average (Figure 12). Notwithstanding some limitations (see Annex 1), the data highlight the impact of the public sector pay cap: average hospital nurse earnings in the UK exceeded average full-time employee earnings in 2009, but had fallen just below the latter by 2019 (the ratio fell from 1.08 to 0.99 in this period). UK hospital nurses’ earnings trail behind comparable economies both in absolute and relative terms (Figure 13).
Figure 12: Hospital nurses’ average FTE earnings relative to average full-time employee earnings, selected OECD countries, 2000–2019*
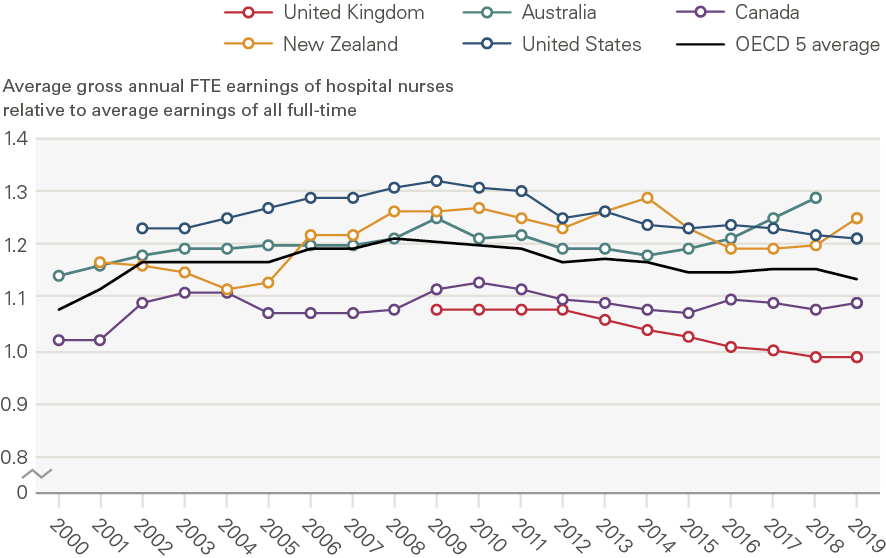
Source: OECD Health Statistics: Remuneration of health professionals (https://stats.oecd.org/) Note: These estimates are based on OECD data on hospital nurses’ remuneration. Remuneration is defined as average gross annual income, including social security contributions and income taxes payable by the employee. It should normally include all extra formal payments, such as bonuses and payments for night shifts and overtime, but it does not account for differences in hours worked and pension payments and so cannot be used to compare total reward packages across countries. The income of nurses is compared to the average wage of full-time employees in all sectors in the country. The data are for salaried hospital nurses, a category that covers certified/registered nurses actively practising in public hospitals and also in other health care facilities in some countries. In some countries, it includes all qualified nurses, while in others (eg in Canada and the United States) it only includes registered nurses and not licensed practical or vocational nurses. 2020 data have not been included as they are provisional and may reflect some impacts of the COVID-19 pandemic.*The ‘OECD 5’ refers to the UK, Australia, Canada, New Zealand and the United States. UK data apply to England only and begin in 2009 as they are sourced from NHS Digital’s ESR system, which NHS trusts started using in 2009. For further detail on the data, see Annex 4.
Figure 13: Hospital nurses’ average gross annual FTE earnings in absolute terms (US dollars, PPP adjusted) and relative to the average wage of all full-time employees, OECD countries, 2019 or latest year*
Source: OECD Health Statistics: Remuneration of health professionals (https://stats.oecd.org/) Note: These estimates are based on OECD data on hospital nurses’ remuneration. Remuneration is defined as average gross annual income, including social security contributions and income taxes payable by the employee. It should normally include all extra formal payments, such as bonuses and payments for night shifts and overtime, but it does not account for differences in hours worked and pension payments and so cannot be used to compare total reward packages across countries. National statistics have been converted to USD and adjusted for PPP to provide an indication of the relative economic wellbeing of nurses compared with their counterparts in other countries. The income of nurses is compared to the average wage of full-time employees in all sectors in the country. The data are for salaried hospital nurses, a category that covers certified/registered nurses actively practising in public hospitals and also in other health care facilities in some countries. In some countries, it includes all qualified nurses, while in others (eg in Canada and the United States) it only includes registered nurses and not licensed practical or vocational nurses. 2020 data have not been included as they are provisional and may reflect some impacts of the COVID-19 pandemic.*The OECD average is the average for 31 OECD countries for which data were available (excluding Denmark where no data beyond 2013 were available and excluding Turkey where no data on the ratio of average hospital nurse earnings to the average earnings of all full-time employees were available). UK data apply to England only and are sourced from NHS Digital’s ESR system. For further detail on the data, see Annex 4.
Nurse pay determination processes in other OECD countries
In this section we describe the nurse pay determination process in selected OECD comparator countries, in order to give some insights into the different models in use. We examined three areas of comparison in particular:
- The focus of the overall approach – local or national.
- What additional inputs were used to address difficult to fill posts, regions and specialties.
- How these countries have responded to the COVID-19 pandemic, in terms of any specific additional pay supplements, recognition or other changes.
The countries we selected for comparison are Australia, Canada, Germany, New Zealand, Sweden and the United States. These countries have a broadly similar expenditure on health (with the exception of the United States, which is much higher) and include several Anglophone countries with a similar approach to nurse education, regulation and recognition of trade unions for collective bargaining. Further, several of these countries are direct competitors in recruiting nurses from other countries, notably India and the Philippines.
Table 3 highlights these aspects of the pay determination model in each country, as well as in the UK for comparison purposes.
Most of these countries have a national or regional framework for nurses’ pay determination, underpinned by union recognition and collective bargaining. The majority of the countries also have options for targeted additional incentives for posts that are particularly difficult to fill, and most have offered some form of COVID-19 ‘bonus’ earnings award for nurses, in recognition of the front-line role played by nurses during the pandemic.
Table 3: Summary of nurse pay determination processes based on information from national nurses’ associations, selected OECD countries
Sources: Authors, based on information provided by the Australian Nursing and Midwifery Federation, Canadian Nurses Association, Deutscher Berufsverband für Pflegeberufe (The German Nurses Association), New Zealand Nurses Organisation, Vardforbundet (the Swedish Association of Health Professionals), American Nurses Association.
Table 3 highlights that there are a variety of pay determination approaches in place. Most countries use a system based on trade union recognition and collective bargaining. The main locus of bargaining varies – national, state/province or local – in part reflecting the health system structure, ownership model and sources of funding. Sweden places emphasis on individual employment contracts, but this approach is shaped by an overall framework that is embedded in trade union recognition and local agreements. Most of the other countries use an underpinning frame of national or regional/federal collective bargaining. The exception is the United States, where local pay determination prevails, often without collective bargaining and recognised trade unions.
In comparison to these other countries, the UK stands out for having established an independent review process as a central element in the pay determination process for nurses working in the public sector.
All of these other countries also report a range of pay related responses to addressing hard-to-fill posts, which include higher pay rates, pay supplements, one-off sign on or lump sum bonuses, loan forgiveness, relocation allowances, educational allowances, return for service agreements, relocation assistance, retention bonuses and housing allowances. The variable nurse labour market challenges that exist in the UK – in part because of cost of living variations and in part because certain specialties are regarded as less attractive – are also evident in these other countries.
The effects of COVID-19 on the wellbeing and workload of the nursing workforce in these countries have varied, reflecting overall variability in the prevalence of the pandemic. However, all the countries have had to redeploy the workforce in preparation for surge capacity, and most have experienced very significant increases in surge-related workload, stress and reported burnout. All with the exception of England and New Zealand report having made some type of additional COVID-19 related payment to nursing staff. The level of payment has varied but has usually been presented as a specific COVID-19 related bonus or supplement in recognition of the additional stress and workload. At the time of completing this report, the nursing union in New Zealand is in dispute with employers and government. It had begun a scheduled programme of industrial action in support of a pay claim in July 2021, but this was suspended because of the need to respond to the impact of the pandemic.
*** The OECD average covers as many countries as possible depending on data availability in any given year between 2000 and 2019 (eg the 2013 average includes Denmark as data for Denmark were available, but in 2014 data were not available for Denmark and so the 2014 average excludes Denmark).
††† The OECD average covers as many countries as possible depending on data availability in any given year between 2000 and 2019 (eg the 2013 average includes Denmark as data for Denmark were available, but in 2014 data were not available for Denmark and so the 2014 average excludes Denmark).
Discussion
Key trends in UK nurses’ earnings
Our analysis of long-term trends in UK nurses’ earnings highlights several key points.
From a long-term perspective, over the last three decades (1988–2019), female full-time nurses’ real-terms weekly earnings grew by a very similar factor to overall female full-time employee earnings. However, the year-on-year earnings trend for nurses diverged considerably from the overall pattern of all employee earnings, driven primarily by two key positive developments – the introduction of clinical grading (1988) and Agenda for Change (introduced in 2004) – and by negative impacts, notably the public sector pay restraint period of 2010–2017.
Prior to the pay restraint period, female full-time nurses’ average gross weekly earnings doubled in real terms between 1988 and 2009. However, the austerity period led to a real-terms earnings decrease for nurses that changed only recently with the 3-year Agenda for Change pay deal in 2018. In real terms, female full-time nurses’ mean gross weekly earnings in 2019 were virtually the same as in 2008.
Our analysis also underscores the impact of using different start dates for long-term earnings trends. We use the introduction of clinical grading in 1988 to illustrate this: between 1988 and 2019, nurses’ average weekly earnings increased by 94% in real terms, but between 1989 and 2019 the increase was only 59%. The substantial ‘one-off’ increase of clinical grading has a marked effect.
Further, while nurses on average earn slightly less than police officers and secondary teachers in nominal terms, nurses’ earnings have been more resilient to consumer price inflation relative to the other groups in the last three decades. This includes the period of public sector pay caps (2010–2017), when all three workforces registered declines in average real-terms earnings.
NHS nurses’ earnings data in England are only available over a shorter timeframe, since NHS trusts began using the ESR in 2009. On average, NHS nurses’ basic earnings in England grew by 1.3% a year over the period from March 2011 to March 2021. However, when CPIH inflation (averaging 1.7%) is taken into account, NHS nurses’ average earnings fell by 5% in real terms in this period. The need to assess the likely impact of inflation on pay has recently become more prominent, with inflation forecast to exceed 3% in 2021/22, set against the NHSPRB’s 2021 recommendation of a 3% pay increase.
When we look further afield, OECD data show that on average, hospital nurses’ earnings in the UK are less than the corresponding averages in key comparator economies such as Australia, Canada, New Zealand and the United States, both in absolute terms (when comparing remuneration levels across countries adjusted for cost of living in each country) and relative terms (when comparing the remuneration of nurses to the average wage of all workers in each country). Adjusted for PPP, hospital nurse remuneration in the UK fell below the OECD average in the decade to 2019. The ratio of average hospital nurse remuneration to the average full-time employee wage in the UK has also trailed the OECD average since 2009. In a context where the UK has historically relied heavily on international nurse recruitment and is likely to compete with other OECD countries for nurse labour supply, this international analysis is highly relevant.
Policy implications
Our long-term assessment of nurses’ earnings and the review body approach, taking a perspective of almost 40 years, have highlighted that the review body process has maintained nurses’ real-terms earnings since its establishment in 1983. However, this has largely been achieved through two pay boosts driven by structural and contractual changes, in 1988 and in 2004. Since 2004, there has not been an equally significant pay uplift, and the public sector pay cap in the 7-year period concluding in 2017 has had a negative impact on nurses’ earnings.
The ability to reach independent recommendations gives the review body the scope to take a considered and evidence-based view of an issue that is always contested and sometimes controversial, and which has significant public funding implications. This ‘independence’ was most recently highlighted in this year’s report, where the NHSPRB made a recommendation for a 3% pay uplift after the government in England had argued strongly for a 1% increase.
However independence is only a reality if recommendations are then accepted by the governments in the four UK countries, and implemented and funded in full. In the past, this has sometimes been compromised or undermined by government action. In the period between the NHSPRB’s first report in 1984 and 2007, there were at least 7 years in which its recommendations were delayed, More recently and more notably, the NHSPRB was marginalised during the 7-year public sector pay cap period, which, as we highlight, led to a significant drop in nurses’ earnings compared to overall average earnings.
The review body approach also gives scope for significant, planned and agreed changes to be made in the overall pay determination process and structure, as we highlight above, most notably in 1988 and 2004, but not since. The NHSPRB is now flagging that it has identified the need for further reform of the system. In this year’s report it has called on the governments in the four UK countries, employers and unions to examine and update several aspects of the current pay determination process, including:
- better integration of pay as part of the overall approach to workforce planning and development
- to focus more on the ‘total reward’ (to take account of flexible working, support for continuing professional development, etc)
- to examine the use of the High-Cost Area Supplements.
The current pay system was emerging from the 7-year pay cap at a time of significant nurse shortages, and the nurse labour market is now further impacted by COVID-19, which has highlighted the contribution of nurses and channelled widespread public support for the profession, but raises concerns about workload, retention, motivation and longer term supply.
In addition, from a pay perspective, there are now increases in National Insurance contributions to consider, as well as a rise in inflation. This context has sharpened the focus on what nurses get paid, to assess if the system can respond to these critical shortages and staffing concerns or requires a new structural change. The points made by the NHSPRB in this year’s report highlight that it has identified the time is right for review and update.
The broader policy emphasis in the NHS is now focused on how to ‘build back better’, and part of that broader focus must be to assess if the NHS national pay system also remains fit for purpose. As we highlight, it is more than 15 years since the last significant change was implemented and gave nurses’ pay a substantial boost.
None of the national stakeholders contacted for this report, prior to publication of the NHSPRB report in July 2021, or in more recent follow-up meetings, were at the time in favour of immediate large-scale or fundamental reform, because of funding constraints and capacity challenges at the time of the pandemic. There was, however, widespread recognition of scope to optimise and update the pay progression mechanisms to better recognise staff with high levels of skills, experience and advanced practice contributions. The most common issue stakeholders highlighted for examination was the need for improved pay rates and career pathways for experienced, enhanced and advanced practice nurses. Many thought the current pay structure was too compressed, with insufficient overall progression before reaching the top of pay bands. A major potential retention mechanism they identified was introducing scope for experienced and advanced practice nurses to progress to higher pay rates. The NHSPRB has now clearly signalled that this issue should be examined.
A second main area of NHS focus, and identified by some stakeholders, is on the extent to which pay supplements should be targeted at hard-to-fill posts or high cost of living areas. The NHSPRB has in earlier reports raised the need to look in more detail at targeted pay supplements, and this examination should now be taken forward in more detail. It should consider High-Cost Area Supplements, but look beyond pay supplements to take account of other possible incentives such as loan repayments, ‘return of service’ models, and subsidised or fully funded additional education. The international comparisons in our report highlighted that a range of different policy responses are in use in other countries aimed at increasing recruitment to, and retention in, underserved areas and hard to fill specialties.
A third point is that there is an ongoing requirement to assess the extent to which the pay system established under Agenda for Change meets one of its initial objectives, to support pay equity. Nursing is a workforce where nine out of ten professionals are recorded as female. Assuring pay equity requires a more complete approach to monitoring of pay and earnings distribution by gender and ethnicity than is currently available in the public domain; it requires more complete data, and requires support and action at employer level and nationally.
A fourth area for flexibility considerations is pensions. While pension provision has not been a focus of this report, it is a major part of the overall employment package and it must be recognised that the NHS nursing workforce is ageing, with a high proportion of nurses nearing retirement age. Further flexibilities in pension contribution and payments could encourage more nurses to remain at work or return to work. The point made in this year’s NHSPRB about fuller consideration of the total reward package is important in this regard. A flexible approach to pension access and provision should be an integral element of the package.
A fifth challenge is the issue of emerging divergence in NHS pay processes across the four UK countries. The UK has one overarching regulatory body for nurses, and commonalities in undergraduate education for nurses, which underpin a ‘shared’ labour market to the extent that nurses trained in one UK country have largely unfettered mobility and ability to practise across all four countries. However, each UK country develops its own NHS system and priorities and its own NHS funding, workforce planning and development approaches, and has its own broader policy and political cycle. Trying to accommodate these four country differences within one pay system has already created tension and it may be time to look to a more explicit approach to a devolved, four UK country, pay process. The Scottish government has already withdrawn from the NHSPRB remit in this 2020/21 cycle, but has maintained engagement with the DDRB.
Examples from Australia and Canada highlight that it is feasible to have a different pay determination cycle and processes at the state or province level in federal countries; in some cases with local ‘top-up’ bargaining, or with a national ‘safety net’ of minimum rates. While the UK is not a federated country, there could be scope to look at more country level flexibility within an overall ‘looser’ UK pay determination model, if there is an identified need to maintain enabling elements of commonality across the whole UK labour market for nurses.
The full impact of the COVID-19 pandemic on UK nurse labour markets has not yet been fully seen and will have continuing implications for nurses’ pay. There appear to be some positive side effects, most notably the (possibly short-term) increase in applications to nurse education. There have also been more negative direct and marked effects on the health and wellbeing of those who have been in the front line of the NHS response, which may significantly reduce retention rates, increase early retirement and long-term absence. NHS England stands out from the other UK countries, and from nearly all the other OECD countries examined for this report, in not paying some type of pandemic-related pay supplement, or bonus to nurses, in recognition of their central and critical contribution. This exception has been widely reported as a disincentive to nurses and as being out of kilter with the public mood.
The COVID-19 pandemic has accelerated the need to review the current approach to NHS nurses’ pay determination. The UK government has announced that it intends to run a full public sector pay round for 2021/22. This must be followed through with full acceptance and funding for review body recommendations. This can then be a start towards ensuring that the nurses’ pay process and subsequent earnings levels are at the front and centre of rebuilding and funding, not an adjunct standalone exercise or afterthought.
References
- NHS England. We are the NHS: People Plan for 2020/21 – action for us all. NHS England; 2020 (www.england.nhs.uk/publication/we-are-the-nhs-people-plan-for-2020-21-action-for-us-all/).
- NHS Digital. NHS workforce statistics. NHS Digital; 2021 (https://digital.nhs.uk/data-and-information/publications/statistical/nhs-workforce-statistics).
- NHS Digital. NHS Hospital and Community Health Services: Nurses & Health Visitors by gender and contract, in NHS Trusts and CCGs, October 2019, headcount and percentage. NHS Digital; 2020 (https://digital.nhs.uk/data-and-information/supplementary-information/2020/nurses-and-health-visitors).
- NHS Employers. NHS terms and conditions of service handbook. NHS Employers; 2021 (www.nhsemployers.org/tchandbook).
- NHS Pay Review Body. About us [webpage]. NHSPRB (www.gov.uk/government/organisations/nhs-pay-review-body/about).
- NHS Pay Review Body. NHS Pay Review Body Thirtieth Report: 2017. NHSPRB; 2017 (https://assets.publishing.service.gov.uk/government/uploads/system/uploads/attachment_data/file/602312/58551_NHS_PRB_Print.pdf).
- NHS Pay Review Body. NHS Pay Review Body Thirty-Fourth Report: 2021. NHSPRB; 2021 (www.gov.uk/government/publications/nhs-pay-review-body-thirty-fourth-report-2021).
- Stephenson J. Why are pay and conditions different for non NHS nurses? Nursing Standard. 9 July 2021 (https://rcni.com/nursing-standard/newsroom/analysis/why-are-pay-and-conditions-different-non-nhs-nurses-175651).
- Institute for Government. NHS pay. Institute for Government; 2021 (www.instituteforgovernment.org.uk/explainers/nhs-pay).
- Institute for Government. NHS pay. Institute for Government; 2021 (www.instituteforgovernment.org.uk/explainers/nhs-pay).
- Department of Health and Social Care. The Department of Health and Social Care’s written evidence to the NHS Pay Review Body (NHSPRB) for the 2021/22 Pay Round. Department of Health and Social Care; 2021 (https://assets.publishing.service.gov.uk/government/uploads/system/uploads/attachment_data/file/966702/DHSC-written-evidence-to-the-NHSPRB-2021-to-2022.pdf).
- Swaffield L. The clinical grading structure. Nursing Standard. 1988; 2(28): 28–29. doi: 10.7748/ns.2.28.28.s57 (https://journals.rcni.com/nursing-standard/the-clinical-grading-structure-ns.2.28.28.s57).
- NursingNotes. Chancellor promises NHS workers another pay rise in 2022. 27 October 2021 (https://nursingnotes.co.uk/news/politics/chancellor-promises-nhs-workers-another-pay-rise-in-2022/#.YYKnimDP02w).
- Buchan J. Flexibility or Fragmentation? Trends and prospects in nurses pay. Kings Fund Institute Briefing Paper 13. The King’s Fund; 1992.
- Buchan J. Health sector reform and human resources: lessons from the United Kingdom. Health Policy and Planning. 2000; 15(3): 319–325.
- Grimshaw D. The problem with pay flexibility: changing pay practices in the UK health sector. International Journal of Human Resource Management. 2000; 11(5): 943–966.
- For example, Berry M. Southend hospital trust staff vote to ditch Agenda for Change pay system. Personnel Today. 4 July 2006 (www.personneltoday.com/hr/southend-hospital-trust-staff-vote-to-ditch-agenda-for-change-pay-system/).
- Parrish C. Most foundation trusts opting to stay with ‘robust’ Agenda for Change. Nursing Standard. 2006; 20(44): 6 (http://journals.rcni.com/doi/pdfplus/10.7748/ns.20.44.6.s4).
- Corby S, White G, Millward L, Meerabeau E, Druker J. Finding a cure? Pay in England’s national health service. Employee Relations. 2003; 25(5): 504–516.
- Buchan J, Evans D. Realising the Benefits? Implementing Agenda for Change. The King’s Fund; 2007.
- National Audit Office. NHS Pay Modernisation in England: Agenda for Change. NAO; 2009 (www.nao.org.uk/publications/0809/nhs_pay_modernisation.aspx).
- NHS Pay Review Body. NHS Pay Review Body Thirtieth Report: 2017. Para 19.Cm 9440. NHSPRB; 2017 (www.gov.uk/government/uploads/system/uploads/attachment_data/file/602309/58551_NHS_PRB_Accessible.pdf).
- NHS Pay Review Body. NHS Pay Review Body Thirtieth Report: 2017. Para 5.Cm 9440. NHSPRB; 2017 (www.gov.uk/government/uploads/system/uploads/attachment_data/file/602309/58551_NHS_PRB_Accessible.pdf).
- NHS Pay Review Body. NHS Pay Review Body Thirtieth Report: 2017. Para 6.Cm 9440. NHSPRB; 2017 (www.gov.uk/government/uploads/system/uploads/attachment_data/file/602309/58551_NHS_PRB_Accessible.pdf).
- NHS Employers. Annual pay scales 2020/21. NHS Employers; 2020 (www.nhsemployers.org/pay-pensions-and-reward/nhs-terms-and-conditions-of-service---agenda-for-change/pay-scales/annual).
- NHS. Welcome to your Total Reward Statement. (www.totalrewardstatements.nhs.uk/).
- NHS Digital. Nurse & health visitor data pack, December 2020. NHS Digital; 2020 (https://digital.nhs.uk/data-and-information/supplementary-information/2021/nurse--health-visitor-data-pack-december-2020).
- Department of Health and Social Care. The Department of Health and Social Care’s written evidence to the NHS Pay Review Body (NHSPRB) for the 2021/22 Pay Round. Department of Health and Social Care; 2021 (https://assets.publishing.service.gov.uk/government/uploads/system/uploads/attachment_data/file/966702/DHSC-written-evidence-to-the-NHSPRB-2021-to-2022.pdf).
- NHS Pay Review Body. NHS Pay Review Body Thirty-Third Report: 2020. NHSPRB; 2020 (www.gov.uk/government/publications/national-health-service-pay-review-body-33rd-report-2020).
- Britton J, Dearden L, van der Erve L, Waltmann B. The impact of undergraduate degrees on lifetime earnings. Institute for Fiscal Studies; 2020 (www.ifs.org.uk/publications/14729).
- Belfield C, Britton J, Buscha F, Dearden L, Dickson M, van der Erve L, et al. The impact of undergraduate degrees on early-career earnings. Institute for Fiscal Studies; 2018 (https://ifs.org.uk/publications/13731).
- Propper C, Stockton I, Stoye G. Cost of living and the impact on nursing labour outcomes in NHS acute trusts. Institute for Fiscal Studies; 2021 (www.ifs.org.uk/publications/15313).
- NHS Digital. NHS Staff Earnings Estimates, December 2020, Provisional Statistics. NHS Digital; 2021 (https://digital.nhs.uk/data-and-information/publications/statistical/nhs-staff-earnings-estimates/december-2020-provisional-statistics).
- Office for National Statistics. Consumer price inflation, UK: March 2021. ONS; 2021 (www.ons.gov.uk/economy/inflationandpriceindices/bulletins/consumerpriceinflation/march2021).
- Stephenson J. Why are pay and conditions different for non NHS nurses? Nursing Standard. 9 July 2021 (https://rcni.com/nursing-standard/newsroom/analysis/why-are-pay-and-conditions-different-non-nhs-nurses-175651).
- Office for National Statistics. EMP01 SA: Full-time, part-time and temporary workers (seasonally adjusted), 20 April 2021. ONS; 2021 (www.ons.gov.uk/employmentandlabourmarket/peopleinwork/employmentandemployeetypes/datasets/fulltimeparttimeandtemporaryworkersseasonallyadjustedemp01sa).
- Worth J, Lynch S, Hillary J, Rennie C, Andrade J. Teacher Workforce Dynamics in England. NFER; 2018 (www.nfer.ac.uk/media/3111/teacher_workforce_dynamics_in_england_final_report.pdf).
- The Queen’s Nursing Institute. Report on District Nurse Education in England, Wales and Northern Ireland 2012/13. The Queen’s Nursing Institute; 2013 (www.qni.org.uk/wp-content/uploads/2017/02/DN_Education_Report_2012-13.pdf).
- Office for National Statistics. Consumer price inflation time series (MM23). ONS (www.ons.gov.uk/economy/inflationandpriceindices/timeseries/l55o/mm23).
- Buchan J, Ball J, Shembavnekar N, Charlesworth A. Building the NHS nursing workforce in England. The Health Foundation; 2020 (https://doi.org/10.37829/HF-2020-RC14).
- New Zealand Nurses Organisation. Nurses withdraw strike action after lockdown declared. 17 August 2021. www.nzno.org.nz/about_us/media_releases/artmid/4731/articleid/5315/nurses-withdraw-strike-action-after-lockdown-declared
- Burger C. Do Unions benefit or harm healthcare and nursing industries? Registered Nursing.org, 18 June 2021. (www.registerednursing.org/articles/do-unions-benefit-harm-healthcare-nursing/).
- Longyear R, Boxer R, Johnson K. Considering Concerns Related to Demand for Travel ICU Nurses Across Covid-19 Hotspots. Nejm Catalyst Innovations in Care Delivery; 2020 (www.semanticscholar.org/paper/Considering-Concerns-Related-to-Demand-for-Travel-Longyear-Boxer/fb42853244c88a3fabd245716d49baacd4054eaf).
- New Zealand Nurses Organisation. Nurses withdraw strike action after lockdown declared. 17 August 2021 (www.nzno.org.nz/about_us/media_releases/artmid/4731/articleid/5315/nurses-withdraw-strike-action-after-lockdown-declared).
- Bank of England. The inflation outlook – speech by Michael Saunders. 15 July 2021 (www.bankofengland.co.uk/speech/2021/july/michael-saunders-speech-the-inflation-outlook).
- HM Revenue and Customs (2021). Policy paper: Health and Social Care Levy. 9 September 2021. www.gov.uk/government/publications/health-and-social-care-levy/health-and-social-care-levy
- Disney R, Gosling A. Does it pay to work in the public sector? Fiscal Studies. 1998; 19(4): 347–374 (https://doi.org/10.1111/j.1475-5890.1998.tb00291.x).
- Bryson A, Forth J. Wage Growth in Pay Review Body Occupations. Office of Manpower Economics; 2017 (https://openaccess.city.ac.uk/id/eprint/20743/).
- Matos M. Valuing Different Workplace Rewards. A report for the Office of Manpower Economics. Economic Insight; 2017 (www.economic-insight.com/2017/10/31/report-valuing-different-workplace-rewards/).
- PwC. Research into modern pay systems. Office of Manpower Economics; 2016 (https://assets.publishing.service.gov.uk/government/uploads/system/uploads/attachment_data/file/567543/PWC_Research_into_modern_pay_systems_Nov_2016..pdf).
- Dolton P, Hantzsche A, Kara A. The dynamics of public and private sector wages, pay settlements and employment. National Institute of Economic and Social Research; 2020 (www.niesr.ac.uk/publications/dynamics-public-and-private-sector-wages-pay-settlements-and-employment).
- NHS Pay Review Body. Market-Facing Pay: How Agenda for Change pay can be made more appropriate to local labour markets. NHSPRB; 2012 (https://assets.publishing.service.gov.uk/government/uploads/system/uploads/attachment_data/file/253926/22159_Cm_8501_AccessibleLR_1_.pdf).
- Crawford R, Disney R, Emmerson C. The short run elasticity of National Health Service nurses’ labour supply in Great Britain. Institute for Fiscal Studies; 2015 (https://ifs.org.uk/publications/7566).
Annexes
Annex 1 – Summary of data sources used in this report
|
Data source |
Chapter used in |
Overview and limitations |
|
NHS Digital: NHS Staff Earnings Estimates https://digital.nhs.uk/data-and-information/publications/statistical/nhs-staff-earnings-estimates |
2: UK nurse pay analysis |
NHS Digital provide quarterly data on the average earnings of staff in the NHS Hospital and Community Health Service (HCHS) sector in England. Limitations of the quarterly data:
|
|
Office for National Statistics: Annual Survey of Hours and Earnings (ASHE), 1997 onwards Office for National Statistics: New Earnings Survey (NES), 1973–1996 |
2: UK nurse pay analysis |
The Office for National Statistics provides estimates of the mean gross weekly earnings of UK employees over time, in recent years based on the Standard Occupational Classification 2010 (SOC, 2010).
|
|
Organisation for Economic Co-operation and Development (OECD) Health Statistics: Remuneration of health professionals |
3: International nurse pay comparisons |
The OECD provides data on hospital nurses’ remuneration in OECD countries over time. Remuneration is defined as average gross annual income, including social security contributions and income taxes payable by the employee. Limitations:
|
Annex 2 – Brief summary of research on public sector pay in the UK
The debate on public sector pay determination and earnings differentials between the public and private sectors is an old one. Disney and Gosling (1998) provide a snapshot of how earnings distributions differed between the public and private sectors in the UK in the 1980s and 1990s. Bryson and Forth (2017) provide a comprehensive summary of how earnings growth in occupations covered by the pay review bodies (PRBs) compares with comparable other occupations in the economy. Their findings suggest that in the 2005–2015 period, PRB occupations were somewhat insulated from a real-terms earnings decline across the economy. However, there were differences in earnings growth outcomes across PRB occupations, even in cases where the same PRB was responsible. While nurses covered by the NHSPRB registered better earnings growth than those not covered by the NHSPRB, the differential was largely found to be due to differences in occupational workforce composition (such as tenure and age profile variation). On the other hand, PRB nursing auxiliaries enjoyed better earnings growth than their non-PRB counterparts even after accounting for such compositional differences.
In terms of benchmarking public sector pay growth, there are several alternatives:
- A comprehensive review commissioned by the Office of Manpower Economics (Economic Insight, 2017) noted that there is considerable sectoral variation in the findings of studies looking into the relative value of different workplace rewards. With UK studies tending to focus on doctors and dentists more often than on other health care staff, there is little evidence regarding how different forms of remuneration affect health care workers.
- As we highlight in Chapter 2, research undertaken by the Institute for Fiscal Studies (2018) has emphasised the relevance of accounting for educational attainment levels.
- Further, research commissioned by the Office of Manpower Economics on modern pay systems in the private and not-for-profit sectors (PwC, 2016) offers useful insights, with individual job rates, broad banding and narrow banding all found to be quite common. Other research finds evidence of a persistent long-term relationship between public and private sector earnings, with public sector earnings tending to move in line with wage setting in the private sector. At the same time, wage increases in the public sector go hand in hand with significant employment inflows.
- Another point to consider is regional or local pay variation – the NHSPRB undertook a review of ‘market-facing pay’ in 2012, setting out guidelines that might help to tailor the Agenda for Change framework in line with local labour market characteristics. Research by the Institute for Fiscal Studies in 2015 showed that the wage elasticity of nurse labour supply is likely to be higher in labour markets offering a wider and better array of employment alternatives (such as London).
There remain gaps in our understanding of how different variables affect nurse labour supply, both directly and in interaction with each other. The REAL Centre is undertaking work to develop a nurse supply model that should provide more insights into the drivers of nurse supply in England by the end of this year.
Annex 3 – Additional data on mean gross weekly earnings of nurses and selected other occupational groups
Figure A1: Nominal mean gross weekly pay, male full-time nurses and male full-time employees in selected other occupations in the UK, 1973–2019
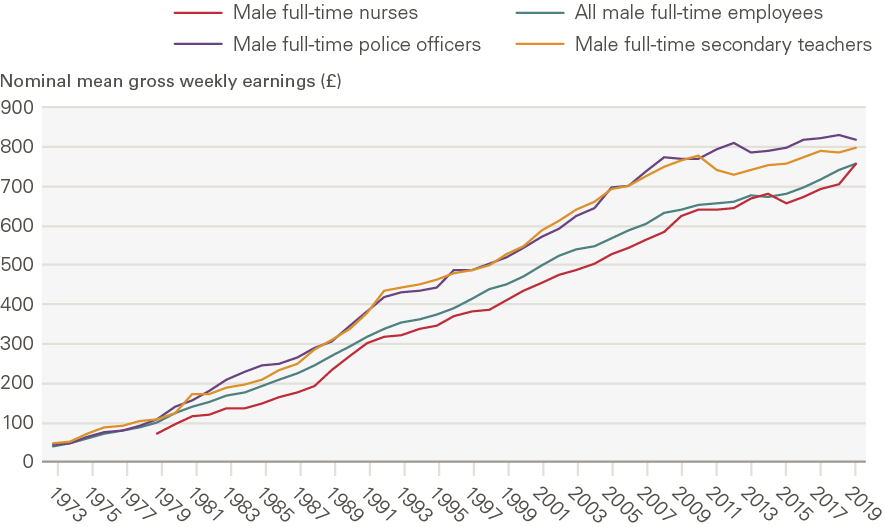
Source: ONS Annual Survey of Hours and Earnings and New Earnings Survey Note: The data represent male full-time employees only. 2020 data have not been included as they are provisional and may reflect some impacts of the COVID-19 pandemic. Time-series data for male full-time nurses are available from 1979 onwards. The numbers of male nurses in the UK have historically been small, as a result of which many of the average earnings estimates for male full-time nurses are based on relatively small sample sizes and therefore subject to greater uncertainty, thus we do not analyse this time series in depth.
Figure A2: Index of mean gross weekly earnings of female full-time nurses and selected other occupations in the UK in real terms (after accounting for CPIH inflation), 1999–2019 (1999 = 100)
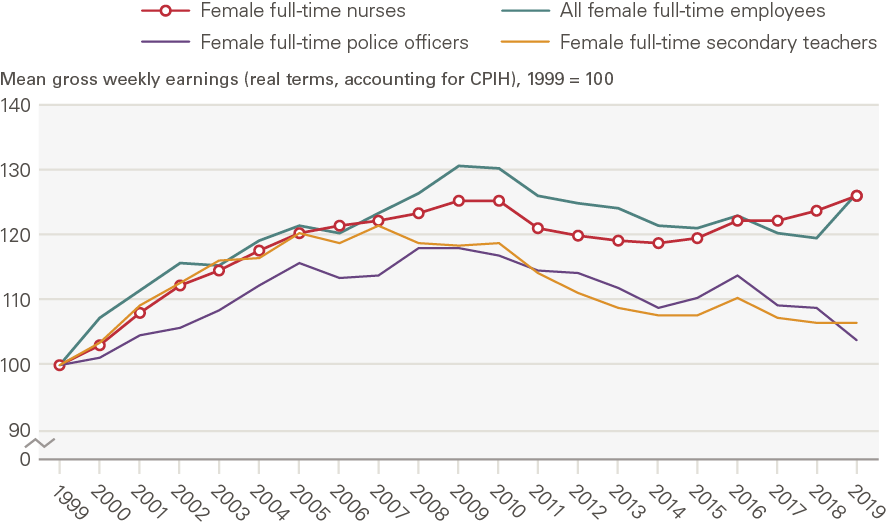
Figure A3: Index of mean gross weekly earnings of female full-time nurses and selected other occupations in the UK in real terms (after accounting for CPIH inflation), 2009–2019 (2009 = 100)
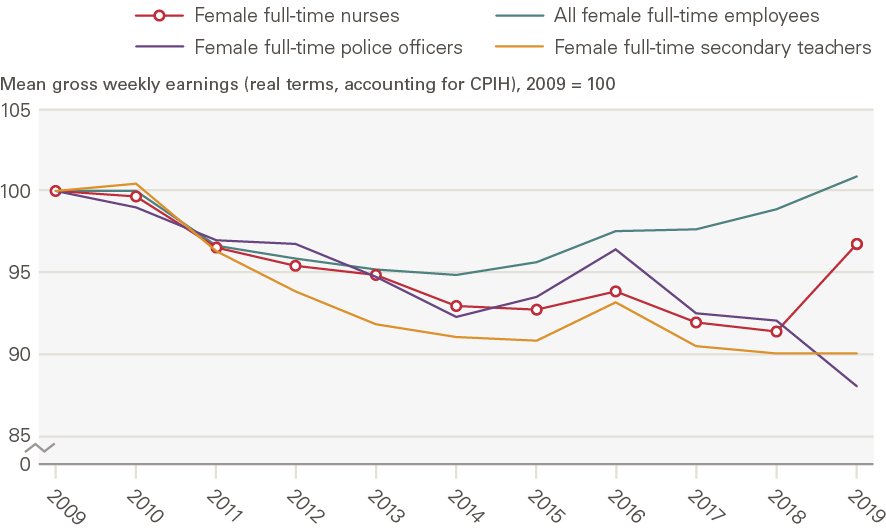
Source: ONS Annual Survey of Hours and Earnings and New Earnings Survey; ONS CPIH data Note: The data represent female full-time employees only. 2020 data have not been included as they are provisional and may reflect some impacts of the COVID-19 pandemic. Estimates for police officers refer to police officers at sergeant level and below.
Annex 4 – Summary of OECD data on hospital nurses’ earnings in selected OECD countries
|
Country |
Data sources |
Methodology |
|
Australia |
2018 onwards: Australian Institute of Health and Welfare (AIHW). Hospital resources tables. www.aihw.gov.au/reports-data/myhospitals/content/data-downloads. 2014–2017: Australian Institute of Health and Welfare. Hospital resources: Australian hospital statistics. Canberra: AIHW (and previous issues). Also at www.aihw.gov.au. 2000–2013: Australian Institute of Health and Welfare. Australian hospital statistics. Canberra: AIHW (and previous issues). Also at www.aihw.gov.au. |
|
|
Canada |
Statistics Canada, Labour Force Survey |
|
|
New Zealand |
District Health Board (DHB) audited financial templates |
|
|
United Kingdom |
NHS Digital – Electronic Staff Record data (coverage: England only) |
|
|
United States |
US Bureau of Labour Statistics, Occupation Employment Statistics (OES) survey. Coverage: Nationally representative sample of the US civilian non-institutionalised population. |
|
‡‡‡ In some instances, these limitations can be addressed by sending supplementary information requests to NHS Digital.
§§§ These limitations may be addressed by accessing the underlying survey microdata for the ASHE (1997 onwards) and the NES (1973–1996). However, these microdata are not publicly accessible as they are classified as sensitive and controlled data.
¶¶¶ For a more detailed description of this nurse supply model, see www.health.org.uk/what-we-do/real-centre/nurse-supply-model