Acknowledgements
The authors would like to thank the many colleagues who have informed and supported this work. We are grateful to our peer reviewers, and to primary care experts and leaders whose insights and reviews have improved this report. Special thanks to Health Foundation colleagues Sean Agass, Caroline Fraser, Nihar Shembavnekar, Pete Stilwell and Jennifer Dixon for their contributions and comments on earlier drafts of the paper.
We would also like to thank colleagues at the Health Services Management Centre Knowledge and Evidence Service at the University of Birmingham for their support with our literature searches.
Errors or omissions remain the responsibility of the authors alone.
When referencing this publication please use the following URL: https://doi.org/10.37829/HF-2022-P09
Key points
- The ‘inverse care law’ was first defined by the GP Julian Tudor Hart 50 years ago, to describe how – perversely – people who most need health care are least likely to receive it. The inverse care law persists in the NHS today. GP practices in more deprived areas of England are relatively underfunded, under-doctored, and perform less well on a range of quality indicators compared with practices in wealthier areas.
- Past governments have used a mix of approaches to try to make the provision of primary care in England fairer – including changes to GP funding, contracts, buildings, staffing, and other areas. In this report, we analyse national policies to reduce inequities in the supply of GP services in England since 1990, and evidence on their impact.
- A variety of policies have attempted to boost the number of GPs in deprived areas, such as central controls on GP distribution or financial incentives for GPs. Some appear to have had positive effects. But policy measures in other areas, such as GP funding, have been more limited. Evidence suggests that the formula underpinning general practice funding in England does not adequately adjust for the greater care need associated with deprivation.
- Policy development has not been linear. In the late 1990s and 2000s, Labour governments introduced several policies to try to improve general practice in deprived areas, as part of a wider strategy to reduce health inequalities. Evidence on their effect is limited, but these policies likely contributed to more equitable distribution of GPs. In contrast, efforts to tackle the inverse care law in general practice since 2010 have been more limited.
- Overall, policy efforts to reduce inequities in the provision of GP services over the past 30 years have not been enough to overcome them. Policies have often been small in comparison with the scale of the problem – swimming against a strong tide of other factors shaping inequities. Improvements in the distribution of GPs in the late 2000s now appear to have reversed: analysis of data on GP numbers in England from 2015 to 2020 suggest that inequities in the distribution of GPs are growing.
- General practice in England is under major strain. GP consultation numbers are now higher than before the pandemic but the number of permanent, fully qualified GPs has fallen since 2015. Current policies on general practice risk widening existing inequities.
- National policymakers can do more to address these problems in general practice. An independent review of general practice funding allocations should be established and its recommendations implemented. Government should also consider stronger central coordination and oversight of GP distribution in England, as part of a new comprehensive workforce strategy for general practice. New integrated care boards should be required to develop plans to reduce inequities in the provision of high-quality GP services.
- Tackling the inverse care law in general practice aligns with the government’s ‘levelling up’ agenda, and must become a core objective of national policy. Without deliberate policy action, inequities in the availability of high-quality general practice in England are likely to continue growing, holding back efforts to level up the country.
Introduction
50 years ago, the British GP Julian Tudor Hart first described the ‘inverse care law’ in a paper in the Lancet. The law states: ‘The availability of good medical care tends to vary inversely with the need for it in the population served.’ In other words, people who most need health care are least likely to receive it.
Over several decades, policymakers have used a mix of approaches to try to address the inverse care law in the NHS – for example, by boosting staff numbers or increasing funding in more deprived areas. Despite this, the inverse care law persists in the NHS today, as it does in health care systems around the world. The picture is complex and varies between different kinds of health care services and over time. Overall, people from more deprived areas tend to have greater health care needs and – as a result – consume more NHS services. But after accounting for differences in people’s health care needs, evidence suggests that people facing more social disadvantage also face worse access, quality, and experience of some types of NHS services, such as preventive care and specialist treatment.,,,,
Recent data suggest that the inverse care law also persists in general practice. GP practices in more deprived areas of England are currently relatively underfunded, under-doctored, and perform less well on a range of quality indicators compared with practices in wealthier areas., Health inequalities in England are vast and growing, – and people living in the most deprived areas have been hit hardest by the COVID-19 pandemic. General practice is the foundation of the NHS and is well placed to tackle health inequalities, but failure to provide general practice according to people’s needs will likely widen disparities further.
The government has committed to ‘levelling up’ the country as it recovers from the pandemic. It has also promised 6,000 additional GPs and 50 million more appointments in general practice per year. General practice is delivering record numbers of appointments, but the number of fully qualified, permanent GPs has fallen since 2015., Meantime, general practice is expected to play a central role in the NHS’s new structure, – including by expanding access to services and developing more integrated models of care. Yet current policies on general practice in England risk exacerbating inequities because they are not designed with the inverse care law in mind., For example, if the extra 6,000 GPs promised by government work in wealthier areas, inequities in access to care will widen.
In this report, we analyse national policies on the inverse care law in general practice in England and set out recommendations for making the availability of high-quality general practice fairer in the future. In the first part, we summarise the problem – describing recent evidence on differences in the provision of GP services between more and less deprived areas of England. In the second, we assess past attempts to address the problem – reviewing national policies to reduce inequities in the supply of general practice services in England since 1990, and evidence on their impact. In the final part, we discuss the implications of our analysis and set out policy recommendations for addressing the inverse care law in general practice.
Approach and methods
We analysed policies focused on tackling the inverse care law in general practice in England since 1990. We used Tudor Hart’s definition of the inverse care law (see Introduction), and focused on differences in health care needs and services related to social disadvantage (for example, differences between richer and poorer areas). We were interested in differences in general practice in relative terms – accounting for differences in health care needs related to social disadvantage – rather than just in absolute terms (such as raw numbers of GPs). We focus mainly on differences between more and less deprived areas – often measured using the index of multiple deprivation (IMD), which combines measures related to income, education, employment, health, crime, barriers to housing and services, and living environments.
Throughout the paper, we use the word ‘inequity’ to describe unfair differences between areas or population groups – for example, differences in GP numbers between richer and poorer areas that do not adequately reflect differences in health care needs. We use the term ‘inequality’ to more generally describe the uneven distribution of health or health services, and try to reflect the terms used by government when describing policies introduced.
Broadly speaking, the inverse care law is made up of three components: the ‘need’ for health care in the population (for example, the prevalence of long-term conditions); the ‘availability’ or supply of health care (for example, numbers of GPs); and how ‘good’ that care is – in other words, its quality. These components interact, and inequalities between social groups can be found in all three areas (see section on need for general practice for more details and examples). Our analysis focused on the ‘supply’ side of the inverse care law, including policies related to the quality of general practice services, their quantity, and distribution. This is because inequalities in health care needs – the other side of the inverse care law – are influenced by a complex system of social, economic, environmental, and other factors.
A mix of policies affect the supply of general practice services. Some policies affect supply indirectly. For example, the number of GPs working in a particular area is likely shaped by policies on economic development, transportation, education, and other factors that influence how attractive an area is as a place to live. Other policies affect the supply of GP services more directly. For example, decisions about the distribution of NHS funding determine the resources available for primary care in different regions of England. And some policies explicitly aim to reduce inequities in the supply of general practice. Examples include incentivising GPs to train in under-doctored areas or building new GP surgeries in more deprived areas.
In this report, we focus on national policies that explicitly aim to reduce inequities in the supply of general practice services in England. This includes universal policies that try to account for differences in need based on social circumstances, and targeted policies focused on increasing resources for disadvantaged groups. Universal policies that did not explicitly aim to reduce inequities – even if they affected them – are excluded from our analysis. Box 1 provides more detail on the structure and context of general practice services in England.
Methods
We used a combination of data and methods. To identify policies addressing the inverse care law in general practice, we analysed government policy documents, reviews of policy developments, and consulted relevant experts. We developed a database of national policies since 1990, summarising their aims, components and mechanisms to achieve impact. To identify evidence on the impact and implementation of these and other policies, we searched relevant bibliographic databases of published literature and government archives. Appendix 1 outlines our search strategy in Medline, along with more information on the literature search and study selection. Data on the impact of relevant policies were limited, and in the report we synthesise evidence by domain – including policies on reducing inequities in general practice through changes in funding, workforce, premises, contracts, or commissioning.
Limitations
Our analysis has several limitations. First, we focused only on policies that explicitly aimed to reduce inequities in the supply of general practice services, such as central controls on GP distribution. This enabled us to identify a small set of interventions that directly focused on tackling the inverse care law. But it means that we did not focus on how policies with broader aims – for example, changes to pay-for-performance schemes for GPs – affected equity in general practice. As a result, we did not cover all policies that shape how high-quality care is distributed. We also focused on national policy changes rather than local programmes.
Second, data on the detail and implementation of policy were limited. Unclear terminology in some policy papers – for example, terms such as ‘inner-city’ or ‘under-served’ – can also make it difficult to understand which population groups were targeted by initiatives.
Third, our analysis was limited by the quantity and quality of evidence. Our literature searches identified some relevant evidence related to key policies. But many policies that we identified in our analysis were not evaluated or their evaluations were weak. This means that evidence about the effects of national policy on general practice in different contexts is limited.
Finally, our analysis focused primarily on general practice – for example, the distribution of the number of GPs between areas of England – rather than primary care as a whole. This means that some relevant policy changes in other areas of primary care that affect quality in general practice, such as the development of new job roles, are not fully covered by our analysis.
Box 1: General practice services in England
General practice is where most health needs are identified and treated – it has a key role in keeping people healthy and out of hospital. General practice refers to a range of primary care services provided to a registered list of patients, for example through direct consultation or referral to specialists. GPs hold NHS contracts to deliver services, and NHS England and clinical commissioning groups (CCGs) are currently responsible for commissioning primary care.
Staff, practices and patients
- In November 2021, there were 36,000 full-time equivalent GPs (including trainees and locums) and just over 100,000 other full-time equivalent practice staff.
- Most practices are run by two or more staff as partners with a share in the business (a minority are run single-handedly). 47% of all GPs worked as partners and 27% worked as salaried employees of a practice in November 2021.
- The average number of patients per practice rose from 7,100 to 8,900 between 2014/15 and 2020/21 – the number of practices fell from 8,000 to 6,800.
Funding
- Spending on GP services represented 7.1% of total NHS spending in 2018/19.
- General practices receive funding through a range of different streams. Some funding for primary care – to cover development costs and money for locally defined services – comes from the broader NHS funding allocations for local areas.
- Around 50% of a practice’s income comes through a global sum payment to deliver its core contracted services. This is paid for every registered patient, weighted using the global sum allocation formula (also known as Carr-Hill).
- Practices receive other smaller payments, such as premises payments, payments for local enhanced services and quality and outcomes framework (QoF) payments.
- QoF payments are awarded to incentivise care improvements for specific activities or outcomes. Over 95% of practices participate in the voluntary incentive scheme. QoF payments typically account for less than 10% of practice income.
Contracting
- As independent contractors, GPs must hold a contract to run NHS-commissioned practices. These specify the area or people GPs are expected to care for, the services they provide, and the funding they receive. There are three contract types.
- The national General Medical Services (GMS) contract is negotiated annually between NHS England and the BMA, and was held by 69% of practices in 2020/21.
- Personal Medical Services (PMS) contracts are locally negotiated between commissioners and providers and were held by 27% of practices in 2020/21.
- Alternative Provider Medical Services (APMS) contracts are also locally negotiated but open to a wider range of providers (such as independent sector organisations) – they were held by less than 3% of practices in 2020/21.
Source: NHS Digital;,, the Health Foundation; Institute for Government; The King’s Fund.
The inverse care law in general practice
Differences in access and quality of general practice are complex and vary over time., In this section, we summarise recent evidence on differences in general practice services related to social disadvantage in England. We focus on the three components of the inverse care law: care need, supply, and quality.
Need
Need for health care varies within the population and is shaped by a range of factors. These include social and economic conditions, race and ethnicity, commercial influences, access to health care, and more.,,, Estimates vary, but most studies suggest that wider social, economic, and other factors play a greater role in shaping health than health care.,
The distribution of health in the population is socially patterned. People who live in more deprived areas are more likely to be exposed to things that contribute to poor health (such as low income or poor housing), and are less likely to be exposed to things that can keep people healthy (such as high-quality employment and housing). There is a 12-year gap in healthy life expectancy between the richest and poorest areas of England.
These factors translate into greater health care needs in more deprived areas. The prevalence of multimorbidity, for instance, is higher in more deprived areas, and multimorbidity is strongly associated with health care utilisation.,,
They also mean greater use of general practice services. General practice consultation rates are significantly higher in more deprived areas. Analysis of data from 2013/14 found that patients living in the most deprived fifth of areas consulted 17% more often than those in the least deprived fifth. And recent analysis of data from the Clinical Practice Research Datalink shows that in 2020, patients living in the wealthiest 10% of areas had an average of four consultations per year, compared with five in the poorest 10%. Patients with multiple health conditions in deprived areas also receive less time per GP consultation.
Accurately assessing ‘need’ for general practice is difficult. Some health care needs are unmet (if people do not access care), and others only partially met (if care is limited). Measures that describe use of services – such as consultation rates or appointment numbers – are themselves affected by many factors, including patient behaviour and the availability of services. Evidence suggests that people from poorer backgrounds tend to consume fewer preventive services than wealthier patients, and present to health care providers at later stages of disease progression. People living in deprived areas may lack awareness of some services, fear being blamed by health care staff, or face financial barriers to accessing care.
Supply
Health care supply describes the quantity of medical services available to meet health care needs. In general practice, this includes the number and type of staff, the location, size and how modern GP surgeries are, and the funding available to pay for services. The supply of GP services in England has varied over time.,, The supply of general practice in England is currently inversely correlated with population need.
Funding
GP practices in more socioeconomically deprived areas receive similar funding per registered patient to those serving less deprived areas. But after adjusting for the increased workload associated with greater health needs for people in poorer areas, GP surgeries in deprived areas are worse off. Analysis of data from between 2015/16 and 2018/19 shows that practices serving more deprived areas received around 7% less funding per need-adjusted patient than those in the most affluent areas (Figure 1). This trend has been consistent since 2015 and there is no sign of inequities in funding narrowing.
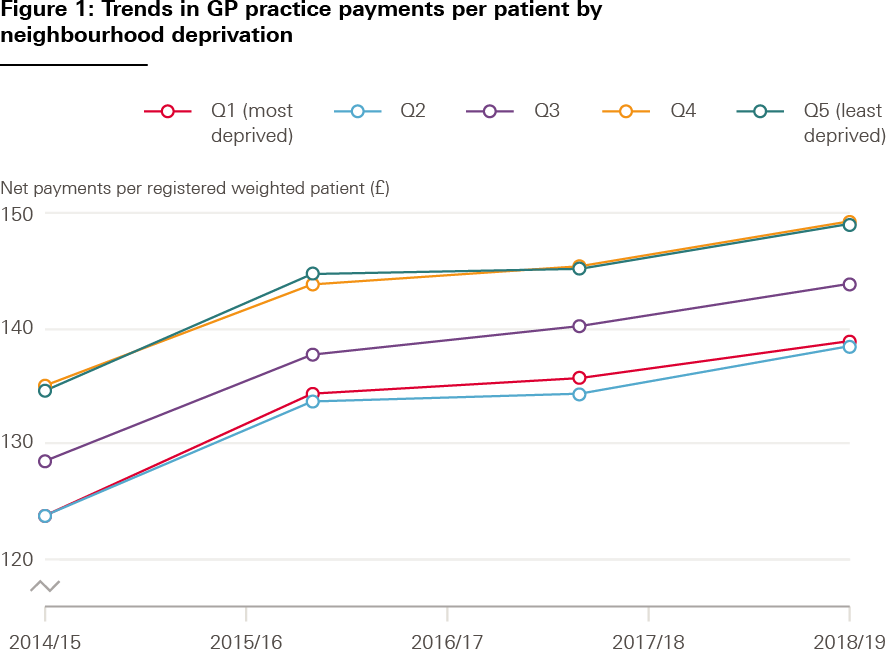
Source: Data are from NHS Digital, ONS, and MHCLG quintiles aggregated from LSOA 2011 neighbourhoods
Workforce
More deprived areas in England currently have fewer GPs per patient than less deprived areas. After accounting for differences in need, a GP working in a practice serving the most deprived patients in 2019 was, on average, responsible for almost 10% more patients than a GP in the most affluent areas. Inequities in GP supply widened between 2015 and 2020. By 2020, there were 1.4 fewer full-time equivalent GPs per 10,000 patients in the most deprived areas compared with the most affluent areas.
This has not always been the case. Between 2004/05 and 2013/14, the number of GPs working in more deprived areas rose. Previous analyses – examining periods before 2015 – had primarily found a ‘disproportionate care law’ in relation to deprivation and GP supply: there were more GPs in areas of high deprivation, but not relative to population need.
The skill mix in general practice has also changed over time, with other primary care staff, such as pharmacists, delivering care. While there are currently fewer GPs, total direct patient care staff, and paramedics per 10,000 patients in more deprived areas, there are more physician associates and pharmacists. In a reverse of the trend seen for GPs, practices in more deprived areas tend to have more nurses, which may imply that nurses are being substituted for doctors in these areas.
The demands made on GPs working in deprived areas are different to those working in more affluent areas – for instance, because of the complexity of patients’ needs. GP turnover – the proportion of staff who leave a practice in a given time period – is also higher in areas of high deprivation. This could affect quality in different ways. High turnover may undermine continuity of care, affect recruitment and retention of GPs, and negatively impact on the ability to deliver care., High GP turnover can also bring additional costs.
Quality
The ability of health care services to meet people’s needs depends on their quality – not just their quantity. There is no single definition of quality in general practice.,,, But a range of indicators and frameworks are used to measure quality of general practice in the NHS. They include Care Quality Commission (CQC) ratings, quality and outcomes framework (QoF) scores, GP patient satisfaction surveys, and indicators related to specific conditions.
QoF was introduced in 2004. At first, practices in more affluent areas of England had higher QoF scores than practices in more deprived areas, but this gap in performance narrowed between 2004 and 2007., By 2011, Dixon et al concluded that differences in performance between practices in deprived and affluent areas had ‘all but disappeared’. But analysis of data from 2015 to 2019 found that practices in the most deprived areas averaged the lowest number of QoF points, and those in the most affluent areas scored the highest. Higher QoF scores translate to larger average payments.
The CQC has been inspecting general practices in England since 2014. Most practices are rated as ‘good’, but analysis of the first complete round of inspections showed that practices in more deprived areas were more likely to receive lower ratings of ‘inadequate’ or ‘requires improvement’. GP patient survey results from 2021 show that people from the most deprived areas were more likely to report a poor overall experience and were less likely to report that their needs had been met. This pattern persists over recent years. Between 2015 and 2021, practices serving the most deprived areas received the lowest overall patient satisfaction scores, while practices in the most affluent areas received the highest (Figure 2).
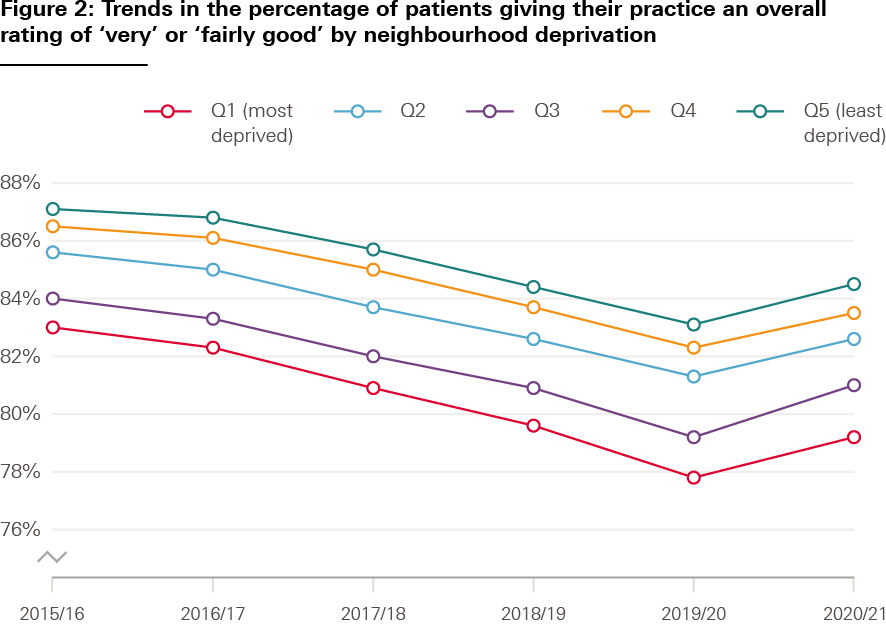
Source: NHS, GP Patient Survey and MHCLG, English indices of deprivation based on LSOA 2011 neighbourhoods
Policies to improve general practice in deprived areas since 1990
Over the past three decades, governments and NHS agencies in England have tried various approaches to tackle the inverse care law in general practice. Table 1 provides a summary of key national policies to improve the provision of general practice in deprived areas between 1990 and 2021. These policies overlap and interrelate, and are shaped by wider policy on NHS reform and spending. For example, policies aiming to reduce inequities in access to general practice in the 2000s were implemented in the context of major increases in NHS spending, and as part of a wider national strategy to reduce regional health inequalities.,,
In this section, we analyse the main national policies introduced since 1990 that explicitly aimed to reduce inequities in the quantity or quality of general practice services in England. We group these policies by their focus, including policies related to changes in:
- resource allocation
- commissioning and contracting
- the GP workforce
- premises.
For each area, we describe the key policies proposed and delivered, and review available evidence on their implementation and impact.
Table 1: Summary timeline of national policies aiming to improve general practice in deprived areas in England, 1990–2021
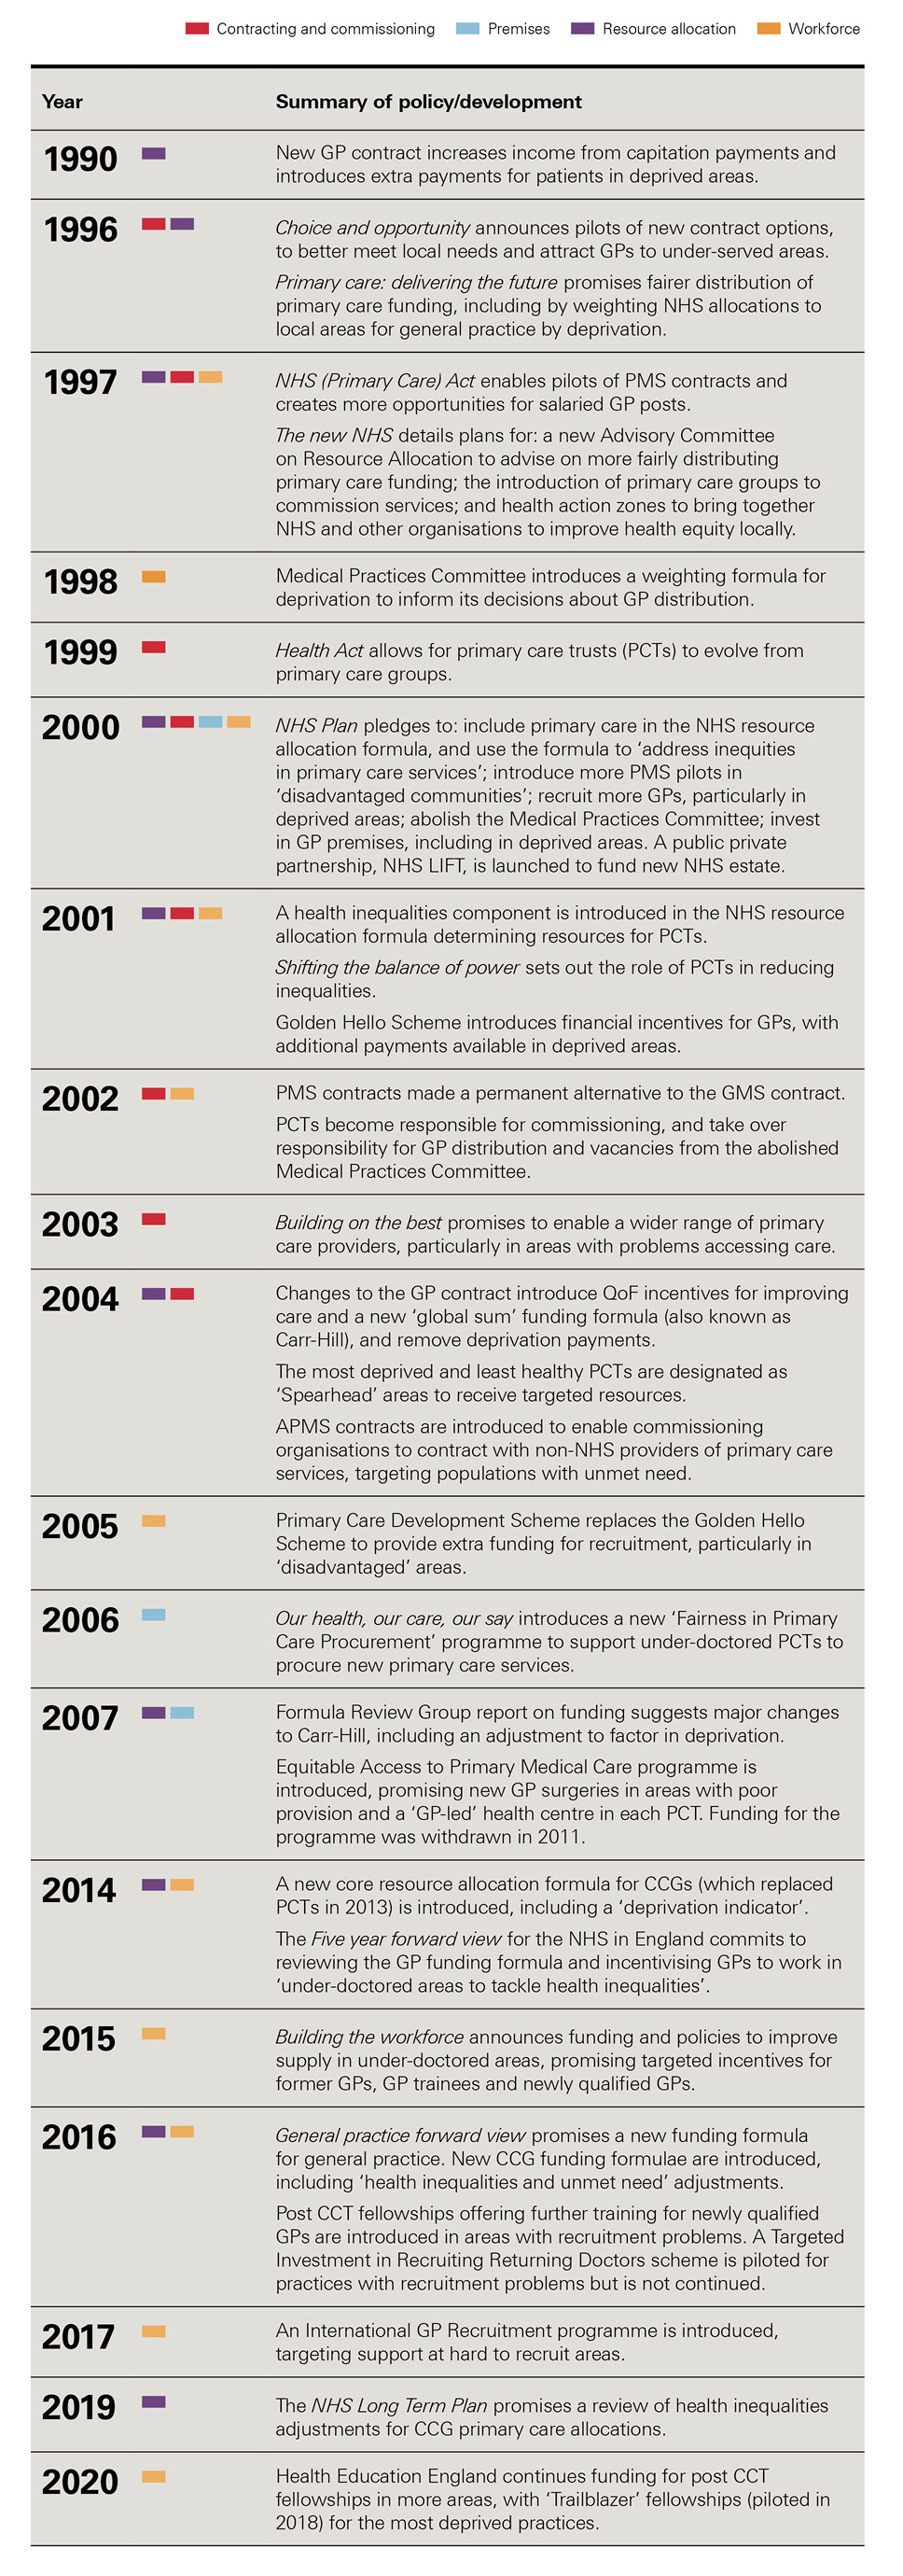
Source: Gov.uk; NHS England website; UK Government Web Archive.
Resource allocation
The level of funding available has a major impact on what general practice can deliver. From 1990, successive governments acknowledged that funding for general practice was not evenly distributed. Changes have been made to how overall NHS funding is allocated between areas. But major changes to the allocation of core GP funding – the ‘global sum’ formula – to help reduce inequities have not materialised, despite repeated promises to make the system fairer.
Key policy developments since 1990
Core practice funding
There is a complex mix of funding streams for general practice, but most of the funding comes through the core GP contract (Box 1). The government introduced a major new GP contract in 1990, which increased the proportion of GPs’ income from capitation payments (for each registered patient) and introduced new financial incentives, including for undertaking health promotion activities. The contract also included additional payments for patients living in deprived areas (calculated using the Jarman index, which accounted for several factors, such as patients’ employment and housing). To try to target funding more accurately based on need, government updated the system for calculating deprivation payments in 1999 (and also increased the budget for deprivation payments by 45%).
The next major changes to the GP contract were made in 2004. QoF was introduced to offer financial incentives for improving care (see Box 1), deprivation payments were removed, and a new funding formula – the ‘global sum’ formula, also known as ‘Carr-Hill’ – was introduced to allocate GP funding. The formula was designed to ensure that resources would be directed to practices based on an estimate of their workload and unavoidable costs. Payment was based on the GP patient list size, adjusted to reflect differences in the age and sex of patients, additional patient needs (using the standardised mortality ratio and longstanding illness for patients younger than 65), list turnover, rurality, and the cost of employing staff. There was no specific adjustment for workload associated with practising in areas of socioeconomic deprivation. A ‘minimum practice income guarantee’ was also added to the contract, ensuring that practices’ income would not fall because of the new formula.
Policymakers agreed that the formula would be reviewed after implementation by a Formula Review Group (FRG). The group reported in 2007 and suggested significant changes to the formula. They recommended that the workload adjustment be changed to factor in deprivation, by including an index of multiple deprivation (IMD) score for patients’ electoral ward of residence. They also suggested an adjustment to reflect the extra costs of recruitment and retention to attract GPs in deprived areas. The FRG recognised that their revised formula – if implemented – would lead to ‘significant redistributive effects’ between practices.
Following the review, the BMA general practitioners committee – responsible for GP contract negotiation – asked practices and local medical committees (representative GP committees) to consider whether the FRG recommendations should be introduced. Although most respondents from local committees agreed with the changes, GPs did not. By this point, the 2008 NHS Next Stage Review had repeated the promise to ‘develop a fairer system of funding for GP practices’, but the FRG’s recommendations were not implemented.
A series of subsequent policy papers from national NHS bodies promised that the GP funding formula would be reviewed to make the allocation of resources fairer between areas, including the Five year forward view in 2014.,, In 2016, the General practice forward view contained the most explicit pledge yet to revise Carr-Hill, stating that the formula is ‘out of date and needs to be revised’. NHS England promised a ‘new funding formula’ to ‘better reflect practice workload including deprivation’. 5 years later, the formula has not been updated. The 2016 review of Carr-Hill is not publicly available.
Area-based funding allocations
In addition to the core GP contract, some funding for primary care is included in the overall NHS funding allocations for each local area – currently allocated to clinical commissioning groups (CCGs). In the early years of the NHS, there was little attempt to match local funding to population needs. In the 1970s, government introduced formulae to allocate overall NHS funding more equitably between regions.,, These initially only applied to hospital services but the formula was extended to include primary care in the early 2000s.
Governments in the 1990s pledged to allocate resources more fairly between different parts of the country. In 1996, the Conservative government announced major reforms to primary care, including a promise to tackle ‘long-standing inequities’ in the distribution of resources. The next year, the Labour government announced a new Advisory Committee on Resource Allocation to advise on the distribution of funding for health services between areas (replacing the Resource Allocations Working Group). Soon after, the Acheson review – established by government to assess health inequalities and identify actions to address them – recommended that government improve needs-based weightings to distribute NHS funding more equitably. By 2000, the Labour government pledged to use NHS resource allocation policy to ‘help reduce avoidable health inequalities’.
To help achieve this objective, government introduced a new health inequalities component in the overall NHS resource allocation formula from 2001/02. The formula determined the resources for primary care trusts (PCTs), responsible for commissioning primary care and managing the quality and quantity of local services. An adjustment was initially made to target a proportion of resources to areas with the poorest health. A new formula was then introduced from 2003/04 that contained an adjustment for unmet health need – combined with broader policies and targets to reduce gaps in life expectancy between richer and poorer areas of England (see section on commissioning and contracting). The weighting given to the health inequalities adjustment was originally 15% but was reduced to 10% in 2010.
In 2013, PCTs were replaced by CCGs (which later took on responsibility for commissioning primary care). The funding received by each CCG is determined by several different allocation formulae, covering core services, primary medical services and specialised services. NHS England introduced a new core CCG resource allocation formula from 2014, including a ‘deprivation indicator’.
In 2016/17, a new formula for CCG primary medical care allocations was introduced. This included updated estimates of primary care workload per patient and included IMD scores in the weightings. For each formula, NHS England includes a ‘health inequalities and unmet need’ adjustment – of 15% for primary care, 10% for core services and 5% for specialised services. A review of these adjustments was promised in the NHS Long Term Plan in 2019.
Evidence on policy impact
Core GP funding
The impact of GP funding allocations on practices in more deprived areas has changed over time. Deprivation payments in the 1990s were broadly welcomed by GPs. But there were concerns that payments did not reflect workload, small pockets of deprivation in relatively affluent areas were not recognised, and the system favoured urban over rural practices. Changes to the way deprivation payments were calculated from 1999 redistributed some funding from London to deprived areas of northern England, and succeeded in targeting payments more precisely. Deprivation payments were removed with the introduction of Carr-Hill in 2004.
Evidence suggests that Carr-Hill formula – in place since 2004 – does not adequately adjust for additional workload associated with delivering general practice in areas of high deprivation. This results in inequity of funding distribution across general practice, with practices in more deprived areas losing out., This was recognised by the Carr-Hill formula review group in 2007, which recommended the inclusion of IMD scores in the formula to make the allocations fairer. Levene et al studied the relationship between socioeconomic deprivation scores and practice payments between 2013 and 2017, finding that for each 10% increase in IMD score, practice payments increase by just 0.06%. In 2020, Health Foundation research found that, once weighted for need, practices in the most deprived areas receive around 7% less funding per patient than practices in the most affluent areas. Inequities in funding between surgeries in more and less deprived areas are not reducing over time.
Other general practice income also affects the distribution of resources between areas. The ‘minimum practice income guarantee’, introduced in 2004, redirected some funding to practices in deprived areas, but was phased out from 2014. Recent data suggest practices in more deprived areas tend to receive lower QoF scores, resulting in lower income. Provision of ‘directed enhanced services’ in primary care – which practices can choose to provide in exchange for extra income – is also lower in deprived areas.
Area-based funding allocations
Understanding how changes to overall NHS funding allocations affect equity in general practice is challenging. Area-based allocations cover funding for a vast array of NHS services, not just primary care. Local commissioners make different decisions about how these resources are used in their area. And most funding received by general practices comes directly through the GP contract. Area-based allocation formulae have changed over time, and some areas have remained either ‘over’ or ‘under’-funded compared with their target allocations.
Barr and colleagues studied the impact of changes to the NHS resource allocation formula between 2001 and 2011 – a period when policymakers attempted to increase NHS resources for more deprived areas in England. They found that geographical inequalities in mortality from causes amenable to health care declined in absolute terms during the 10-year period – with most of the observed reduction explained by the increase in NHS resources in more deprived areas. This suggests that changes to NHS resource allocation may be an effective mechanism to reduce health inequalities. But it is not clear how far overall attempts to make NHS funding more equitable between regions of England trickle down to general practice.
Since 2010, changes to allocation formulae have affected how resources are distributed between more and less deprived areas. The reduction of the PCT health inequalities adjustment in 2010 directed some funding away from deprived areas. And changes to the core CCG allocation formula in 2014, and the primary care allocation formula in 2016, made each less progressive than its predecessor in terms of distributing funding relative to deprivation.,,
Contracting and commissioning
Alongside changes in how funds are allocated, reforms to GP contracts and commissioning have been used to influence how NHS resources are used to improve primary care. Since 1990, new GP contracts have been introduced by policymakers to give greater flexibility to tailor local services in more deprived or under-doctored areas. And regular reforms to NHS commissioning have included broad aims to reduce inequalities in care quality and outcomes.
Key policy developments since 1990
Contracting
Historically, there was only one nationally negotiated GP contract. Government introduced a wider choice of contracts for GPs in the late 1990s, partly to improve quality of care and allow services to be better tailored to meet local needs, and partly to attract GPs to work in under-served areas by providing more flexible employment options.,
To help do this, the NHS (Primary Care) Act 1997 enabled pilots of new PMS contracts (see Box 1) and created more opportunities for salaried GP posts (an alternative to practising as a self-employed GP partner)., PMS pilots began in 1998 – and initially were mostly in deprived areas., Unlike the national contract, GPs could negotiate PMS contracts locally with their PCTs and test new ways of contracting services. Many PMS pilots made use of a new salaried doctor scheme that reimbursed the costs of salaried posts.,
In 2000, The NHS Plan made existing PMS pilots permanent and promised to expand them, including 200 PMS sites mainly in ‘disadvantaged communities’ by 2004. PMS contracts became a permanent alternative to the GMS contract in 2002. PMS and GMS contracts have become more similar over time. PMS contracts and salaried GPs remain.
The introduction of APMS in 2004 (see Box 1) was a further attempt to use GP contracts to help improve primary care in under-doctored areas., These contracts allowed commissioning organisations to contract with non-NHS bodies (such as commercial providers or social enterprises) to supply primary care services. APMS intended to expand primary care capacity and offer patients more choice of providers and services, particularly targeting populations with ‘high health needs without the services to respond to them’ to ‘tackle longstanding inequities’. Between 2008/09 and 2012/13, 4% of practices held APMS contracts. By 2018/19, 2% of practices were run by alternative contract providers. The 2004 contract reforms also saw the introduction of the GMS contract (see Box 1).
Commissioning
Over the past 30 years, local NHS commissioners have been given responsibilities to purchase some primary care services (see section on resource allocation), manage GP contracts, and improve the quality of primary care. National policy on NHS commissioning has had broad and overlapping aims, including to reduce inequalities in care quality and outcomes.,,,
In 1991, two models of commissioning health services were introduced – the first time there had been a formal split between ‘purchasers’ and ‘providers’ of NHS care. Health authorities were responsible for assessing population health needs and purchasing acute or community services – and gained responsibility for primary care contracting in the mid-1990s. GP fundholding was also introduced, enabling GP practices that signed up to control some of the budget for hospital care for their patients (and receive a share of any savings generated).
Fundholding was abolished by the Labour government in 1999, amid concerns that it was contributing to inequities in care. But the purchaser-provider split was maintained and government introduced new primary care groups (PCGs), responsible for commissioning hospital, community, and primary care services in their area. By 2002, primary care trusts (PCTs) had replaced PCGs, bringing together the functions of health authorities and PCGs.
PCTs were explicitly tasked with reducing health inequalities., PCTs were required to carry out health equity audits to identify how fairly NHS resources were distributed within their areas and identify actions to address inequalities. To help target resources at the most deprived areas, government identified ‘spearhead’ PCTs in 2004, covering the 20% of areas with the greatest deprivation and ill health. A new funding formula was introduced to direct additional NHS resources to deprived areas (see section on resource allocation).
A mix of area-based policies were also introduced in the late 1990s and 2000s that aimed to improve health and reduce inequalities through changes in how services were planned and delivered.,,,, For example, health action zones were local partnerships for improving health and health equity involving NHS commissioners, providers, local government and others between 1998 and 2003, established in areas of high deprivation or ill health. Schemes varied based on local context but included a focus on improving primary care – including by improving premises and expanding services in deprived areas.
PCTs were abolished under the Health and Social Care Act in 2012. CCGs were created to plan and commission most local services – and inherited responsibility for commissioning primary care over time from NHS England. Among other aims, NHS England and CCGs were intended to reduce inequalities in access to and outcomes of NHS care. Under the latest round of NHS reforms due to be implemented in 2022, CCGs will be replaced by integrated care boards, which are also expected to be key vehicles for reducing inequalities.
Evidence on policy impact
Contracting
Evidence on the effects of the new GP contract models introduced from 1997 onwards is mixed. Most available evidence is from the first wave of PMS pilots, which had some positive effects. The pilot sites were concentrated in deprived areas – particularly in cities.,, The national evaluation found that salaried contracts had resulted in modest but positive improvements in GP recruitment and retention., And the pilots were successful in improving access and quality of care for vulnerable groups.,,, But the mechanisms for improving quality in pilot sites – such as effective management, clear objectives, and flexible professional relationships – were not unique to the PMS model.
The impact of PMS in different areas is also likely to have changed over time. Later PMS pilots were more geographically spread, with fewer placed in deprived areas. By 2004/05, salaried GP posts were more common in more affluent areas. By 2013, NHS England analysis found that there was no relationship between PMS expenditure and deprivation.
Evidence on the impact of APMS contracts is more limited. Analysis of practices in England open from 2008/09 to 2012/13 found that practices holding APMS contracts tended to be in more deprived areas than GMS or PMS practices. But while APMS had more GPs per 1,000 patients, they were found to perform worse on care quality and patient experience.
Commissioning
Overall, evidence suggests that changes to NHS commissioning have not led to reductions in health inequalities,,,, – though regular reorganisations of NHS commissioning systems make evaluation challenging, and evidence of the effect on primary care is more limited.
Evidence suggests that PCTs largely failed to reduce health inequalities, despite explicit efforts to do so by improving commissioning of services. Studies on health action zones also found no clear evidence of an effect on population health and health inequalities., More recent evidence, however, suggests the broader health inequalities strategy that these partnerships and other related policy developments were part of – including directing additional NHS funding to more deprived areas – may have been partially effective in reducing health inequalities in England over time.,,, There is little evidence to suggest that clinical commissioning since 2010 has had a significant impact on inequalities.,
Workforce
Having enough staff is central to delivering good care in general practice, and recruiting and retaining more GPs and other primary care professionals continues to be a policy priority. Since 1990, national policies to address the inverse care law in general practice through more equitable workforce distribution have fallen into two broad groups: changes to central controls on the distribution of GPs, and incentives to attract and retain GPs in certain areas. New working arrangements for GPs (see section on contracting) and funding for new practices (see section on premises) have also been used to attract staff to under-doctored areas.
Key policy developments since 1990
Controls on GP distribution
Central controls on GP distribution have been used for much of the lifetime of the NHS. From 1948 to 2002, the Medical Practices Committee (MPC) was responsible at a national level for the equitable distribution of GPs, refusing applications from doctors wanting to practise in areas with an ‘adequate’ number of GPs., The MPC considered various factors including deprivation in its decisions, and introduced a weighting formula for deprivation in 1998.
The government announced the abolition of the MPC in 2000, citing ‘only partial success’ in ensuring the fair distribution of GPs. In 2002 – when the committee was abolished – responsibility for workforce distribution and GP vacancies transferred to PCTs. Despite the shift towards local control, government still set advisory lower and upper limits for GP recruitment for PCTs between 2002 and 2004 to promote ‘more equitable distribution’. In 2009, the new Medical Education England (later Health Education England) assumed responsibility for national workforce planning, but not explicitly for fair GP distribution.
NHS Plan targets
The NHS Plan promised to recruit 2,000 extra GPs nationally by 2004 and improve primary care supply in deprived areas. To support these aims, government introduced financial incentives under the Golden Hello Scheme in 2001. The scheme gave up to £5,000 to new GPs and returners, with an extra £5,000 available to GPs in deprived or under-doctored areas. From 2002, the payment increased for under-doctored PCTs.
The Primary Care Development Scheme replaced the Golden Hello Scheme in 2005. The scheme aimed to provide extra funding and support to areas with recruitment difficulties, particularly ‘disadvantaged areas with high needs’. Funding could be used to recruit more GPs – and in some cases to ‘improve’ the skill mix in primary care – by offering financial incentives (for individuals or practices) and development opportunities. National funding of £13m per year was allocated initially, subject to a planned review in 2008/09. There is no publicly available information on the scheme beyond 2005.
‘Building the workforce’ since 2015
The NHS Five year forward view in 2014 committed to incentivising GPs to work in ‘under-doctored areas to tackle health inequalities’. The Building the workforce plan for general practice in 2015 then announced a mix of funding and policies to fulfil this commitment.
The plan included funding to encourage former GPs to return to practice in ‘areas of greatest need’. NHS England piloted a Targeted Investment in Recruiting Returning Doctors Scheme in 2016 for practices with vacancies outstanding for a year or more. The pilot funded 50 practices in under-doctored areas to pay a returning GP up to £8,000 in relocation costs and a £2,000 education bursary, provided the GP practised there for 3 years. The scheme was not extended beyond the 1-year pilot.
The 2015 plan also promised targeted incentives for GP trainees. In 2016, NHS England and Health Education England introduced a Targeted Enhanced Recruitment Scheme (TERS). Under TERS, GP specialty trainees receive £20,000 for undertaking their 3-year GP speciality training in ‘hard to recruit’ areas identified by Health Education England – including deprived areas. NHS England has funded more TERS places over time.
Building the workforce committed Health Education England to funding ‘post CCT’ training – further training for qualified GPs who have attained their Certificate of Completion of Training – in hard to recruit areas. This built on a recent pilot for a fellowship programme of additional academic study and practical training for recently qualified GPs., Pilots expanded in 2015/16, and in 2016 NHS England committed to 250 new post CCT fellowships in ‘areas of poorest GP recruitment’. In 2020/21, Health Education England continued funding for a less ‘restrictive’ post CCT fellowship programme. The programme is not just for under-doctored areas but includes ‘Trailblazer’ fellowships – piloted in 2018 – for the most deprived practices and specifically focused on addressing health inequalities.,,
In 2017, NHS England introduced an International GP Recruitment programme for ‘some of the most hard to recruit areas’, to help meet a General practice forward view target to recruit from outside the UK. It provided help with relocation and training for GPs. Pilots aimed to recruit GPs from the European Economic Area to Lincolnshire, Essex, Cumbria, and Humber, Coast and Vale. After the government set a more ambitious target to recruit GPs internationally, NHS England increased funding to expand the programme.
Evidence on policy impact
Evidence on the impact of individual workforce policies on recruitment and retention of GPs in deprived areas is limited and mixed. There is some evidence that central controls on GP distribution between 1948 and 2002 helped match GPs more closely with population need. Goddard et al studied the impact of controls on GP distribution between 1974 and 2006, and found that equity in GP supply increased until 1994, but then decreased – and fell further after the MPC was abolished in 2002. They concluded that controls likely increased overall equity in GP distribution, but – given the range of other factors shaping where GPs work – were not sufficient to stop distribution becoming less equitable. By the time it was abolished, the MPC’s assessment was that it had achieved fairer GP distribution. But government criticised the committee for making decisions subjectively and at too local a level.
Since 2015, several policies used targeted funding to try to improve recruitment in deprived areas, but data on their impact are limited. NHS England evaluated the Targeted Investment in Recruiting Returning Doctors Scheme in 2017, before discontinuing it. They found that a minority of practices filled their longstanding vacancies, family ties tended to discourage doctors from relocating, and the relocation package was insufficient to attract GPs to under-doctored areas.
NHS England has expanded the TERS scheme, and all posts were filled in 2020/21.,, But there are no data on the retention of trainees recruited through TERS, and the scheme has been implemented in the context of overall increases in GP trainee numbers, making it hard to assess the contribution of TERS to trainee recruitment and distribution. Trailblazer fellowships have also been extended. In a qualitative study of the seven GPs in the initial pilot, participants were very satisfied and thought that it would make general practice more attractive.
There is also little evidence on the impact of the International GP Recruitment Programme. The Lincolnshire pilot recruited 26 doctors against a target of 25, but it is unclear how far the programme contributed to filling these posts, and whether targets to recruit 75 doctors in Essex and Cumbria were met. Health Education England highlighted in its work on the pilots that some doctors needed more support than practices expected.
General practice workforce distribution since 1990
Another way of thinking about the potential impact of these policies on the GP workforce is to compare changes in the distribution of GPs in relation to deprivation over time. Overall, available data suggest that inequities in the distribution of GPs have persisted over the past three decades – though there have been periods where these differences have narrowed. A lack of comparable data makes it hard to understand long-term trends. But the Department of Health identified low levels of practice staff in deprived areas in the early 1990s. And there is evidence that inequity in GP supply relative to population need grew between 1994 and 2003, despite overall increases in GP numbers.
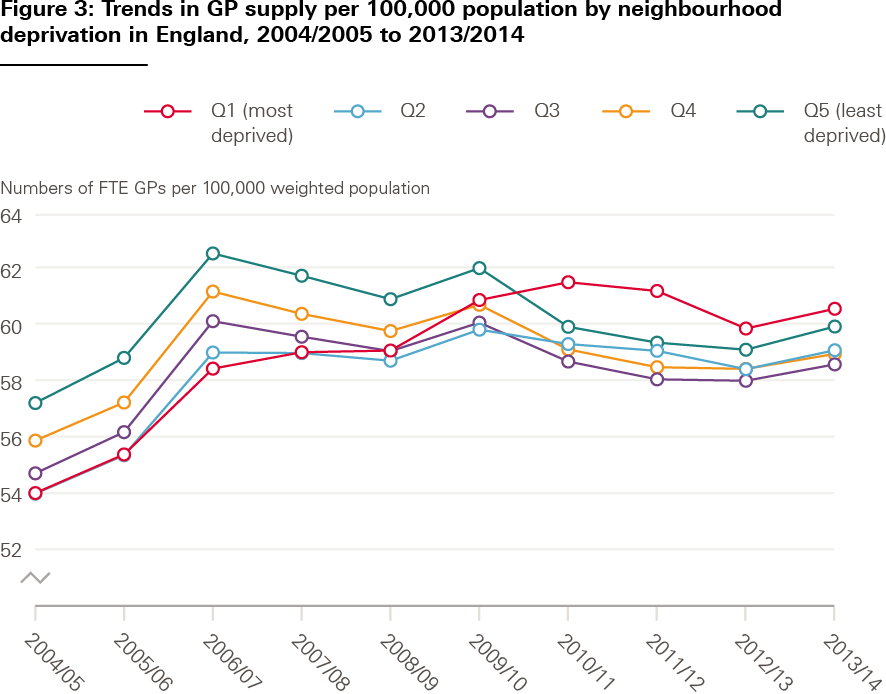
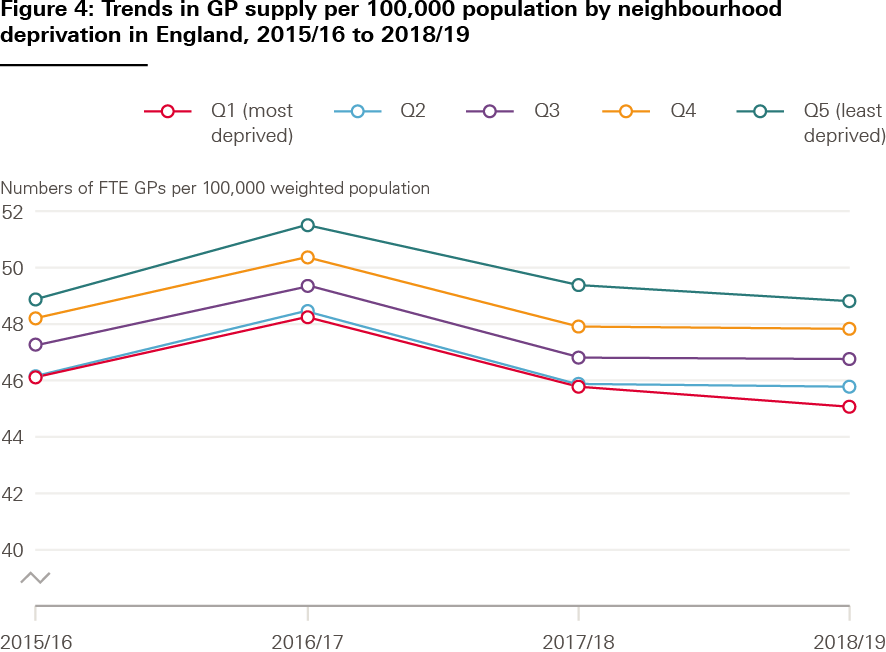
Between 2009/10 and 2013/14, the pattern reversed, with the most deprived neighbourhoods having the most GPs per need-adjusted patient (see Figure 3). This suggests that policies in the 2000s may have had some success in contributing to a more equitable supply of GPs in England. But improvements do not appear to have lasted: there were consistently fewer GPs per patient in deprived areas than in affluent ones between 2015/16 and 2018/19 (see Figure 4). Data between 2004/05 and 2013/14 (Figure 3) are not directly comparable to data between 2015/16 and 2018/19 (Figure 4), as the way that GPs were counted by NHS Digital changed.
Premises
Having high-quality and accessible buildings can support the delivery of high-quality care. Broadly speaking, national policies on general practice premises either aim to improve (or ‘modernise’) existing premises, or to build new ones. Since 1990, some policies attempted to improve the poor state of the general practice estate, though rarely with the aim of increasing equity. In the late 2000s, building new practices was explicitly used by national policymakers as a route to increase equity. Policymakers hoped that putting new practices in deprived areas would encourage GPs to work there, in turn improving access to primary care.
Key policy developments since 1990
Labour governments introduced several policies on general practice premises in the 2000s. Data collected in 1996 had shown that GP premises were often not fit for purpose. Almost half were based in adapted residential buildings or converted shops. 53% were over 30 years old, and patient access frequently failed to comply with Disability Discrimination Act requirements. The 1996 white paper Primary care, delivering the future stated an intention to ‘enable different options’ for GPs to develop premises based on local needs. This was not targeted at deprived areas, but did result in minor changes – for example, allowing health authorities to give GPs loans to buy themselves out of leases on substandard premises.
The 1998 Spending Review promised to ‘improve the quality of GP premises’, and was followed by public service agreements – government objectives linked to departmental spending – pledging that improvements would be ‘targeted towards areas of deprivation, resulting in improvements to 1,000 premises nationally by 2002’., Department of Health expenditure records show that by the end of the 2000 financial year, 598 practices had received some improvements, with plans in place for a further 559 improvements during 2001. But we do not know whether these improvements were made in deprived areas.
The NHS Plan (2000) contained another raft of policies on GP premises. Investment of ‘up to’ £1bn in primary care premises was promised, with ‘up to’ 3,000 premises substantially refurbished or replaced by 2004, alongside 500 new primary care centres. It was not clear where these additional resources would be targeted, but the plan specified that ‘health centres in the most deprived communities will be modernised’. This commitment was repeated in Tackling health inequalities – a programme for action in 2003, which promised to improve primary care facilities in inner cities and ‘disadvantaged areas’.
The vehicle for delivering these plans was a new public-private partnership – NHS local improvement finance trust (LIFT) – launched by the Department of Health in 2000. LIFT was a mechanism for funding new NHS estate. It aimed to address longstanding underinvestment in primary care facilities in England, and – by doing so – ‘help resolve GP recruitment and retention problems’. Each project would combine funding from the Department of Health with matched funding from PCTs, local authorities, and others. A larger tranche of money – 60% of the total – would come from a private sector partner. PCTs would be responsible for selecting sites for LIFT funding and GPs would occupy the buildings as tenants.
By 2004, the NHS reported that 42 LIFT projects were underway, and that ‘most’ projects were in deprived areas. A new aim – of 54 NHS LIFT projects by 2008 – was set. A 2005 report from the National Audit Office said that progress had been significantly slower than anticipated, largely due to hesitancy from GPs. In 2014, 314 projects had been developed across England using LIFT funding (though these were not exclusively in general practice).
More targeted policies to improve primary care facilities were introduced in the late 2000s. Fairness in Primary Care Procurement was introduced in 2006. It aimed to improve primary care in the least well-doctored PCTs, which would receive national support to procure new primary care services. Ten PCTs participated in Fairness in Primary Care Procurement, with most securing a single new practice., In 2008, the scheme was extended to all PCTs under the Equitable Access to Primary Medical Care (EAPMC) programme. Government invested £250m between 2008 and 2011 to deliver two aims: opening 100 new practices in the 25% of PCTs with the ‘poorest provision’, and developing a new GP-led health centre in an easily accessible location in every PCT. Each GP-led health centre needed to offer walk-in services, including for non-registered patients, and longer opening hours. EAPMC led to the procurement of 113 new premises in 50 PCTs, before funding was withdrawn in 2011.
More recently, a mix of national policies considered how to improve primary care premises in England – including the General practice forward view in 2016, the Naylor Report in 2017, and NHS England’s general practice premises policy review in 2019. But none of these policies focused on reducing inequalities or improving premises in more deprived areas.
Evidence on policy impact
Evidence on the impact of overall attempts to improve GP premises in different areas is limited. Evaluations of these schemes often focus on pounds spent and buildings produced. But little detail is provided on where improvements were made or practices were built, and how this relates to the socioeconomic characteristics of an area. Even then, new buildings themselves do not necessarily mean better access and quality of care.
NHS LIFT appears to have had some success in enabling new NHS services to be built in areas of high deprivation. By 2013, 40% of all LIFT investments had been made in the 10% most deprived areas, and almost 90% of LIFT projects were in areas of above average health needs. But progress in building new practices was slower than intended, and attracting GPs to move into LIFT buildings proved more challenging than expected. It is difficult to assess the impact of these developments on the provision, use or quality of primary care services.
More targeted policies appear to have had some positive effects. The EAPMC scheme led to fewer practices being built than originally intended – 113 in total. But opening new practices appeared to drive an increase in the number of GPs working in more deprived areas. As a result, Asaria et al conclude that EAPMC partly contributed to a reduction in socioeconomic inequality in GP supply in England from 2006/07 to 2011/12. Socioeconomic inequality in GP distribution increased again after the programme wound down in 2011/12.
EAPMC may have also had unintended effects. In addition to funding for new practices in targeted areas, every PCT was required to develop a new GP-led health centre. The health centres built under the scheme were more likely to be placed in areas of high deprivation (28% of GP-led walk-in centres were in the 10% most deprived areas, compared with 1% in the least deprived 10%). But some NHS leaders worried that the services were poorly targeted. And some commissioners felt that walk-in centres may have created inequity in access because they were mostly used by people living close by, rather than by groups from areas of high deprivation with significant health needs.
Discussion
We analysed national policies to address the inverse care law in general practice in England since 1990. The inverse care law is nothing new – and neither are policy efforts to address it. A mix of approaches have been used by policymakers to reduce inequities in GP services – including policy on funding, commissioning, contracting, workforce and premises. Policy development has not been linear, and efforts to tackle the inverse care law in general practice since 2010 have been more limited. Data on the effect of individual policies are limited, though some approaches appear to have made a positive contribution to addressing inequity. Policy changes in each area overlap and interact, and policies on general practice have been implemented in the wider context of approaches to NHS investment and reform.
Standing back, policy efforts to reduce inequities in GP services since 1990 have not been enough to overcome differences in care between more and less deprived areas. Lack of consistent data make it difficult to compare changes over time. But analysis of recent data suggest that GP practices in more deprived areas are relatively under-doctored, underfunded, and perform less well on a range of quality indicators. In some areas, such as the distribution of GPs in England, improvements in the late 2000s appear to have reversed (see section on the GP workforce). And these gaps may be widening: analysis of data on GP numbers in England from 2015 to 2020 suggest that inequities in the distribution of GPs are growing.
Meantime, general practice is in a precarious state. GP consultation numbers are now higher than they were pre-pandemic, but the number of permanent, fully qualified GPs has fallen since 2015. The pandemic has created additional work for GPs, such as delivering millions of COVID-19 vaccinations, and there is a major backlog of unmet health care needs. GPs are also under pressure from government and national NHS bodies to increase face-to-face appointments – and risk being ‘named and shamed’ for not doing so. Staff are exhausted, and many GPs consider taking a break from work or leaving their jobs.
General practice has a central role to play in levelling up and reducing health inequalities. But if the provision of general practice remains skewed towards wealthier areas, existing disparities may widen. The inverse care law is not an inevitable feature of general practice, but it will remain so unless stronger policy action is taken to address it. To help inform future policy to reduce inequities, we identify five lessons from our analysis.
Policymakers have introduced a mix of measures, but too little has been done on funding
Over the past 30 years, the most common way of attempting to increase equity in general practice has been to try to boost the number of GPs working in deprived areas. A variety of approaches have attempted to do this – from central controls on GP distribution, to financial incentives to attract GPs to certain areas. Policy levers have often overlapped. For example, new GP contracts (in the late 1990s and early 2000s) and building new GP surgeries (in the late 2000s) have been used as mechanisms to draw GPs into under-doctored areas.
Yet policy measures in other areas – most notably the distribution of core GP funding – have been more limited. Changes to how resources are allocated between different parts of the country is an important mechanism to achieve wider policy objectives in the NHS, including reducing health inequalities. The amount of funding GP practices receive directly affects the services they can offer patients – including the number and type of staff that they can employ. But evidence suggests that the main formula underpinning general practice funding in England – Carr-Hill – does not adequately adjust for additional health care needs associated with deprivation., Promises to ‘re-do’ the formula have been made repeatedly since 2008, but not delivered. Carr-Hill is the main determinant of the income that practices receive. Wider attempts to improve equity in general practice – through changes to staffing, premises, or other areas – therefore exist in the context of continued inequity in general practice funding.
A combination of policies were implemented in the 2000s, but less has been done since 2010
Inequities in the provision of general practice between more and less deprived areas are influenced by the interaction of multiple factors – including policies on NHS funding, staffing, wider public policy, and more. A combination of policy measures are likely needed to reduce them. Under Labour governments in the late 1990s and 2000s, a mix of policies were introduced that attempted to improve the provision of general practice in areas of high deprivation – including on GP staffing, premises, and contracting – implemented in the context of a wider government strategy to reduce health inequalities (see lesson 5). Evidence on the impact of these policies is limited, but it is likely that the combination of policies in general practice contributed to a more equitable distribution of GPs by 2010 (see lesson 4).
In contrast, policy efforts to make access to general practice more equitable since 2010 have been more limited. And some national policies that appeared to be having a positive effect on the fair distribution of GPs, such as Equitable Access to Primary Medical Care (EAPMC), were stopped and not replaced. Since 2014, national NHS bodies have implemented several programmes aimed at improving recruitment in under-doctored areas, but these are relatively small scale and have had limited success (see workforce section). In addition, several current policies may inadvertently worsen inequities. For example, government has promised 26,000 additional allied health professionals working in general practice by 2024, but there are no mechanisms to ensure that these staff are targeted at areas with the greatest need. New funding provided for primary care networks – groups of GP practices – also appears to do little to account for inequities.
Policies have often been small and targeted, swimming against a much stronger tide
Policies have often been small in comparison with the scale of the problem – swimming against a strong tide of other factors shaping inequities. Policymakers can take a mix of approaches to improve equity – for example, by adapting universal policies to account for differences in need (‘proportionate universalism’), introducing targeted policies focused on increasing resources for particular groups, or some combination of the two. Yet some of the largest population-level policies that could reduce inequities in the provision of general practice – such as changes to funding (see lesson 1) – have not been implemented. And national controls to help ensure fairer distribution of GPs were scrapped in the early 2000s. Current policies on distribution of GPs in England rely on small-scale and often time-limited incentive schemes.
Since 1990, national NHS policymakers relied on changes to NHS commissioning as one mechanism for improving health and reducing inequalities. Yet there is little evidence that NHS commissioning in and of itself has led to reduced inequalities. NHS commissioners have some discretion to direct local funding to general practice in more deprived areas. But these pots of money are often small and time-limited., Reliance on local decisions may increase inequities if there are systematic differences in approaches between areas.
Evidence on policy impact is limited and mixed, but some measures appear to have helped
Overall, evidence on the impact of policies to tackle the inverse care law in general practice in England is limited. A small number of policies, such as the introduction of PMS and salaried contracts, were subject to national evaluation. But others, such as the Golden Hello Scheme and Targeted Enhanced Recruitment Scheme (TERS), have not been formally evaluated. In other areas – for example, the development of primary care premises under the LIFT scheme – data to inform understanding of how policy changes affected GP care in different areas are limited. And understanding how changes in NHS policy that included broader aims on reducing inequalities, such as changes to commissioning, affected equity in general practice is challenging.
That said, some policies appear to have had some positive effects. The initial PMS pilots and salaried GP contracts in the late 1990s – targeted at more deprived areas – were successful in improving access and quality of care for vulnerable groups. But later PMS pilots and GP salaried posts were more geographically spread, so these effects may have not been sustained. Central controls on GP distribution – in place until 2002 – appeared to contribute to the more equitable distribution of GPs in England, though were not strong enough to prevent GP distribution becoming more inequitable over time. And the EAPMC scheme in the late 2000s – including funding for new GP practices in deprived areas – appeared to drive an increase in the number of GPs working in more deprived areas, likely contributing to a reduction in inequities in GP supply in the late 2000s. The combination of policies on NHS funding and premises in the 2000s are likely to have contributed to this progress.
Evaluation of more recent attempts to incentivise GPs to practise in ‘hard to recruit’ areas in England is limited. International evidence is mixed but suggests that financial incentives may help recruit primary care doctors into under-served areas under certain conditions, and that those who complete their training in these areas are more likely to practise there.
The impact of policies on general practice is shaped by the wider policy context
Ultimately, policies to reduce inequities in the provision of general practice operate in a wider policy and political context. First, broader policies on general practice – for example, the proportion of NHS investment in primary care and overall efforts to increase GP recruitment – shape the impact of policies to distribute resources more equitably. Increasing the share of funding in more deprived areas is also likely easier when overall funding is increasing – reducing a ‘winners’ and ‘losers’ effect. On the flipside, financial incentives for GPs to train in more deprived areas may have less impact when overall trainee numbers are high (as they are currently) and – as a result – GP training places are more easily filled. Universal increases in GP numbers or funding that do not adequately account for deprivation will also likely dampen the effect of smaller initiatives targeting resources in more deprived areas.
Second, policies on general practice operate in the broader context of policy on NHS improvement and reform. Increasing funding for general practice is easier when overall NHS resources are increasing – and changes in how services are planned and delivered affect general practice in more deprived areas. Changes to overall NHS resource allocation between 2001 and 2011, which increased resources for more deprived areas, appear to have contributed to reductions in health inequalities between more and less deprived areas. But there has also been a major shift in the composition of NHS spending over the past two decades towards hospital-based care and away from other services in the community.
And third, policies on general practice are shaped by wider government policy. Attempts to reduce inequities in general practice in the late 1990s and 2000s were implemented in the broader context of a national strategy to reduce health inequalities in England. The strategy involved a range of interventions and evolved over time – including better support for families, efforts to tackle poverty, improving NHS prevention and treatment, and a mix of other measures, combined with increased investment in the NHS and other services.,,
Since 2010, policies on general practice in England have been implemented in the context of limited growth in NHS spending and cuts to public health and wider social services that shape health. There is currently no national strategy for reducing health inequalities in England, but government is expected to publish a white paper on levelling up in 2022.
Recommendations
The current government was elected on a promise to ‘level up every part of the country’. Manifesto commitments included 6,000 additional GPs, and 50 million more appointments per year in general practice. Unless these policies are designed with equity in mind, promises to expand access to general practice may run counter to promises to level up health. For example, boosting overall GP numbers does not necessarily result in more equal distribution between different parts of the country.,,
Several measures are in place to address parts of the inverse care law in general practice, but they are swimming against a powerful tide of other policies and factors likely to widen gaps in care between richer and poorer areas. Attempts by NHS England to promote equality and tackle health inequalities will be undermined by inequities in provision of NHS services. Urgent action is needed to prevent this from happening. The government’s levelling up agenda offers an opportunity to level up within the NHS, including in general practice.
Based on our analysis, we make the following recommendations for national policymakers:
- Addressing the inverse care law in general practice should become an explicit national priority, set by government. This should form part of a broader national strategy to reduce health inequalities, with clear goals for improvement and measures for tracking progress.
- New policies for general practice in England should be subject to an ‘equity test’. This should consider how the policy may impact on the equitable provision of general practice, and how it will interact with other policies in place or being introduced.
- An independent review of general practice funding allocations should be established to examine all income streams into general practice, how these differ between more and less deprived areas, and alternative approaches to allocating resources more fairly based on health care needs. Government should act on recommendations from the review.
- Government should work with national NHS bodies to develop a medium and long-term workforce strategy for general practice, as part of a broader workforce strategy for the NHS in England. This should include plans and projections for GP retention and recruitment, and consider mechanisms to more equitably distribute the GP and allied health professional workforce. As part of this strategy, government should consider stronger central coordination and oversight of GP distribution in England.
- Integrated care boards should be required to develop plans for reducing inequities in the provision of high-quality GP services. This should include clear goals for improvement and how they will be measured. Integrated care boards should also produce plans for data collection and analysis to effectively monitor general practice provision relative to need.
- Government must commit to more rigorous testing and evaluation of policies affecting general practice – including current policies to recruit GPs in under-doctored areas. Evaluations should explicitly consider equity and be made publicly available.
Conclusion
The inverse care law is not an inevitable or irreversible feature of general practice. National policymakers have used a mix of approaches to try to reduce inequities in the provision of GP services – including policies on funding, commissioning, contracting, workforce and premises. Overall, evidence on the impact of these policies is limited – though some approaches appear to have helped reduce inequities. Since 2010, efforts to tackle the inverse care law in general practice have been limited and small scale. Key policy changes that may improve equity in general practice have not been implemented – most notably revising the core funding formula for GPs. Meantime, general practice in deprived areas remains under-doctored, and performs less well on key quality indicators than general practice in more affluent areas.
Addressing the inverse care law in general practice aligns with government’s levelling up agenda, and should become a core objective of policy. Changes to GP funding and stronger central coordination of workforce distribution are key mechanisms that could be used to do it. Without deliberate policy action, inequities in general practice in England are likely to grow.
Appendix 1: Literature search
We carried out a review of the literature to identify qualitative or quantitative evidence on the impact of national policies to reduce inequities in the supply of general practice services in England. We conducted searches in Medline, Embase, Web of Science Social Sciences Citation Index, and Health Management Information Consortium for relevant studies in English published between January 1990 and July 2021. The search strategy was tested across the four databases to ensure that key ‘tracer papers’ were found in our searches.
Table A1 summarises our search strategy in Medline. We also undertook targeted searches in internet search engines (such as Google Scholar) and government websites (such as the National Archives and Gov.uk) to identify further policy papers or evaluation documents, as well as contacting relevant national NHS agencies for more detail on policy evaluation.
We developed inclusion criteria to identify relevant studies (Box A1). Titles and abstracts of all papers were screened by two members of the review team to identify relevant studies, with the full text reviewed if the paper appeared relevant. Studies were assessed against the inclusion criteria. For included studies, we reviewed the papers in full and grouped them by domain – including papers related to policies on workforce, funding, premises, or other areas. We tried to match studies to the key policies we reviewed – though some studies looked at a mix of policy changes together, and others looked at changes in general practice over time. We summarised data from relevant studies and used a narrative approach to reporting them.
Table A1: Medline search strategy
|
# |
Searches |
|
1 |
(policy or policies or intervention$ or program$ or project$ or strategy or strategies or approach$ or reform$).ti,ab. |
|
2 |
limit 1 to (abstracts and yr=“1990 -Current”) |
|
3 |
(equit$ or inequit$ or inequali$ or unequal or gap$ or gradient$ or distribution or inverse or under doctored or depriv$).ti,ab. |
|
4 |
limit 3 to (abstracts and yr=“1990 -Current”) |
|
5 |
(fund$ or financ$ or payment$ or allocation$ or “global sum” or capitation or money or premise$ or surgery or practice or commission$ or access or workforce or staff or doctor$ or service or organi*ation or quality or appointments).ti,ab. |
|
6 |
limit 5 to (abstracts and yr=“1990 -Current”) |
|
7 |
(general practice$ or general practitioner$ or GP$ or primary care or primary health).ti,ab. |
|
8 |
limit 7 to (abstracts and yr=“1990 -Current”) |
|
9 |
(england or NHS or National Health Service or wales or scotland or UK or United Kingdom or Northern Ireland).ti,ab. |
|
10 |
2 and 4 and 6 and 8 and 9 |
|
11 |
2 and 4 and 6 and 8 |
|
12 |
(fair and Primary Care and Procurement).mp. [mp=ti, ab, hw, tn, ot, dm, mf, dv, kw, fx, dq, nm, kf, ox, px, rx, ui, sy] |
|
13 |
Equitable Access to Primary Care.mp. |
|
14 |
GP Forward View.mp. |
|
15 |
((GP or Doctor) and “forward view”).mp. [mp=ti, ab, hw, tn, ot, dm, mf, dv, kw, fx, dq, nm, kf, ox, px, rx, ui, sy] |
|
16 |
(Practice Based Commissioning or Primary Medical Services).mp. [mp=ti, ab, hw, tn, ot, dm, mf, dv, kw, fx, dq, nm, kf, ox, px, rx, ui, sy] |
|
17 |
((Salaried or “Health Action Zone” or “Alternative Provider Medical Services” or Advisory committee) and resource allocation).mp. [mp=ti, ab, hw, tn, ot, dm, mf, dv, kw, fx, dq, nm, kf, ox, px, rx, ui, sy] |
|
18 |
(Adjusted Lists and Equitable Distribution).mp. [mp=ti, ab, hw, tn, ot, dm, mf, dv, kw, fx, dq, nm, kf, ox, px, rx, ui, sy] |
|
19 |
“golden hello”.mp. |
|
20 |
(Primary Care Development Scheme or Targeted Enhanced Recruitment or Targeted Investment in Recruiting Returning Doctors or Trailblazer).mp. [mp=ti, ab, hw, tn, ot, dm, mf, dv, kw, fx, dq, nm, kf, ox, px, rx, ui, sy] |
|
21 |
(Funded post CCT training or Car-Hill or General practice resilience fund or LIFT).mp. [mp=ti, ab, hw, tn, ot, dm, mf, dv, kw, fx, dq, nm, kf, ox, px, rx, ui, sy] |
|
22 |
LIFT.mp. |
|
23 |
21 not 22 |
|
24 |
carr hill.mp. |
|
25 |
(Funded post and CCT).mp. [mp=ti, ab, hw, tn, ot, dm, mf, dv, kw, fx, dq, nm, kf, ox, px, rx, ui, sy] |
|
26 |
12 or 13 or 14 or 15 or 16 or 17 or 18 or 19 or 20 or 21 or 22 or 23 or 24 or 25 |
|
27 |
26 not 21 |
|
28 |
1 or 27 |
|
29 |
4 and 6 and 8 and 9 and 28 |
|
30 |
primary.mp. [mp=ti, ab, hw, tn, ot, dm, mf, dv, kw, fx, dq, nm, kf, ox, px, rx, ui, sy] |
|
31 |
7 or 30 |
|
32 |
6 and 9 and 28 and 31 |
|
33 |
8 or 30 |
|
34 |
4 and 6 and 9 and 28 and 33 |
Box A1: Inclusion and exclusion criteria for literature search
Include if the study:
- Focuses on evidence or analysis on the impact of national policies to reduce inequities in the supply of general practice (GP) in England. By supply, we mean factors related to funding, staffing, premises and equipment, quality and organisation of services.
- Focuses on evidence or analysis of changes or patterns of inequities in the supply of GP in England.
- Focuses on evidence or analysis on the factors directly shaping changes or patterns of inequalities in the supply of GP in England.
Exclude if the study:
- Does not include evidence or analysis related to inequities in the supply of general practice in England, policies to address them, or factors that directly shape them.
- Focuses on policies or evidence on the inverse care law in GP in countries beyond England.
- Focuses on policies or evidence on local initiatives to address the inverse care law that are not clearly related to (or take advantage of) national policy changes.
- Focuses on policies introduced prior to 1990.
References
- Tudor-Hart, J. The inverse care law. The Lancet. 1971; 297(7696): 405–412 (https://doi.org/10.1016/S0140-6736(71)92410-X).
- Cookson R, Doran T, Asaria M, Gupta I, Mujica FP. The inverse care law re-examined: a global perspective. The Lancet. 2021; 397(10276): 828-38 (https://doi.org/10.1016/S0140-6736(21)00243-9).
- Cookson R, Propper C, Asaria M, Raine R. Socio-economic inequalities in health care in England. Fiscal studies. 2016; 37(3-4): 371–403 (https://doi.org/10.1111/j.1475-5890.2016.12109).
- Dixon A, Le Grand J, Henderson J, Murray R, Poteliakhoff E. Is the British National Health Service equitable? The evidence on socioeconomic differences in utilization. Journal of health services research & policy. 2007; 12(2): 104–9 (https://doi.org/10.1258/135581907780279549).
- Delgadillo J, Asaria M, Ali S, Gilbody S. On poverty, politics and psychology: the socioeconomic gradient of mental healthcare utilisation and outcomes. The British Journal of Psychiatry. 2016; 209(5): 429–30 (https://doi.org/10.1192/bjp.bp.115.171017).
- Goddard M, Smith P. Equity of access to health care services: Theory and evidence from the UK. Social science & medicine. 2001; 53(9): 1149–62 (https://doi.org/10.1016/S0277-9536(00)00415-9).
- Stoye G, Zaranko B, Shipley M, McKee M, Brunner EJ. Educational inequalities in hospital use among older adults in England, 2004–2015. The Milbank Quarterly. 2020; 98(4): 1134–70 (https://doi.org/10.1111/1468-0009.12479).
- Fisher R, Dunn P, Asaria M, Thorlby R. Level or not? Comparing general practice in areas of high and low socioeconomic deprivation in England. Health Foundation; 2020 (https://doi.org/10.37829/HF-2020-RC13).
- Starfield B, Shi L, Macinko J. Contribution of primary care to health systems and health. The Milbank Quarterly. 2005; 83(3): 457–502 (https://doi.org/10.1111/j.1468-0009.2005.00409.x).
- Marmot M, Allen J, Goldblatt P, Herd E, Morrison J. Build Back Fairer: The COVID-19 Marmot Review. Institute of Health Equity; 2020 (https://health.org.uk/publications/build-back-fairer-the-covid-19-marmot-review).
- Suleman M, Sonthalia S, Webb C, Tinson A, Kane M, Bunbury S, Finch D, Bibby J. Unequal pandemic, fairer recovery: The COVID-19 impact inquiry report. Health Foundation; 2021 (https://doi.org/10.37829/HF-2021-HL12).
- Alderwick H, Dunn P, Gardner T, Mays N, Dixon J. Will a new NHS structure in England help recovery from the pandemic? BMJ. 2021; 372 (https://doi.org/10.1136/bmj.n248).
- Nuffield Trust. NHS staffing tracker [webpage]. Nuffield Trust; 2021 (www.nuffieldtrust.org.uk/nhs-staffing-tracker/general-practice).
- NHS Digital. Appointments in General Practice [webpage]. NHS Digital; 2021 (https://digital.nhs.uk/data-and-information/publications/statistical/appointments-in-general-practice).
- Fisher R, Thorlby R, Alderwick H. Understanding primary care networks: Context, benefits and risks. Health Foundation; 2019 (www.health.org.uk/publications/reports/understanding-primary-care-networks).
- Fisher R. ‘Levelling up’ general practice in England: What should government prioritise? Health Foundation; 2021 (www.health.org.uk/publications/long-reads/levelling-up-general-practice-in-england).
- Carey G, Crammond B, De Leeuw E. Towards health equity: a framework for the application of proportionate universalism. International journal for equity in health. 2015; 14(1): 1–8 (https://doi.org/10.1186/s12939-015-0207-6).
- Ministry of Housing, Communities & Local Government. The English Indices of Deprivation 2019; Frequently Asked Questions (FAQs). Gov.uk; 2019 (https://assets.publishing.service.gov.uk/government/uploads/system/uploads/attachment_data/file/853811/IoD2019_FAQ_v4.pdf).
- NHS Digital. NHS Payments to General Practice [webpage]. NHS Digital; 2021 (https://digital.nhs.uk/data-and-information/publications/statistical/nhs-payments-to-general-practice).
- NHS Digital. General Practice Workforce, 30 November 2021 [webpage]. NHS Digital; 2021 (https://digital.nhs.uk/data-and-information/publications/statistical/general-and-personal-medical-services/30-november-2021).
- NHS Digital. Quality and Outcomes Framework, 2020–21 [webpage]. NHS Digital; 2021 (https://digital.nhs.uk/data-and-information/publications/statistical/quality-and-outcomes-framework-achievement-prevalence-and-exceptions-data/2020-21).
- Tallack C, Charlesworth A, Kelly E, McConkey R, Rocks S. The bigger picture: Learning from two decades of changing NHS care in England. Health Foundation; 2020 (https://doi.org/10.37829/HF-2020-RC10).
- Institute for Government. Performance Tracker 2019: General practice [webpage]. Institute for Government; 2019 (www.instituteforgovernment.org.uk/publication/performance-tracker-2019/general-practice).
- Beech J, Baird B. GP funding and contracts explained. The King’s Fund; 2020 (www.kingsfund.org.uk/publications/gp-funding-and-contracts-explained).
- Kindig D, Stoddart G. What is population health? American journal of public health. 2003; 93(3): 380–3 (https://doi.org/10.2105/AJPH.93.3.380).
- Kindig D. Understanding population health terminology. The Milbank Quarterly. 2007; 85(1): 139–161 (https://doi.org/10.1111/j.1468-0009.2007.00479.x).
- Karlsen S. Ethnic inequalities in health: the impact of racism. Race Equality Foundation; 2007 (https://raceequalityfoundation.org.uk/wp-content/uploads/2018/03/health-brief3.pdf).
- Public Health England. Beyond the data: Understanding the impact of COVID-19 on BAME groups. Public Health England; 2020 (https://assets.publishing.service.gov.uk/government/uploads/system/uploads/attachment_data/file/892376/COVID_stakeholder_engagement_synthesis_beyond_the_data.pdf).
- Braveman P, Gottlieb L. The social determinants of health: it’s time to consider the causes of the causes. Public Health Reports. 2014; 129(suppl 2): 19–31 (https://doi.org/10.1177/00333549141291S206).
- McGovern L, Miller G, Hughes-Cromwick P. The relative contribution of multiple determinants to health. Health Affairs Health Policy Brief. 2014; 10 (https://doi.org/10.1377/hpb20140821.404487).
- Marmot M, Allen J, Boyce T, Goldblatt P, Morrison J. Health equity in England: the Marmot review 10 years on. Institute for Health Equity; 2020 (www.health.org.uk/publications/reports/the-marmot-review-10-years-on).
- Cassell A, Edwards D, Harshfield A, Rhodes K, Brimicombe J, Payne R, Griffin S. The epidemiology of multimorbidity in primary care: a retrospective cohort study. British Journal of General Practice. 2018; 68(669): e245-51 (https://doi.org/10.3399/bjgp18X695465).
- Stafford M, Steventon A, Thorlby R, Fisher R, Turton C, Deeny S. Understanding the health care needs of people with multiple health conditions. Health Foundation; 2017 (www.health.org.uk/publications/understanding-the-health-care-needs-of-people-with-multiple-health-conditions).
- Barnett K, Mercer SW, Norbury M, Watt G, Wyke S, Guthrie B. Epidemiology of multimorbidity and implications for health care, research, and medical education: a cross-sectional study. The Lancet. 2012; 380(9836): 37–43 (https://doi.org/10.1016/S0140-6736(12)60240-2).
- Mukhtar TK, Bankhead C, Stevens S, Perera R, Holt TA, Salisbury C, Hobbs FR. Factors associated with consultation rates in general practice in England, 2013–2014: a cross-sectional study. British Journal of General Practice. 2018; 68(670): e370–7 (https://doi.org/10.3399/bjgp18X695981).
- Department of Health and Social Care, & Office for National Statistics. DHSC and ONS: Direct and Indirect health impacts of COVID-19 in England – long paper, 9 September 2021. Scientific Advisory Group for Emergencies and Department of Health and Social Care; 2021 (www.gov.uk/government/publications/dhsc-direct-and-indirect-health-impacts-of-covid-19-in-england-long-paper-9-september-2021).
- Gopfert A, Deeny SR, Fisher R, Stafford M. Primary care consultation length by deprivation and multimorbidity in England: an observational study using electronic patient records. British Journal of General Practice. 2021; 71(704): e185–92 (https://doi.org/10.3399/bjgp20X714029).
- Dixon-Woods M, Cavers D, Agarwal S, Annandale E, Arthur A, Harvey J, Hsu R, Katbamna S, Olsen R, Smith L, Riley R. Conducting a critical interpretive synthesis of the literature on access to healthcare by vulnerable groups. BMC medical research methodology. 2006; 6(1): 1–3 (https://doi.org/10.1186/1471-2288-6-35).
- Asaria M, Cookson R, Fleetcroft R, Ali S. Unequal socioeconomic distribution of the primary care workforce: whole-population small area longitudinal study. BMJ open. 2016; 6(1): e008783 (http://doi.org/10.1136/bmjopen-2015-008783).
- Goddard M, Gravelle H, Hole A, Marini G. Where did all the GPs go? Increasing supply and geographical equity in England and Scotland. Journal of health services research & policy. 2010; 15(1): 28–35 (www.jstor.org/stable/pdf/26751117.pdf).
- Centre for Workforce Intelligence. In-depth review of the general practitioner workforce. Department of Health and Social Care, Public Health England, and Health Education England; 2014 (www.gov.uk/government/publications/in-depth-review-of-the-general-practitioner-workforce).
- Nussbaum C, Massou E, Fisher R, Morciano M, Harmer R, Ford J. Inequalities in the distribution of the general practice workforce in England: a practice-level longitudinal analysis. BJGP open. 2021; 5(5) (https://doi.org/10.3399/BJGPO.2021.0066).
- Gershlick B, Charlesworth A. Health and social care workforce: Priorities for the new government. Health Foundation; 2019 (www.health.org.uk/publications/long-reads/health-and-social-care-workforce).
- Eley E, Jackson B, Burton C, Walton E. Professional resilience in GPs working in areas of socioeconomic deprivation: a qualitative study in primary care. British Journal of General Practice. 2018; 68(677): e819–25 (https://doi.org/10.3399/bjgp18X699401).
- Parisi R, Lau YS, Bower P, Checkland K, Rubery J, Sutton M, Giles SJ, Esmail A, Spooner S, Kontopantelis E. Rates of turnover among general practitioners: a retrospective study of all English general practices between 2007 and 2019. BMJ open. 2021; 11(8): e049827 (https://doi.org/10.1136/bmjopen-2021-049827).
- Taylor DH, Leese B. General practitioner turnover and migration in England 1990-94. British Journal of General Practice. 1998; 48(428): 1070–2 (https://bjgp.org/content/bjgp/48/428/1070.full.pdf).
- Shen X, Jiang H, Xu H, Ye J, Lv C, Lu Z, Gan Y. The global prevalence of turnover intention among general practitioners: a systematic review and meta-analysis. BMC family practice. 2020; 21(1): 1–0 (https://doi.org/10.1186/s12875-020-01309-4).
- Buchbinder SB, Wilson M, Melick CF, Powe NR. Primary care physician job satisfaction and turnover. American Journal of Managed Care. 2001; 7(7): 701–16.
- Mosadeghrad AM. Factors influencing healthcare service quality. International journal of health policy and management. 2014; 3(2): 77 (https://doi.org/10.15171/ijhpm.2014.65).
- Dixon-Woods M, Baker R, Charles K, Dawson J, Jerzembek G, Martin G, McCarthy I, McKee L, Minion J, Ozieranski P, Willars J. Culture and behaviour in the English National Health Service: overview of lessons from a large multimethod study. BMJ quality & safety. 2014; 23(2): 106–15 (https://doi.org/10.1136/bmjqs-2013-001947).
- Goodwin N, Dixon A, Poole T, Raleigh V. Improving the quality of care in general practice. The King’s Fund; 2011 (www.kingsfund.org.uk/publications/improving-quality-care-general-practice).
- De Silva D, Bamber J. Improving quality in general practice. Health Foundation; 2014 (www.health.org.uk/publications/improving-quality-in-general-practice).
- Dixon A, Khachatryan A, Wallace A, Peckham S, Boyce T, Gillam S. The Quality and Outcomes Framework (QOF): does it reduce health inequalities? NIHR Service Delivery and Organisation programme; 2011 (www.researchgate.net/publication/259622369).
- Doran T, Fullwood C, Kontopantelis E, Reeves D. Effect of financial incentives on inequalities in the delivery of primary clinical care in England: analysis of clinical activity indicators for the quality and outcomes framework. The Lancet. 2008; 372(9640): 728–36 (https://doi.org/10.1016/S0140-6736(08)61123-X).
- Care Quality Commission. The state of care in general practice 2014 to 2017. Care Quality Commission; 2018 (www.cqc.org.uk/publications/major-report/state-care-general-practice-2014-2017).
- Millett D. Higher deprivation linked to lower CQC ratings, analysis suggests. GP Online; 11 December 2017 (www.gponline.com/higher-deprivation-linked-lower-cqc-ratings-analysis-suggests/article/1452371).
- Morris J. Chart of the week: How does patient experience of general practice vary with deprivation? Nuffield Trust; 2021 (www.nuffieldtrust.org.uk/resource/chart-of-the-week-how-does-patient-experience-of-general-practice-vary-with-deprivation).
- Health Foundation. Health spending as a share of GDP remains at lowest level in a decade. Health Foundation; 2019 (www.health.org.uk/news-and-comment/charts-and-infographics/health-spending-as-a-share-of-gdp-remains-at-lowest-level-in).
- Department of Health. Reducing health inequalities: an action report. Department of Health; 1999.
- HM Treasury, Department of Health. Tackling health inequalities: summary of the 2002 cross-cutting review. Department of Health; 2002.
- Department of Health. Tackling health inequalities: a programme for action. London: Department of Health; 2003.
- UK Government. Welcome to Gov.uk [webpage]. Gov.uk; 2021 (www.gov.uk).
- NHS England. NHS England Home [webpage]. NHS England; 2021 (www.england.nhs.uk).
- UK government. UK Government Web Archive [webpage]. The National Archives; 2021 (www.nationalarchives.gov.uk/webarchive/).
- Iliffe S. The modernisation of general practice in the UK: 1980 to 1995 and beyond. Part II. Postgraduate medical journal. 1996; 72(851): 539 (www.ncbi.nlm.nih.gov/pmc/articles/PMC2398577/pdf/postmedj00021-0029.pdf).
- Talbot RJ. Underprivileged areas and health care planning: implications of use of Jarman indicators of urban deprivation. British Medical Journal. 1991; 302(6773): 383–6 (www.bmj.com/content/bmj/302/6773/383.full.pdf).
- Bajekal M, Alves B, Jarman B, Hurwitz B. Rationale for the new GP deprivation payment scheme in England: effects of moving from electoral ward to enumeration district underprivileged area scores. British Journal of General Practice. 2001; 51(467): 451–5 (https://bjgp.org/content/bjgp/51/467/451.full.pdf).
- The National Health Service (General Medical Services Contracts) Regulations 2004 (www.legislation.gov.uk/uksi/2004/291/contents/made).
- BMA. Focus on the global sum allocation formula (Carr-Hill Formula). BMA; 2015 (www.northstaffslmc.co.uk/website/LMC001/files/Focus-on-the-Global-Sum-Allocation-Formula-July-2015.pdf).
- NHS Employers. Review of the general medical services global sum formula. NHS Employers, BMA; 2007 (https://nanopdf.com/download/review-of-the-gms-global-sum-formula_pdf).
- Department of Health. High quality care for all: NHS next stage review final report. HM Stationery Office; 2008 (www.gov.uk/government/publications/high-quality-care-for-all-nhs-next-stage-review-final-report).
- NHS England. NHS Five Year Forward View. NHS England; 2014 (www.england.nhs.uk/publication/nhs-five-year-forward-view).
- NHS England. Next steps towards primary care co-commissioning. NHS England; 2014 (www.england.nhs.uk/commissioning/wp-content/uploads/sites/12/2014/11/nxt-steps-pc-cocomms.pdf).
- NHS England. General Practice Forward View (GPFV). NHS England; 2016 (www.england.nhs.uk/publication/general-practice-forward-view-gpfv).
- Harker R. NHS Funding: Clinical Commissioning Groups. House of Commons Library; 2019 (https://commonslibrary.parliament.uk/research-briefings/cbp-8399).
- DH Financial Planning and Allocations Division. Resource allocation: weighted capitation formula. Department of Health; 2011 (www.gov.uk/government/publications/resource-allocation-weighted-capitation-formula).
- Buck D, Dixon A. Improving the allocation of health resources in England: How to decide who gets what. The King’s Fund; 2013 (www.kingsfund.org.uk/publications/improving-allocation-health-resources-england).
- Department of Health. The NHS Plan: a plan for investment, a plan for reform. HM Stationery Office; 2000 (available from The National Archives: https://webarchive.nationalarchives.gov.uk/20130124064356/http://www.dh.gov.uk/prod_consum_dh/groups/dh_digitalassets/@dh/@en/@ps/documents/digitalasset/dh_118522.pdf).
- Department of Health. Primary care: delivering the future. HM Stationery Office; 1996.
- Acheson D. Independent inquiry into inequalities in health report. HM Stationery Office; 1998 (www.gov.uk/government/publications/independent-inquiry-into-inequalities-in-health-report).
- Department of Health. Tackling Health Inequalities: 10 Years On. Department of Health; 2009 (www.bris.ac.uk/poverty/downloads/keyofficialdocuments/Tackling%20HE%2010%20years%20on.pdf).
- NHS England. Allocation of resources to NHS England and the commissioning sector for 2014/15 and 2015/16. NHS England; 2013 (www.england.nhs.uk/wp-content/uploads/2013/12/bm-item7.pdf).
- NHS England. Allocations [webpage]. NHS England; 2021 (www.england.nhs.uk/allocations).
- Carr-Hill RA, Sheldon T. Designing a deprivation payment for general practitioners: the UPA (8) wonderland. British Medical Journal. 1991; 302(6773): 393–6 (https://doi.org/10.1136/bmj.302.6773.393).
- Kontopantelis E, Mamas MA, Van Marwijk H, Ryan AM, Bower P, Guthrie B, Doran T. Chronic morbidity, deprivation and primary medical care spending in England in 2015–16: a cross-sectional spatial analysis. BMC medicine. 2018; 16(1): 1–3 (https://doi.org/10.1186/s12916-017-0996-0).
- Levene LS, Baker R, Wilson A, Walker N, Boomla K, Bankart MJ. Population health needs as predictors of variations in NHS practice payments: a cross-sectional study of English general practices in 2013–2014 and 2014–2015. British Journal of General Practice. 2017; 67(654): e10–9 (https://doi.org/10.3399/bjgp16X688345).
- Levene LS, Baker R, Bankart J, Walker N, Wilson A. Socioeconomic deprivation scores as predictors of variations in NHS practice payments: a longitudinal study of English general practices 2013–2017. British Journal of General Practice. 2019; 69(685): e546–54 (https://doi.org/10.3399/bjgp19X704549).
- Ashworth M, L’Esperance V, Round T. Primary care funding entrenches health inequalities: time for a rethink. British Journal of General Practice. 2021; 71(704): 102–104 (https://doi.org/10.3399/bjgp21X714965).
- L’Esperance V, Schofield P, Ashworth M. The provision of additional services in primary care: a cross-sectional study of incentivised additional services, social deprivation, and ethnic group. BJGP open. 2021; 5(1) (https://doi.org/10.3399/bjgpopen20X101141).
- Barr B, Bambra C, Whitehead M. The impact of NHS resource allocation policy on health inequalities in England 2001–11: longitudinal ecological study. BMJ. 2014;348 (https://doi.org/10.1136/bmj.g3231).
- Barr B, Taylor-Robinson D. Poor areas lose out most in new NHS budget allocation. BMJ. 2014; 348 (https://doi.org/10.1136/bmj.g160).
- House of Commons Library. New CCG funding allocations – mapped [webpage]. parliament.uk; 2014 (https://commonslibrary.parliament.uk/new-ccg-funding-allocations-mapped).
- Gardiner L, Everard K. Primary medical care – new workload formula for allocations to CCG areas. NHS England; 2016 (www.england.nhs.uk/wp-content/uploads/2016/04/5-primary-care-allctins-16-17.pdf).
- Department of Health. Choice and opportunity. Primary care: the future. HM Stationery Office; 1996.
- Department of Health. Personal medical services: PMS Pilots under the NHS (Primary Care) Act 1997. Part 1 Guidance: imtroduction to PMS. Department of Health; 1997 (available from the National Archives https://webarchive.nationalarchives.gov.uk/ukgwa/20030731113308/http:/www.doh.gov.uk:80/pricare/pms4thpart1.pdf)
- Hann M, Gravelle H. The maldistribution of general practitioners in England and Wales: 1974–2003. British Journal of General Practice. 2004; 54(509): 894–8 (https://bjgp.org/content/bjgp/54/509/894.full.pdf).
- Department of Health. National Evaluation of First Wave NHS Personal Medical Services Pilots. Department of Health; 2002 (available from the National Archives: https://webarchive.nationalarchives.gov.uk/ukgwa/20021008002905/http://www.doh.gov.uk:80/pricare/pmsfirstwaveeval02.htm).
- Williams J, Petchey R, Gosden T, Leese B, Sibbald B. A profile of PMS salaried GP contracts and their impact on recruitment. Family Practice. 2001; 18(3): 283–7 (https://doi.org/10.1093/fampra/18.3.283).
- Ellul I. Salaried doctor’s scheme. Letter to Chief Executives of Health Authorities and Regional Office Primary Care Leads. NHS Executive; 1997 (available from the National Archives: https://webarchive.nationalarchives.gov.uk/ukgwa/20100407194152/http://www.dh.gov.uk/en/Publicationsandstatistics/Lettersandcirculars/Familyhealthservicesletters/DH_4017753).
- Dodge I. Personal Medical Services Pilots – 5th Wave Announcement. Letter to Health Authority and Primary Care Trust Chief Executives and Directors of Finance. Department of Health; 2002 (available from The National Archives: https://webarchive.nationalarchives.gov.uk/20030731220212/http:/www.doh.gov.uk:80/pricare/pms5thwave.pdf).
- Rolewicz L. What does the GP workforce look like now? Nuffield Trust; 2021 (www.nuffieldtrust.org.uk/news-item/what-does-the-gp-workforce-look-like-now).
- Tan S, Mays N. Impact of initiatives to improve access to, and choice of, primary and urgent care in England: a systematic review. Health policy. 2014; 118(3): 304–15 (http://dx.doi.org/10.1016/j.healthpol.2014.07.011).
- Department of Health. Building on the Best: Choice, Responsiveness and Equity in the NHS. HM Stationery Office; 2003 (available from the National Archives: https://webarchive.nationalarchives.gov.uk/ukgwa/20100330190840/http:/www.dh.gov.uk/en/Publicationsandstatistics/Publications/PublicationsPolicyAndGuidance/DH_4075292).
- Greaves F, Laverty AA, Pape U, Ratneswaren A, Majeed A, Millett C. Performance of new alternative providers of primary care services in England: an observational study. Journal of the Royal Society of Medicine. 2015; 108(5): 171–83 (https://doi.org/10.1177/0141076815583303).
- Department of Health. World Class Commissioning: vision. Department of Health; 2007 (available from the National Archives: https://webarchive.nationalarchives.gov.uk/ukgwa/20130107105354/http://www.dh.gov.uk/prod_consum_dh/groups/dh_digitalassets/documents/digitalasset/dh_080952.pdf).
- Department of Health. Health reform in England: update and commissioning framework. Department of Health; 2006 (available from the National Archives: https://webarchive.nationalarchives.gov.uk/ukgwa/20130107105354/http://www.dh.gov.uk/assetRoot/04/13/72/27/04137227.pdf).
- Smith J, Curry N. Commissioning. In: Mays N, Jones L. Understanding new labour’s market reforms of the English NHS. The King’s Fund; 2011 (www.kingsfund.org.uk/sites/default/files/chapter-3-commissioning-new-labours-market-reforms-sept11.pdf).
- Checkland K, Hammond J, Sutton M, Coleman A, Allen P, Mays N, Mason T, Wilding A, Warwick-Giles L, Hall A. Understanding the new commissioning system in England: contexts, mechanisms and outcomes. PRUComm; 2018 (https://prucomm.ac.uk/assets/uploads/blog/2018/11/Understanding-the-new-commissioning-system-in-England-FINAL-REPORT-PR-R6-1113-25001-post-peer-review-v2.pdf).
- Department of Health. The new NHS: modern, dependable. HM Stationery Office; 1997 (https://assets.publishing.service.gov.uk/government/uploads/system/uploads/attachment_data/file/266003/newnhs.pdf).
- Mays N, Jones L. Understanding new labour’s market reforms of the English NHS. The King’s Fund; 2011 (www.kingsfund.org.uk/publications/understanding-new-labours-market-reforms-english-nhs).
- Department of Health. Shifting the Balance of Power within the NHS. HM Stationery Office; 2001 (https://webarchive.nationalarchives.gov.uk/ukgwa/20120503232759/http:/www.dh.gov.uk/prod_consum_dh/groups/dh_digitalassets/@dh/@en/documents/digitalasset/dh_4076522.pdf).
- Barnes M, Bauld L, Benzeval M, Mackenzie M, Sullivan H, Judge K. Health Action Zones: partnerships for health equity. Routledge; 2012.
- Judge K, Barnes M, Bauld L, Benzeval M, Killoran A, Robinson R, Wigglesworth R, Zeilig H. Health action zones: learning to make a difference. Personal Social Services Research Unit; 1999 (www.pssru.ac.uk/pub/dp1546.pdf).
- Belsky J, Melhuish E, Barnes J. Research and policy in developing an early years’ initiative: the case of Sure Start. International Journal of Child Care and Education Policy. 2008; 2(2): 1–3 (https://doi.org/10.1007/2288-6729-2-2-1).
- Melhuish EC, Belsky J, Leyland AH. National evaluation of Sure Start local programmes: An economic perspective. Department for Education; 2011 (www.gov.uk/government/publications/national-evaluation-of-sure-start-local-programmes-an-economic-perspective).
- NHS England. Integrated Care Systems: design framework. NHS England; 2021 (www.england.nhs.uk/wp-content/uploads/2021/06/B0642-ics-design-framework-june-2021.pdf).
- Lewis R, Gillam S, Jenkins C. Personal Medical Services Pilots: Modernising primary care. King’s Fund; 2001.
- Ding A, Hann M, Sibbald B. Profile of English salaried GPs: labour mobility and practice performance. British Journal of General Practice. 2008; 58(546): 20–5 (https://doi.org/10.3399/bjgp08X263776).
- Spencer A, Riley AJ, Carter YH, Meads G, Underwood MR, McGuire A. Costs and consequences of Personal Medical Services (PMS): a case study approach to the national evaluation of PMS in the UK. Primary Health Care Research & Development. 2005; 6(3): 232–43 (https://doi.org/10.1191/1463423605pc246oa).
- Campbell S, Steiner A, Robison J, Webb D, Raven A, Richards S, Roland M. Do personal medical services contracts improve quality of care? A multi-method evaluation. Journal of Health Services Research & Policy. 2005; 10(1): 31–9 (https://doi.org/10.1177/135581960501000108).
- NHS England. Review of PMS contracts. NHS England; 2014 (www.england.nhs.uk/wp-content/uploads/2014/02/rev-pms-cont.pdf).
- Smith J, Mays N, Dixon J, Goodwin N, Lewis R, McClelland S, McLeod H, Wyke S. A review of the effectiveness of primary care-led commissioning and its place in the NHS. The Health Foundation; 2004 (www.health.org.uk/publications/review-of-the-effectiveness-of-primary-care-led-commissioning-and-its-place-in-the-nhs).
- Smith J, Curry N, Mays N, Dixon J. Where next for commissioning in the English NHS? The King’s Fund, Nuffield Trust; 2010 (https://researchonline.lshtm.ac.uk/id/eprint/3828/1/where_next_for_commissioning_in_the_english_nhs_230310.pdf).
- Regmi K, Mudyarabikwa O. A systematic review of the factors-barriers and enablers-affecting the implementation of clinical commissioning policy to reduce health inequalities in the National Health Service (NHS), UK. Public Health. 2020; 186: 271–82 (https://doi.org/10.1016/j.puhe.2020.07.027).
- Smith KE, Bambra C, Joyce KE, Perkins N, Hunter DJ, Blenkinsopp EA. Partners in health? A systematic review of the impact of organizational partnerships on public health outcomes in England between 1997 and 2008. Journal of Public Health. 2009; 31(2): 210–21 (https://doi.org/10.1093/pubmed/fdp002).
- Perkins N, Smith K, Hunter DJ, Bambra C, Joyce K. ‘What counts is what works’? New labour and partnerships in public health. Politics Policy. 2010; 38(1): 101–17 (https://doi.org/10.1332/030557309X458425).
- Barr B, Higgerson J, Whitehead M. Investigating the impact of the English health inequalities strategy: time trend analysis. BMJ; 2017 (https://doi.org/10.1136/bmj.j3310).
- Robinson T, Brown H, Norman PD, Fraser LK, Barr B, Bambra C. The impact of new Labour's English health inequalities strategy on geographical inequalities in infant mortality: a time-trend analysis. Journal of Epidemiology & Community Health. 2019;73(6):564–8 (https://doi.org/10.1136/jech-2018-211679).
- Alderwick H, Hutchings A, Briggs A, Mays N. The impacts of collaboration between local health care and non-health care organizations and factors shaping how they work: a systematic review of reviews. BMC public health. 2021; 21(1): 1–6 (https://doi.org/10.1186/s12889-021-10630-1).
- Department of Health and Social Care. £1.5 billion to deliver Government commitment for 50 million more general practice appointments [webpage]. Gov.uk; 2020 (www.gov.uk/government/news/15-billion-to-deliver-government-commitment-for-50-million-more-general-practice-appointments).
- Department of Health. Resource Allocation Working Paper 5: A history of GP distribution. HM Stationery Office; 2000 (available from The National Archives: https://webarchive.nationalarchives.gov.uk/20061023164628/http:/www.dh.gov.uk/assetRoot/04/10/94/04/04109404.pdf).
- Amos D. Primary Care Workforce Planning Framework. Letter to Chief Executives of Primary Care Trusts, Workforce Development Confederations, and shadow Strategic Health Authorities. Department of Health; 2002 (available from The National Archives: https://webarchive.nationalarchives.gov.uk/20040301063021/http:/www.dh.gov.uk:80/assetRoot/04/06/64/62/04066462.pdf).
- Medical Practices Committee. Final Annual Report: 1948–2002. HM Stationery Office; 2002 (available from The National Archives: https://webarchive.nationalarchives.gov.uk/20040216111010/http:/www.doh.gov.uk:80/mpc/finalreport.pdf).
- Amos D, Doran K. Shifting the balance of power: new arrangements for managing general medical practitioner appointments. Letter to Chief Executives of Primary Care Trusts and Workforce Development Confederations. Department of Health; 2002 (available from The National Archives; https://webarchive.nationalarchives.gov.uk/20030731075437/http:/www.doh.gov.uk:80/pricare/mpc/celettermar02.pdf).
- Department of Health. Medical Education England (MEE): governance and terms of reference. Department of Health; 2005 (available from The National Archives: https://webarchive.nationalarchives.gov.uk/20120903131941/http://www.mee.nhs.uk/pdf/Governance%20and%20Terms%20of%20Reference.pdf).
- Department of Health. NHS GP “Golden Hello” Scheme. Department of Health; 2002 (available from The National Archives: https://webarchive.nationalarchives.gov.uk/20050323225913/http:/www.dh.gov.uk/assetRoot/04/06/55/61/04065561.pdf).
- Department of Health. Framework for the Primary Care Development Scheme [webpage]. Department of Health; 2005 (available from The National Archives: https://webarchive.nationalarchives.gov.uk/20060117030522/http://www.dh.gov.uk/PublicationsAndStatistics/Publications/PublicationsPolicyAndGuidance/PublicationsPolicyAndGuidanceArticle/fs/en?CONTENT_ID=4118329&chk=9xhg98).
- Royal College of General Practitioners, BMA, NHS England and Health Education England. Building the Workforce – the New Deal for General Practice. NHS England; 2015 (www.england.nhs.uk/commissioning/wp-content/uploads/sites/12/2015/01/building-the-workforce-new-deal-gp.pdf).
- Price T. Targeted investment in recruiting returning doctors pilots for 2016. Royal College of General Practitioners, BMA, NHS England and Health Education England. (available from the Internet Archive: https://web.archive.org/web/20160830170752/https://www.england.nhs.uk/commissioning/wp-content/uploads/sites/12/2016/05/targeted-invstmnt-recruit-return.pdf).
- NHS England. Targeted Investment in Recruiting Returning Doctors Scheme [webpage]. NHS England; 2017 (available from the Internet Archive: https://web.archive.org/web/20170907234344/https://www.england.nhs.uk/gp/gpfv/workforce/returning-to-practice/returning-doctors).
- The General Practice (GP) National Recruitment Office. Targeted Enhanced Recruitment Scheme in England: FAQs for GP Applicants (2021–22) [webpage]. Health Education England; 2021 (https://gprecruitment.hee.nhs.uk/Recruitment/TERS/England).
- NHS England. Targeted Enhanced Recruitment Scheme [webpage]. NHS England; 2021 (www.england.nhs.uk/gp/the-best-place-to-work/starting-your-career/recruitment).
- Dale J, Russell R, Harkness F, Wilkie V, Aiello M. Extended training to prepare GPs for future workforce needs: a qualitative investigation of a 1-year fellowship in urgent care. British Journal of General Practice. 2017; 67(662): e659–67 (https://doi.org/10.3399/bjgp17X691853).
- West Midlands Academic Health Science Network. Post-Certificate of Completion of Training (CCT) Fellowships [webpage]. West Midlands Academic Health Science Network; 2021 (https://www.wmahsn.org/programmes/view/post-certificate-of-completion-of-training-cct-fellowships).
- Bryce C, Russell R, Dale J. Learning from the transfer of a fellowship programme to support primary care workforce needs in the UK: a qualitative study. BMJ open. 2019; 9(1): e023384 (https://doi.org/10.1136/bmjopen-2018-023384).
- NHS England and Health Education England. Post-CCT GP Fellowships – 2020/21. Health Education Yorkshire and Humber; 2020 (https://yorksandhumberdeanery.nhs.uk/sites/default/files/post_cct_fellowships_202021.pdf).
- NHS England and Health Education England. Trailblazer post-CCT fellowship Briefing 2020/21. Health Education Yorkshire and Humber; 2020 (https://yorksandhumberdeanery.nhs.uk/sites/default/files/trailblazer_post-cct_fellowship_briefing_2020-21.pdf).
- Steen R, Walton E, Patterson D. Jumping in at the Deep End: supporting young GPs working in deprivation. British Journal of General Practice. 2020; 70(692): 132–3 (https://doi.org/10.3399/bjgp20X708641).
- NHS England. International GP Recruitment Programme [webpage]. NHS England; 2017 (available from the Internet Archive: https://web.archive.org/web/20170907234724/https://www.england.nhs.uk/gp/gpfv/workforce/building-the-general-practice-workforce/international-gp-recruitment).
- Royal College of General Practitioners, NHS England. Expansion of the GP international recruitment programme. NHS England; 2020 (available from the Internet Archive https://web.archive.org/web/20200611045014/https://www.england.nhs.uk/wp-content/uploads/2017/08/expansion-gp-international-recruitment-programme.pdf).
- NHS England. Targeted Enhanced Recruitment Scheme [webpage]. NHS England; 2021 (www.england.nhs.uk/gp/the-best-place-to-work/starting-your-career/recruitment).
- BMA. The general practice forward view: two years on. British Medical Association; 2018 (www.pulsetoday.co.uk/wp-content/uploads/c_files/uploads/n/g/t/BMA---The-GPFV-two-years-on.pdf).
- Health Education England. Review Body on Doctors’ and Dentists’ Remuneration. Health Education England; 2021 (https://www.hee.nhs.uk/sites/default/files/documents/Written%20evidence%20to%20Doctors%20and%20Dentists%20Review%20Body%20-%20202021.pdf).
- Department of Health and Social Care. Third record-breaking year for GP trainee recruitment [webpage]. Gov.uk; 2020 (www.gov.uk/government/news/third-record-breaking-year-for-gp-trainee-recruitment).
- NHS England. International recruitment sites [webpage]. NHS England; 2017 (available from the Web Archive: https://web.archive.org/web/20170914015651/https://www.england.nhs.uk/gp/gpfv/workforce/building-the-general-practice-workforce/international-gp-recruitment/international-recruitment-sites).
- National Audit Office. Innovation in the NHS: Local Improvement Finance Trusts. HM Stationery Office; 2005 (available from the National Archives: https://webarchive.nationalarchives.gov.uk/ukgwa/20170207052351/https://www.nao.org.uk/wp-content/uploads/2005/05/050628.pdf).
- HM Treasury. Modern Public Services for Britain: Investing in Reform Government. Comprehensive Spending Review: New Public Spending Plans 1999–2002. HM Stationery Office; 1998 (https://assets.publishing.service.gov.uk/government/uploads/system/uploads/attachment_data/file/260743/4011.pdf).
- HM Treasury. Public Services for the Future: Modernisation, Reform, Accountability. Comprehensive Spending Review: Public Service Agreements 1999–2002. HM Stationery Office; 1998 (https://assets.publishing.service.gov.uk/government/uploads/system/uploads/attachment_data/file/260759/4181.pdf).
- Department of Health. The Government’s Expenditure Plans 2001–2002 to 2003–2004 and Main Estimates 2001–2002. HM Stationery Office; 2001 (www.gov.uk/government/publications/department-of-health-the-governments-expenditure-plans-2001-2002-to-2003-2004).
- Committee of Public Accounts. NHS Local Improvement Finance Trusts. HM Stationery Office; 2006 (https://publications.parliament.uk/pa/cm200506/cmselect/cmpubacc/562/562.pdf).
- Department of Health. Our health, our care, our say: A new direction for community services. HM Stationery Office; 2006 (www.gov.uk/government/publications/our-health-our-care-our-say-a-new-direction-for-community-services).
- Department of Health. Fairness in Primary Care – Tranche One [webpage]. Department of Health; 2007 (available from the National Archives: https://webarchive.nationalarchives.gov.uk/ukgwa/20120503090407/http://www.dh.gov.uk/en/Aboutus/Procurementandproposals/Tenders/Informationaboutprocess/DH_074670).
- Department of Health. Fairness in Primary Care – Tranche Two [webpage]. Department of Health; 2007 (available from the National Archives: https://webarchive.nationalarchives.gov.uk/ukgwa/20120503090408/http://www.dh.gov.uk/en/Aboutus/Procurementandproposals/Tenders/Informationaboutprocess/DH_076242).
- Department of Health. Equitable Access to Primary Medical Care services (EAPMC): procurement at PCTs [webpage]. Department of Health; 2010 (available from the National Archives: https://webarchive.nationalarchives.gov.uk/ukgwa/+/www.dh.gov.uk/en/Aboutus/Procurementandproposals/Procurement/ProcurementatPCTs/index.htm).
- Monitor. Walk-in centre review: final report and recommendations. Department of Health; 2014 (https://assets.publishing.service.gov.uk/government/uploads/system/uploads/attachment_data/file/283778/WalkInCentreFinalReportFeb14.pdf).
- Naylor R. NHS Property and Estates: Why the estate matters for patients. Department of Health; 2017 (www.gov.uk/government/publications/nhs-property-and-estates-naylor-review).
- NHS England and NHS Improvement. General Practices Premises: Policy Review. NHS England; 2019 (www.england.nhs.uk/wp-content/uploads/2019/06/general-practice-premises-policy-review.pdf).
- Amion Consulting. The impact of the Local Improvement Finance Trust Programme. NHS England, Department of Health; 2013 (https://communityhealthpartnerships.co.uk/wp-content/uploads/2020/06/Amion-Report-The-Impact-of-the-LIFT-Programme.pdf).
- Ellins JL, Ham CJ, Parker H. Choice and competition in primary care: much ado about nothing? University of Birmingham; 2008 (www.birmingham.ac.uk/Documents/college-social-sciences/social-policy/HSMC/publications/PolicyPapers/Policy-paper-2.pdf).
- NHS England. Consultant-led referral to treatment waiting times [webpage]. NHS England; 2021 (www.england.nhs.uk/statistics/statistical-work-areas/rtt-waiting-times).
- Fisher R, Alderwick H. New plan for supporting general practice in England. BMJ. 2021; 375: n2585 (https://doi.org/10.1136/bmj.n2585).
- BMA. Thousands of overworked doctors plan to leave the NHS, BMA finds [webpage]. GMA; 2021 (www.bma.org.uk/bma-media-centre/thousands-of-overworked-doctors-plan-to-leave-the-nhs-bma-finds).
- Hutchinson J, Hammond J, Sutton M, Checkland K. Equity and the funding of Primary Care Networks. British Journal of General Practice. 2021; 71(710): 422–4 (https://doi.org/10.3399/bjgp21X717029).
- Oxfordshire Clinical Commissioning Group. Developing the Primary Care Framework at Locality Level. Oxfordshire Clinical Commissioning Group; 2017 (www.oxfordshireccg.nhs.uk/documents/meetings/opccc/2017/09/2017-09-05-Paper-6-Developing-the-Primary-Care-Framework-at-Locality-Level.pdf).
- BMA. Enhanced services GP practices can seek funding for [webpage]. BMA; 2021 (www.bma.org.uk/advice-and-support/gp-practices/gp-service-provision/enhanced-services-gp-practices-can-seek-funding-for).
- Verma P, Ford JA, Stuart A, Howe A, Everington S, Steel N. A systematic review of strategies to recruit and retain primary care doctors. BMC Health Services Research. 2016; 16(1): 1–25 (https://doi.org/10.1186/s12913-016-1370-1).
- Merrifield N. GP trainee numbers on track to beat records again with 7% rise in acceptances. PulseToday; 6 July 2021 (www.pulsetoday.co.uk/news/education-and-training/gp-trainee-numbers-on-track-to-beat-records-again-with-7-rise-in-acceptances).
- Thorlby R, Tallack C, Finch D, Idriss O, Rocks S, Kraindler J, Shembavnekar N, Alderwick H. Spending Review 2020: Priorities for the NHS, social care and the nation’s health. Health Foundation; 2020 (www.health.org.uk/publications/long-reads/spending-review-2020).
- Conservative Party. Our Plan: Conservative Manifesto 2019. Conservative Party; 2019 (www.conservatives.com/our-plan).
- NHS England. The Equality and Health Inequalities Hub [webpage]. NHS England; 2021 (www.england.nhs.uk/about/equality/equality-hub).