Key points
- This briefing presents the findings of an evaluation into the early effects on hospital use from the first phase of an enhanced support initiative for older people living in 15 nursing or residential care homes in Wakefield between February 2016 and March 2017.
- The enhanced support was commissioned by Wakefield Enhanced Health in Care Homes and was rolled out in two phases. The first phase involved 15 care homes in the area covered by Wakefield Clinical Commissioning Group (CCG) between February 2016 and March 2017. The enhanced support had three main strands: voluntary sector engagement, a multidisciplinary team (MDT) and enhanced primary care support. It aimed to improve coordination of care, reduce unnecessary hospital admissions, shorten time spent in hospital, reduce isolation, and make sure that all residents had an end-of-life care plan with a preferred place of dying.
- The Improvement Analytics Unit examined the impact of the enhanced support initiative on hospital use among 526 residents aged 65 or over living in the 15 vanguard nursing and residential care homes in Wakefield between February 2016 and March 2017. The care home residents receiving enhanced support were compared with a local matched control group, which consisted of broadly similar individuals living in care homes of similar type in Wakefield CCG who were not receiving the enhanced support during the period of the evaluation. We examined the hospital use of care home residents for an average of six months.
- We estimated that vanguard residents experienced 27% fewer potentially avoidable admissions than the matched control group. This effect was stronger looking at only those residents that had been resident in a care home for three months or longer, where we estimated that vanguard residents experienced 38% fewer potentially avoidable emergency admissions than the matched control group. However, there was no conclusive evidence that overall emergency admissions or A&E attendances differed between the groups.
- We ensured that the matched control group was as similar as possible to the vanguard residents in the study on observed characteristics (eg demographic mix, co-morbidities and past hospital activity). Vanguard and control residents may, however, have still differed in unobservable ways (for instance in degree of family support). Furthermore, we did not identify as many care home residents as expected and we are unable to determine whether the missing residents (vanguard and non-vanguard) were different to the residents included the study. This could have affected the results.
- The purpose of this evaluation was to explore whether there were any early signals of changes in hospital use to inform local learning and improvement. We did not see a significant difference in overall hospital admissions or A&E attendances among residents receiving the enhanced support although there were fewer potentially avoidable emergency admissions. It could be that the enhanced support initiative did not have an effect on overall hospital use or the study was not able to detect an effect due to the short study period. However, the results are promising on potentially avoidable admissions, which may reflect the MDT’s targeted care for residents who needed additional support that may otherwise result in hospital use, and training of care home staff on issues such as falls and pressure sore prevention.
- It is important to remember that this evaluation was conducted approximately one year after the introduction of the enhanced support and does not evaluate the effect after March 2017. Research has highlighted that implementing complex interventions needs time to take effect. This is so that teams introducing these changes can be supported to work through implementation challenges and learn from experience and evaluation. For example, evidence on implementation of the GP local enhanced service (LES) suggests that during the period covered by the study it did not have much influence on the working patterns of the GP practices. It is also important to remember that this evaluation did not examine the impact of the enhanced support in improving the coordination of care or improving residents’ health, social isolation, experience of care and quality of life. These are all areas that the enhanced support was aiming to improve and the value of the enhanced support might relate to improving these other areas in addition to emergency hospital admissions.
- Good quality data are essential for evaluation. Further analysis would benefit from access to further linked data sets, for example linking Secondary Uses Service (SUS) data to data on MDT referrals to improve the understanding of the effect of the MDT over and above the other elements of the vanguard, which would provide additional insight for policymakers. This should ideally be done in combination with qualitative research to better understand how MDTs, GP enhanced support and other elements interact with the local context in Wakefield.
The Improvement Analytics Unit
The Improvement Analytics Unit (IAU) is an innovative partnership between NHS England and the Health Foundation that provides robust analysis to help health services improve care for patients. We use advanced statistical techniques to provide evidence of whether local change programmes are having an impact on improving the quality and efficiency of care. This is done by assessing whether the care outcomes for patients in a local change programme – for example, as part of a new care model or a sustainability and transformation partnership – are different in any significant way from the outcomes of patients who have not experienced a similar initiative.
Our aim is that our analysis helps NHS providers, their partners and commissioners to identify whether change has happened following implementation of a new initiative, so that they can identify whether the initiative is working well or needs to change to succeed.
For more information see: www.health.org.uk/IAU
Background and summary of local evaluation
In March 2015 Wakefield CCG, in partnership with local health and social care providers, formed an Enhanced Health in Care Homes (EHCH) vanguard. This was one of the new care models that was announced in the Five year forward view for the NHS in England.
The aim of NHS England’s EHCH vanguard model was ‘[…] to ensure the provision of high-quality care within care homes […] to ensure that, wherever possible, individuals who require support to live independently have access to the right care and the right health services in the place of their choosing and to ensure that we make the best use of resources […] whilst ensuring the best care for residents’.
The CCG states that the aim was ‘to ensure that local people receive person-centred coordinated care, which is delivered at the right time, in the right place and by the right person. ’
The first phase of the vanguard covered 15 nursing and residential homes with a total of 999 beds. Eleven care homes started receiving the enhanced support in February 2016 and an additional four in September 2016. There were also two supported living schemes that received some parts of the enhanced support. The second phase of the vanguard started in April 2017 when 12 more care homes and four supported living schemes joined. This evaluation focuses on the 15 care homes in the first phase of the vanguard (referred to as vanguard care homes in this report).
There was a separate new care models vanguard – a multispecialty community provider (MCP) – in West Wakefield established at the same time as the EHCH (March 2015). The MCP aimed to move specialist care out of hospital and into the community but there was no focus on older people in care homes.
In April 2017, at the start of the second phase of the care home vanguard, the care home vanguard merged with Wakefield’s MCP vanguard to become part of the Connecting Care programme.
What changes were introduced in vanguard care homes?
The Wakefield care home vanguard identified six overarching areas within their Care Home Outcomes Framework that they were hoping to impact:
• Care is co-ordinated and seamless.
• Urgent care should only be provided to those who require it.
• Improve management of long-term conditions and falls.
• Improve management of end-of-life care.
• Increase proactive case management and personalised care planning.
• All staff understand the system and work in it effectively.’
The quantitative elements measured within the urgent care area included ambulance call outs, emergency bed days, A&E attendances and emergency admissions.
A timeline of some milestones can be found in Figure 1.
Figure 1. Timeline
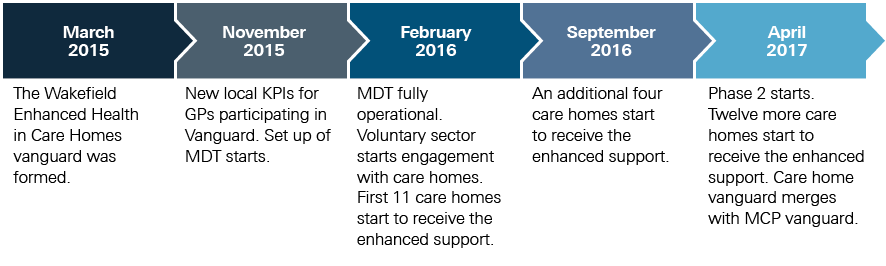
Source: analysis by the Improvement Analytics Unit
Each strand of the care home vanguard is described in detail below.
Voluntary sector
Voluntary organisations set up social activities to get residents out and about, such as health walks and tea dances. Other activities took place inside care homes, for example visits from a therapy dog and a choir. Age UK’s Pull Up A Chair programme filmed interviews with residents, giving them a chance to talk about their life. Where this revealed a need for extra help, the older person would be signposted to relevant support services. The Portrait of a Life toolkit encouraged residents to talk about their life story as a way of helping care home staff tailor their support to that person’s life experiences. Carers Wakefield was also involved, providing information, advice and support and liaising with other services when necessary.
Multidisciplinary team
A new multidisciplinary team (MDT) that would be proactive in planning and managing care for the vanguard residents was set up. The team used a screening process to identify care needs which, if not met, could lead to residents needing inappropriate hospital care. The team (comprising professionals from areas including mental health, physiotherapy and nursing) was co-located and met weekly to discuss case management and would proactively see residents that needed more support. The MDT also carried out falls risk assessments at care homes and delivered 49 training sessions covering 286 care home staff. The training covered falls prevention, falls management, screening for malnutrition and swallowing problems, dementia awareness, and pressure sore prevention. Initially, the MDT planned to screen all vanguard residents for unmet needs, but from April 2016 this was narrowed down to screening only those residents deemed high risk by care home staff. There was no common definition of high risk used by all care homes and in some care homes almost all residents were referred to the MDT whereas in others only a few were referred. If extra care needs were identified, the MDT could refer to other members of the MDT, for example a physiotherapist or other services in the community. According to estimates from Wakefield CCG, around 400 residents were referred to the MDT between November 2015 and April 2017.
Primary care
Twenty-six out of roughly 40 GP practices were selected to participate in the vanguard, based on having at least one patient living in a vanguard care home.
All GPs in Wakefield, not just the ones affiliated with the vanguard, already visited their care home patients when required even before the vanguard started and continued to do so. The frequency of visits differed between practices and was largely based on the practice’s relationship with the care home and the vanguard. The vanguard set out to implement a ‘one GP practice one care home’ model, which was not achieved during the period of the study.
Local key performance indicators (KPIs) were introduced in November 2015 specifically for the GPs in the vanguard. The new KPIs included, for example, face-to-face consultation within 14 days of registering a new care home resident, a full health care plan within eight weeks of registering and emergency admission reviews within seven days of a discharge letter being received. Additional payments for the care outlined in the local KPIs only related to residents in the 15 vanguard care homes. However, most of these local KPIs were already part of the standard contract for all GPs.
This means that any benefit derived from care delivered by GPs for residents living in vanguard care homes compared to those living in non-vanguard care homes in Wakefield was unlikely to be substantially different.
What impact were these changes expected to have?
The enhanced care package was expected to improve coordination of care through closer working between care home staff, GPs and the MDT. Access to the MDT and greater engagement from GPs was expected to reduce unnecessary emergency admissions and speed up the discharge process for residents admitted to hospital (thereby reducing the number of hospital bed days). The MDT was expected to improve case management and personalised care planning, and make sure that all residents had an end-of-life care plan that included their preferred place of dying. Training for care home staff aimed to reduce accidents and deterioration of residents’ health that might result in hospital attendance or admissions. The voluntary sector activities were expected to reduce the isolation experienced by older people but not necessarily have a strong impact on hospital use.
* Partners include the Mid Yorkshire Hospitals NHS trust, South West Yorkshire Partnership NHS Foundation Trust, Yorkshire Ambulance Service NHS Trust, Wakefield Council, Wakefield District and Housing, Age UK Wakefield District, Nova and Carers Wakefield and District.
About this evaluation and analysis
This evaluation was conducted by the Improvement Analytics Unit – a partnership between the Health Foundation and NHS England that aims to provide local teams with robust information on the impact of initiatives to improve care, in order to inform ongoing improvement efforts. The evaluation was conducted after the end of the first phase of the vanguard implementation, and aimed to provide insights that, when combined with other local evidence on progress made on other objectives, would inform the development and continuous improvement of the services provided by the vanguard. Preliminary findings from the analysis were first shared with Wakefield CCG in April 2018. Analysis was conducted according to a Statistical Analysis Protocol (SAP), which was subject to independent academic peer reviews and developed with and agreed by Wakefield CCG before analysis began.
The evaluation assessed whether the enhanced care package affected hospital use among residents aged 65 or over living in the 15 vanguard nursing and residential care homes in Wakefield during phase 1 of the intervention (14 February 2016 to 19 March 2017). Although the phase 1 care homes continued to receive the enhanced support after March 2017, this study only evaluated the first period, as it was expected that the intervention was likely to have changed as more care homes started to receive the enhanced support.
We assessed the impact of the enhanced care package over and above the effect of other services available in the area, including the enhanced primary care. We compared the hospital use of vanguard residents to a ‘local matched control group’ made up of residents with similar characteristics living in care homes of similar type in Wakefield CCG that were not receiving the enhanced support. Both residents that moved into the care home before the enhanced care package was introduced (‘existing residents’) and those who moved in after (‘new residents’) were included in the study.
This study does not assess the impact of the package on older people’s quality of life, the coordination of care or improving residents’ health or social isolation. These are all areas that the enhanced support was aiming to improve and the value of the enhanced support might relate to improving these other areas in addition to hospital use.
We carried out subgroup analyses to see if there were differences in outcomes between existing and new residents. Many people move into a care home after a crisis such as a fall or an acute illness., New residents would have moved to a new environment and would most likely still have been affected by what made them move into a care home, whereas existing residents would have had time to settle into the care home by the time the study started. By analysing the groups separately, we aimed to get a better understanding of hospital activity at different stages of a person’s care home stay.
Once we had access to the data, we found that about a third of residents were in the study for less than three months. As a sensitivity analysis, we therefore looked at the effect of the care package on vanguard residents that were in the study for at least three months.
Data used in the analysis
The Improvement Analytics Unit has access to pseudonymised data from the Secondary Uses Service (SUS) – a national, person-level database that is closely related to the widely used Hospital Episode Statistics (HES). SUS data contain information on A&E attendances, inpatient admissions and outpatient appointments that are funded by the NHS in England, but unfortunately do not record accurately whether an individual resides in a care home. Therefore, the unit needed a data set containing information on the residents of care homes, and a method of linking that data to the SUS database.
This was assembled by the Arden & Greater East Midlands Data Services for Commissioners Regional Office (Arden & GEM DSCRO), the National Commissioning Data Repository in NHS England and the Improvement Analytics Unit. Care home residents were identified using a combination of monthly care home registration data published by the Care Quality Commission (CQC) and monthly extracts from the National Health Applications and Infrastructure Services (NHAIS) database, which contains a list of individuals registered at each general practice in England, including their residential address and NHS number. For more details see the statistical analysis protocol (SAP).
The linked care home and hospital data were analysed by the Improvement Analytics Unit within an accredited secure data environment based at the Health Foundation. At no point did we have access to identifiable data. Throughout, the minimum amount of data was used for the purposes of the study.
Identifying residents receiving enhanced support
The study focused on individuals in care homes (nursing or residential) that were participating in the enhanced support who met the following criteria:
• had moved into a Wakefield care home between 17 August 2014 and 18 February 2017
• were not known to have previously resided in another care home between 17 August 2014 and their move-in date
• lived in the care home for at least one month during the study period
• were aged 65 years or over
• experienced a hospital admission within the three years before the start of the study (to ensure information on health conditions was available to inform the selection of an appropriate control group).
The evaluation only included nursing and residential care homes located in Wakefield CCG that were open for the entire period between February 2016 and March 2017. Care homes registered as caring for other age groups and with specialties other than the frail, elderly care home population were excluded.
This study comprised 526 residents from the 15 vanguard care homes. This is lower than expected based on the 999 care home beds.
Selecting the matched control group
To evaluate the impact of the vanguard's enhanced support, it was necessary to form a control group of care home residents who were as similar as possible to the vanguard residents.
We formed the control group in three steps: (1) identifying a subset of care homes in Wakefield CCG that were similar to the vanguard care homes but were not receiving the enhanced support; (2) applying the same selection criteria to residents of these care homes as for vanguard residents; (3) selecting residents from the group identified in step two with similar characteristics and living in similar care homes to the vanguard residents.
In step two we identified 37 care homes (eight nursing homes and 29 residential homes) that were similar to vanguard care homes but were not receiving the enhanced support. The same inclusion and exclusion criteria were applied to residents in the control care homes as to those in the vanguard care homes. In total, 625 residents from 30 care homes met the selection criteria and were therefore in the potential control group.
A matched control group that was similar to the vanguard residents on baseline characteristics both at care home and resident level was identified by matching on a range of variables. Variables included individual characteristics such as age, gender, prior health conditions and prior hospital use; and care home characteristics such as type of care home (whether nursing or residential) and number of beds. The variables included in the matching are listed in the SAP.
When selecting control residents, we did not use data on events that occurred after the start of the study, since this could have biased our findings. However, we checked that our final matched control group had a similar mortality rate to the vanguard residents as a check for unmeasured differences between groups. As we did not expect the enhanced care to have a large effect on death rates, a difference in death rates might suggest unmeasured differences between the groups.
We matched vanguard residents in nursing homes with matched control residents living in nursing homes; likewise, vanguard residents in residential homes were matched with residents in control residential homes. One matched control group resident was selected for each vanguard resident, yielding a sample of 526 ‘residents’ living in 30 care homes in the control group. The same resident could be used as a control at each of the two timepoints when care homes could join the intervention (February 2016 and September 2016). Two unique resident records were created for the resident at those time points, reflecting their hospital use and long-term conditions at that time. At each time point, each resident record could be reused three times. Reusing control residents meant that control residents that look similar to many vanguard residents could be selected multiple times, thereby ensuring that the matched control group is more similar to the vanguard group than if control residents could only be selected once. This reduces bias but causes correlation so the width of the confidence intervals is underestimated. We therefore limited the number of times the unique resident records could be reused to three. On average, control resident records were reused twice. Of the 526 ‘residents’ in the matched control group, there were 318 unique resident records. Full details on the methods used are available in the SAP.
Risk adjustment
Comparisons between the vanguard residents and the matched control group were made using multivariable regression analysis. The regression models adjusted, where possible, for differences that remained after matching between the two groups in observed baseline characteristics such as prior hospital use, age and type of co-morbidities. Matching and regression generally perform better in combination than separately. The regression models produced a ‘best estimate’ of the relative difference in the examined hospital utilisation outcome between the vanguard residents and the matched control group, together with a 95% confidence interval. The confidence intervals show some of the uncertainty in the results by providing a range around the ‘best estimate’ in which we can be relatively certain the true value lies. However, the regression cannot adjust for variables that were not recorded in our data sets, such as the degree of family support, social isolation and ability to manage their health conditions. This additional uncertainty is therefore not captured by the confidence intervals, so the results need to be interpreted with caution.
The same procedure was used for the subgroup analyses looking at new residents and existing residents and when looking at residents that were in the study for at least three months.
Figure 2. The process of forming the control group of care home residents and risk adjustment
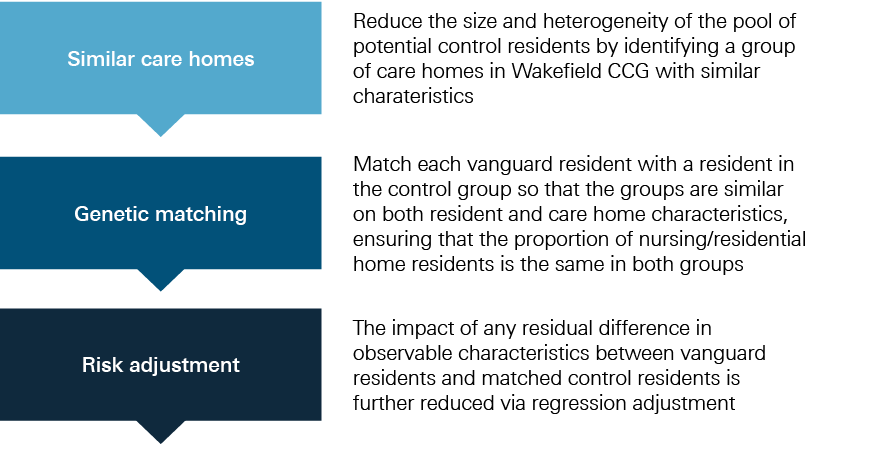
Source: analysis by the Improvement Analytics Unit
Outcome measures
Once a matched group of control care home residents was satisfactorily formed, the Improvement Analytics Unit proceeded with comparing hospital activity between the two groups. For this purpose, the following eight outcomes were considered for analysis:
• emergency admissions
• emergency hospital bed days
• A&E attendances
• the subset of ‘potentially avoidable’ emergency admissions, based on a list of conditions considered to be manageable in community settings or preventable through good quality care (see Box 1)
• outpatient attendances
• elective hospital bed days
• deaths occurring in hospital (%) (proxy for not dying in preferred place of death).
Hospital activity was measured for the period from 14 February 2016 until 18 March 2017 during which individuals were residents in a care home. For new residents, this was from the month they moved into the care home and for existing residents from the introduction of the intervention. All residents were followed until the end of the study, they died or moved out of the care home, whichever was earliest. Each resident therefore had a follow-up period of between one and 13 months.
|
Box 1. Conditions for which we considered emergency admissions to be potentially avoidable |
|
The analysis included conditions that are often manageable, treatable or preventable in community settings without the need to go to hospital, as well as those that may be caused by poor care or neglect. These were: • acute lower respiratory tract infections, such as acute bronchitis • chronic lower respiratory tract infections, such as emphysema • diabetes • food and drink issues, such as abnormal weight loss and poor intake of food and water, possibly due to neglect • fractures and sprains • intestinal infections • pneumonia • pneumonitis (inflammation of lung tissue) caused by inhaled food or liquid • pressure sores • UTIs. |
Potentially avoidable emergency admissions were defined as those hospital admissions where one of these conditions was listed as the primary diagnosis for the admission. Note that the list of conditions was developed by the Care Quality Commission (CQC) as part of their analysis on older people experiencing health and social care and was not therefore designed specifically for care home residents. Note also that sometimes individuals will still need to be admitted to hospital for these conditions independently of the availability of suitable out-of-hospital care (as is perhaps the case with individuals suffering from multiple co-morbidities) and regardless of the quality of the care offered in the care home. The metric is therefore not perfect, but we would expect the enhanced support to show greater impact on reducing the risk of hospital admission for these conditions than for others.
† This sensitivity analysis was not specified in the statistical analysis protocol.
‡ Pseudonymised data sets have been stripped of identifiable fields, such as name, full date of birth and address. However, a unique person identifier (such as an NHS number) has been replaced with a random identifier. The scrambled version of that field is used as the ‘key’ to link data sets together. For this analysis, a scrambled version of the NHS number was used to link together hospital records for the same individual over time.
§ The lower bound is due to data availability and the upper bound to allow for a minimum follow-up period of one month.
¶ Elective admissions are defined as those that are ‘ordinary’ or day cases and exclude maternity and regular day/night cases.
** Primary diagnosis for a hospital admission was taken from the first consultant episode of the hospital spell.
Results
Matching produced intervention and control groups with broadly similar characteristics
The matched control group was found to be broadly similar to the vanguard residents in the study across the range of individual and care home characteristics considered, for example the average age was 85 years among both vanguard and matched control residents (see technical appendix, Table A1). The majority (84%) of residents in vanguard care homes lived in nursing homes; as we matched within care home type, the proportion is the same in the matched control group. Figure 2 shows that the two groups had a similar profile of existing health conditions. The mean follow-up time in both groups was approximately six months (vanguard residents: 175 days [standard deviation 127]; control residents: 182 days [standard deviation 135]). However, one-third of residents were in the study for less than three months. Mortality rates in the two groups were also similar: 28% of residents in vanguard care homes died during the study period compared with 29% of residents in the matched control group.
Figure 3. Percentage of residents with certain health conditions at the start of the study
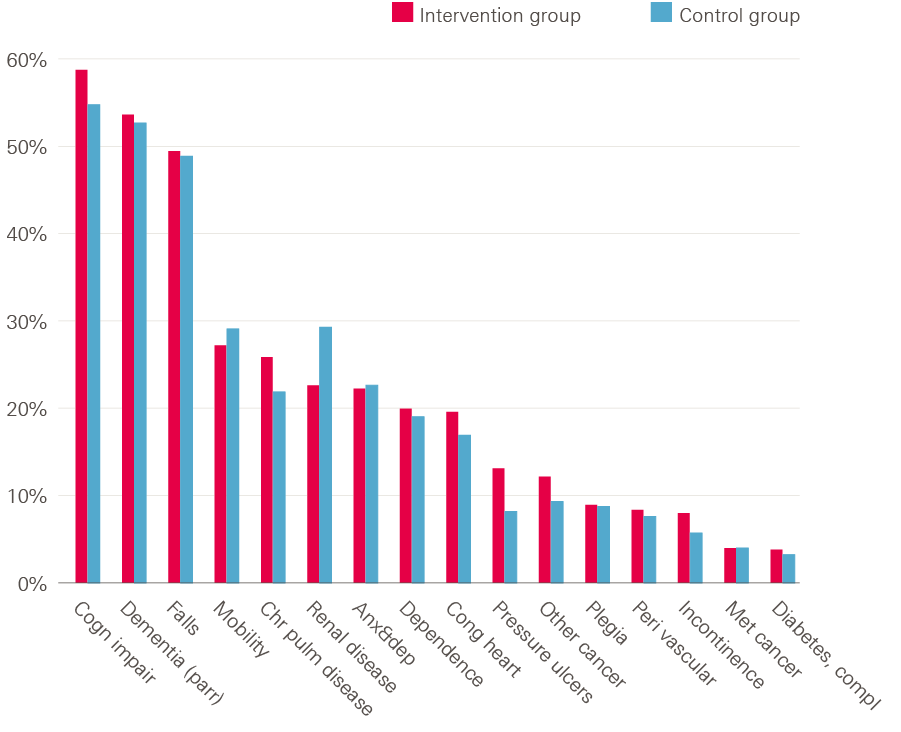
Note: the figure is based on diagnoses recorded on the inpatient record during the three years before the person moved into the care home. Because of how the conditions were identified, there were overlaps between some categories (eg, cognitive impairment and dementia). Individuals may have additional conditions not recorded in inpatient data, or which materialised during the care home stay.
Source: analysis by the Improvement Analytics Unit
Forty per cent of vanguard residents were ‘existing’ residents and had lived in the care home for an average of 239 days (eight months) before the start of the study. Forty-seven per cent of the matched control residents were existing residents and had lived in the care home for an average of 246 days (eight months).
Outcomes excluded from the report
Outpatient attendances, elective admissions and elective bed days were not targeted by the enhanced support but were initially included in the analysis to provide a fuller picture. However, less than 5% of care home residents in the study experienced any elective admissions or elective bed days, and these outcomes were therefore excluded from the presentation in the report. We also observed that a considerable percentage (56%) of outpatient attendances were scheduled prior to the start of the study, and so could not realistically have been influenced by the enhanced support. In the light of this observation, we did not consider our findings for this outcome to be informative; as such, we do not present them in this report.
Trends in hospital use
Figure 4 shows trends in hospital use over time. For each chart, the horizontal x-axis represents time in the study (with quarterly increments), and the start of the study is set at time zero. For new residents (56% of all residents), the start of the study is when they moved into a care home. For existing residents, the start of the study is when the enhanced support was introduced in the care home (ie February or September 2016), which on average was eight months after moving into a care home. The y-axis shows the crude rate of a given outcome for each corresponding quarter for vanguard residents and matched control group residents before moving to a care home and after the start of the study (negative and positive x-axis values, respectively). As expected, given the matching process, the vanguard residents in the study and control residents experienced similar rates of hospital activity before moving into care homes (left panel within each chart).
Crude rates of hospital activity in both groups were lower after the start of the study period compared with before moving to a care home. After the start of the study period, the rates in the two groups appear relatively similar for A&E attendances. Resident numbers were lower in the later quarters (eg 126 vanguard residents and 138 matched control residents in quarter four) so the rates are more likely to fluctuate (see technical appendix Table A2).
Figure 4. Comparison of vanguard and matched control residents in the study across selected outcome measures
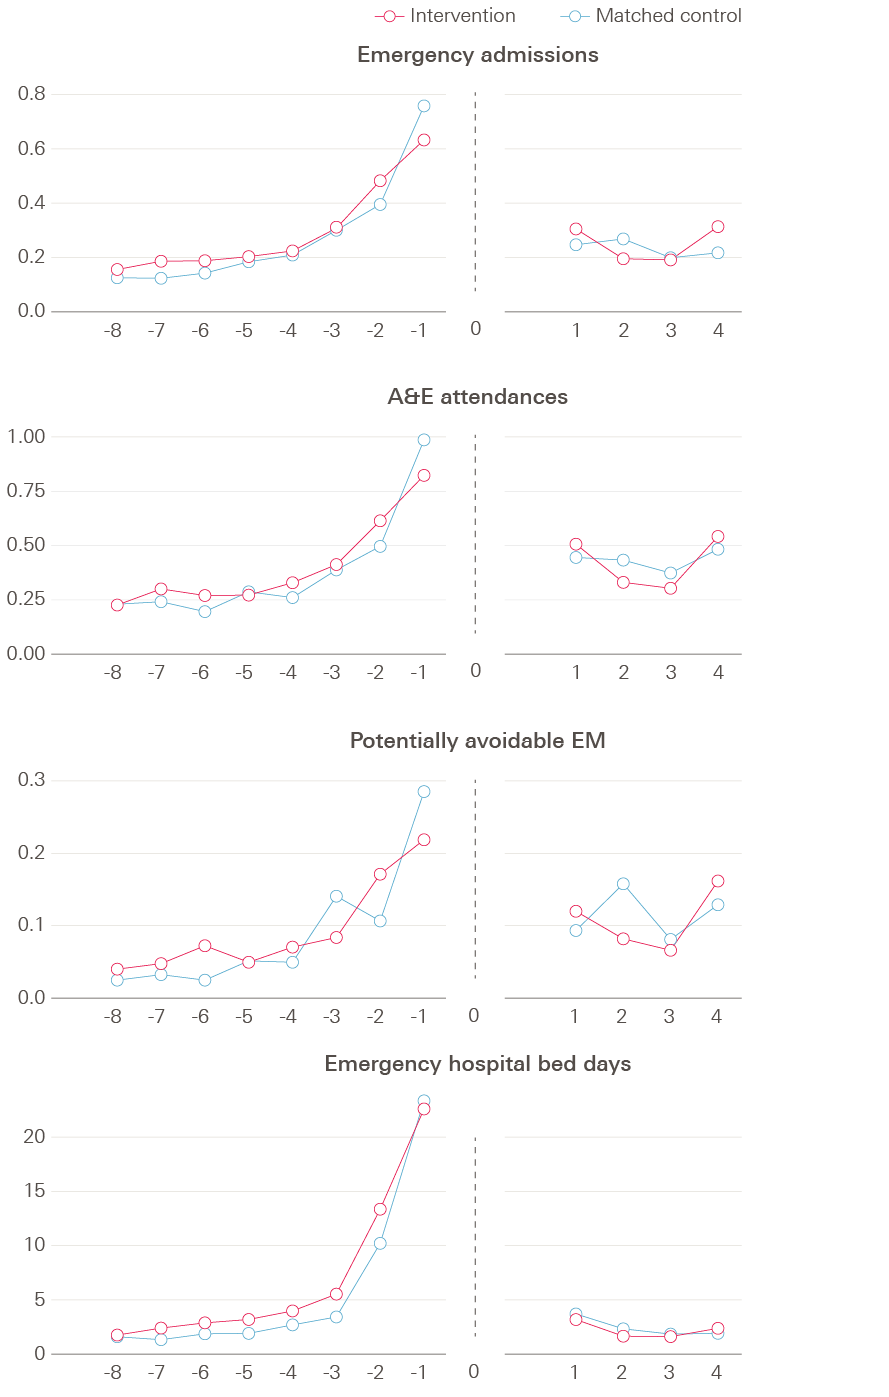
Vanguard residents appeared to have fewer potentially avoidable emergency admissions than the matched controls but there were no discernible differences in overall emergency admissions or A&E attendances
Source: analysis by the Improvement Analytics Unit
Table 2 compares the hospital use of vanguard residents with that of the matched control residents over the follow-up period as a whole. The crude rates indicate the number of events per person per year, and are not adjusted for the differences that remained between the two groups after matching. The relative differences, on the other hand, account for some of the remaining differences between the two groups and will therefore be referred to when drawing conclusions and interpretations from the evaluation.
We found that vanguard residents had on average 0.42 potentially avoidable admissions per person per year, compared to 0.47 in the matched control group. After adjusting for some remaining differences between the groups, we estimated that vanguard residents had on average 27% fewer potentially avoidable admissions, with the true value likely to be between 45% and 2% fewer such admissions. Although this is a statistically significant result, it is worth remembering that our confidence intervals are likely to be underestimated (see methods section), therefore this result should be viewed with some caution.
There were no statistically significant differences in hospital use between residents in vanguard care homes and residents in control care homes on any of the other reported emergency hospital measures: A&E attendances, emergency admissions or emergency bed days. All 95% confidence intervals spanned 0%, indicating no significant difference between groups at a 5% significance level.
Looking at for example emergency admissions in more detail, vanguard residents had (on average) 1.02 emergency admissions per year compared with 0.97 for control residents. After risk adjustment, there were 1% fewer emergency admissions for vanguard residents than control residents, but the relative difference could lie anywhere between 19% fewer and 22% more emergency admissions for residents in vanguard care homes. In absolute terms, vanguard residents had 0.01 fewer emergency admissions per person per year than the matched control patients (95% confidence interval: 0.18 less to 0.21 more).
Table 1. Comparison of hospital use between vanguard and matched control residents, February 2016 to March 2017
|
Crude rates for (number per person per year) |
Absolute differences (per person per year, adjusted) |
Relative difference (adjusted rate ratio) |
P-value |
||||
|
vanguard residents |
control group residents |
Best estimate |
95% confidence interval |
Best estimate |
95% confidence interval |
||
|
Emergency admissions |
1.02 |
0.97 |
0.01 fewer |
0.18 fewer to 0.21 more |
1% lower |
19% lower to 22% higher |
0.956 |
|
A&E attendances |
1.70 |
1.76 |
0.05 fewer |
0.33 fewer to 0.28 more |
3% lower |
19% lower to 16% higher |
0.709 |
|
Potentially avoidable emergency admissions |
0.42 |
0.47 |
0.13 fewer |
0.01 to 0.21 fewer |
27% lower |
45% lower to 2% lower |
0.034 |
|
Emergency hospital bed days (mean, standard deviation) |
4.6 (11) |
5.4 (12.9) |
2.51 fewer |
5.14 fewer to 1.2 more |
23% lower |
47% lower to 11% higher |
0.151 |
Note: See technical appendix Table A5 for a list of variables that were adjusted for.
Source: analysis by the Improvement Analytics Unit
No statistically significant difference in the proportion of deaths that occurred in hospital was detected
During the study period, 147 of the vanguard residents died, as did 153 of the matched control residents. Among the vanguard residents who died, 30% of deaths occurred in hospital, compared with 31% of deaths for the matched control residents. After adjustment, the proportion of deaths in hospital was 20% higher for vanguard residents but the confidence interval was wide and the relative difference in proportion of deaths in hospital could lie in the range of 31% lower to 108% higher in the vanguard (see Table 2).
Table 2. Comparison of percentage of deaths occurring in hospital
|
Vanguard residents |
Matched control residents |
Relative difference from matched control (adjusted odds ratio) |
95% confidence interval |
P-value |
|
|
Percentage of deaths in hospital (number of deaths in hospital/total deaths) |
29.9% |
31.4% |
20% higher |
31% lower to 108% higher |
0.518 |
Not adjusted for all baseline characteristics. See technical appendix Table A5 for a list of variables that were adjusted for.
Source: analysis by the Improvement Analytics Unit
Residents who were in the study for at least three months experienced fewer potentially avoidable admissions
It is likely that the effect of the enhanced support would not be seen for an individual resident in the first couple of months. We therefore looked at residents that that been in the study for at least three months: 371 vanguard residents (183 new and 188 existing residents) and 356 matched control residents (138 new and 218 existing residents).
All outcome measures reported above for the overall population were also analysed for the group that were in the study for at least three months (see technical appendix, Table A6). Among residents that were in the study for at least three months, vanguard residents had 0.39 potentially avoidable emergency admissions per person per year compared with 0.46 for control residents. After risk adjustment, potentially avoidable admissions were estimated to be 38% less likely for vanguard residents than for the control group, with the relative difference lying between 16% fewer and 54% fewer potentially avoidable emergency admissions for residents in vanguard care homes. This result was statistically significant (p<0.001) (see technical appendix Table A7). In absolute terms, vanguard residents had 0.17 fewer potentially avoidable emergency admissions per person per year than the matched control patients (95% confidence interval: 0.07 to 0.25 less). No other outcomes were statistically significant.
There was no conclusive evidence of difference in hospital use between new and existing residents
Analyses were carried out separately on the group of residents that moved in before the enhanced care package was introduced (existing residents) or afterwards (new residents). The period involved in the study was shorter for new residents (mean four months) than existing residents (mean eight months). None of the outcomes showed a statistically significant difference.
Existing residents had in general lower crude rates of hospital use than new residents within both the vanguard and matched control groups (see technical appendix, Table A8). However, there was no conclusive evidence that the effect of the enhanced support differed depending on whether a resident was new or existing.
Interpretation
What can we learn from these analyses?
This evaluation is based on data on hospital use over the period February 2016 to March 2017 for residents who lived in one of 15 vanguard care homes in Wakefield. These analyses provide insights into hospital use by vanguard residents at an early stage of the vanguard’s enhanced support, in comparison with a broadly similar group of individuals who lived in ‘similar’ care homes in Wakefield not supported by the vanguard.
We found some evidence that people living in vanguard care homes had 27% fewer potentially avoidable emergency admissions than the matched control group, although the 95% confidence interval, which is likely to be underestimated due to reusing some residents’ records, ranged between 45% to 2% fewer such admissions. Therefore, this should be interpreted as promising but not definitive evidence of fewer potentially avoidable admissions in the intervention group. There was no conclusive evidence that people living in vanguard care homes had lower A&E attendances or overall emergency admissions.
This evaluation aimed to explore whether there were early signals of change in hospital use and was therefore conducted approximately one year after the introduction of the enhanced support, only capturing residents’ outcomes over an average of six months. Research has highlighted that implementing complex interventions needs time to take effect. This is so that teams introducing these changes can be supported to work through implementation challenges and learn from experience and evaluation. Information provided by Wakefield CCG indicates that the primary purpose and focus of the LES was to get GPs thinking about how they can work differently with care homes and to move towards the ‘one GP practice one care home’ model. However, Wakefield CCG identify that the move to one GP per care home model was not implemented during the time period of this study and the GP LES did not appear to have had much influence on the working patterns of the GP practices working with the care homes supported by the vanguard. This means that this evaluation may be identifying the additional effect of the MDTs and the voluntary sector over and above the support provided by GP practices.
Furthermore, residents may need to receive the intervention for a period of time before their outcomes are affected. This is consistent with our sensitivity analysis, which showed that when looking at residents that were in the study for at least three months and therefore were getting the enhanced support for longer, potentially avoidable emergency admissions were significantly lower (38% fewer such admissions, 16% to 54%, 95% confidence interval) for residents receiving the enhanced support. Here, the confidence interval is further away from 0% (ie the threshold for ‘no difference’), therefore we can have more confidence around these results.
The fact that we are seeing an effect specifically on potentially avoidable admissions may be due to the MDTs, who proactively planned and managed care of those care home residents considered at high risk who may otherwise have care needs which could lead to residents needing inappropriate hospital care. Furthermore, they provided training relating to, for example, falls and pressure sore prevention, which can otherwise result in potentially avoidable admissions.
However, we could not secure access to data on which residents were referred to MDTs. Therefore, we do not know how many of the vanguard residents included in this study were actually seen by the MDT or whether the lower rate of potentially avoidable admissions is associated with referral to the MDT.
Study strengths and limitations
This evaluation focused on hospital use, since it was an objective of the vanguard to respond to pressures on the health and care system by reducing the use of unplanned emergency care. It does not tell us how the care home vanguard affects other parts of the health care system, if it achieved against their aims to improve residents’ wellbeing or quality of life, or whether the care home vanguard affected staff satisfaction and capability. For a more complete picture of the enhanced support’s impact, this study should be viewed together with the results of local evaluations. For example, analyses carried out by Wakefield Public Health Intelligence on the impact of the enhanced support have shown promising results on ambulance call outs.
By linking data sets together, we were able to study the hospital records for a large number of care home residents, without the problems with non-response that can occur with other data collection methods such as surveys. However, due to limitations with the data we did not identify as many care home residents as expected, based on the number of beds (999 beds in the vanguard care homes). We are unable to determine how similar the characteristics of the missing residents are to the residents in the study.
We were unable to link MDT referrals to the hospital records, which prevented us from knowing who was seen by the MDT. Knowing who was seen by the MDT could have helped identify more care home residents and potentially improved the methods used to identify care home residents. The MDT is one of the elements most likely to have had an impact on hospital use and not knowing what proportion of the residents in our study were seen by the MDT makes it more difficult to know how different the care that the vanguard residents received was compared to the comparison residents. We were also unable to evaluate the effect of being seen by the MDT.
The matched control residents had broadly similar age, gender, health conditions and previous hospital use to the vanguard residents. They lived in care homes that were broadly similar in terms of provision of nursing or residential care. Furthermore, our statistical evaluation used risk-adjusted analyses, which lends further rigour and validity to the study. However, there might be other unobserved differences between the vanguard residents and matched control residents that were not (or could not be) measured, such as informal care they received from relatives, staffing levels in care homes, or quality of care received in hospital, and therefore could not be adjusted for. But by choosing matched control residents living in Wakefield, we ensured that the two groups were more likely to be similar in ways that could not be observed or measured and also that both groups had access to the same health services. There was no statistically significant difference in death rates between the two groups, which lends support to the notion that their baseline health profiles were comparable.
The pool of potential control residents was small so the same control person was reused multiple times. This introduces correlation, which means that the width of the confidence intervals is underestimated and therefore the results should be interpreted with caution.
Implications and priorities for future work
These analyses reflect implementation part-way through the delivery of the enhanced support introduced in 15 care homes in Wakefield. In April 2017, after the period of this evaluation, an additional 12 care homes joined the vanguard and some new initiatives were introduced in the original 15 care homes. This evaluation supplements existing evidence derived by alternative methods delivered by the vanguard, and provides a different approach to evaluating the impact of the vanguard’s enhanced support.
The evaluation provides some useful insights on progress at this early stage. We found that there was promising evidence of an effect on potentially avoidable admissions, especially in the subgroup of residents who were in the study for at least three months, indicating that it may take some time before an intervention can affect a person’s outcomes. Extending the evaluation period to beyond March 2017, and potentially including the 12 care homes that received enhanced support from April 2017, would improve understanding of whether a longer follow-up period for residents is needed for there to be an effect.
Further quantitative analyses would be enhanced with targeted qualitative research to understand how the different initiatives are being implemented and the mechanisms through which the enhanced support interacts with contextual factors to affect emergency care use. One area of interest could be to look at the parts of the enhanced support that are likely to affect potentially avoidable emergency admissions, an area where we are seeing positive signs. This could also provide evidence that would inform whether certain elements of the enhanced support package may be more significant determinants of emergency care use than others.
With the data we had access to we could not observe how the different components of the enhanced support operated in practice or examine how the enhanced support interacted with contextual factors, but additional analyses could develop understanding further and provide more robust information to inform local implementation. For example, if data on MDT referrals were made available, the effect of MDTs could be isolated from other parts of the intervention thereby allowing for stronger conclusions to be drawn.
A recurrent message from the Health Foundation’s improvement work is that to improve the quality of care, repeated measurement and data linkage to get a fuller picture are necessary to allow timely modification of initiatives and inform their more effective evolution. Over the coming years, the Improvement Analytics Unit will analyse more local initiatives, feeding back analysis quickly to inform ongoing decision making and practice.
To find out more, visit www.health.org.uk/IAU