Acknowledgements
The authors would like to gratefully acknowledge the input of those Health Foundation staff who commented on and contributed to this text in a variety of ways.
They would also like to thank the Nursing Standard for collaboration on the attrition analysis and those that peer reviewed the publication. Errors or omissions remain the responsibility of the authors alone.
Executive summary
This is the fourth annual NHS workforce trends report published by the Health Foundation. In it, we analyse the changes in the size and composition of the NHS workforce in England in the context of long-term trends, policy priorities and future projected need. The key findings are as follows.
Staff working in NHS hospitals, mental health and community services
- The number of full-time equivalent (FTE) staff working in the NHS in England increased in 2018/19 by 2.8% (almost 30,000 extra FTE staff). This is the fastest rate of increase in the NHS workforce this decade, but there are marked variations for different staff groups.
- Over the past decade, the proportion of the health service clinical workforce who are registered nurses has fallen, as numbers of doctors employed in NHS hospitals, mental health and community services have grown at a faster rate than nurses.
- 2018/19 saw a continuation of this trend: there was a 2.5% increase in the number of FTE doctors, while the number of FTE nurses grew by just 1.5%. Over the past 5 years the number of FTE doctors has increased by 10%, while the number of FTE nurses has increased by just 3%. At the beginning of the decade there were 3.0 nurses per doctor in the NHS, but this figure has now fallen to 2.6.
- The last decade has also seen a major change in the mix of nurses and clinical support staff (including health care assistants and nursing assistants). In 2009/10 there were equal numbers of nurses and support staff, with one clinical support staff member for every FTE nurse in the NHS. By 2018/19, the number of support staff per FTE nurse had risen 10% to 1.1 FTE per nurse.
- This skill mix change continued last year. In 2018/19 the NHS employed 6,500 more clinical support staff to doctors, nurses, and midwives, which represented a 2.6% increase. This compares to 4,500 more FTE nurses, an increase of just 1.5%.
- Changes in skill mix within the NHS may reflect a range of factors: changing patient needs, technological developments and legislative changes to allow some staff groups to expand the scope of their practice. In many cases, skill mix changes are implemented well, being policy- and evidence-led, with effective programmes to support teams – for example, the introduction of nurse practitioners and pharmacy prescribing.
- It is important that quality and safety are at the forefront of any skill mix change. There is cause for concern about skill mix changes being introduced in an unplanned way in response to negative factors – such as cost pressures or recruitment difficulties – rather than positive drivers of improvement.
- Last year’s staffing increases were unevenly distributed across different parts of the NHS. Ambulance staff numbers grew by 5.1% in 2018/19, while the numbers of doctors working in hospital and community health services grew by 2.5%, compared to a less than 1% increase in the numbers working in general practice, including locums and registrars.
- Within nursing, the number of FTE nurses employed in children’s nursing grew by 2.7%, but mental health nursing numbers grew by just 0.6% and community nursing service numbers (excluding health visitors) by just 0.7%. The NHS long term plan ring-fences funding for community and mental health services. But, judging by changes in the nursing workforce, translating this funding commitment into increased capacity at the front line has been, and will be, a significant challenge.
- The combined number of nurses working in community and mental health services in 2019 remains below nurse staffing levels in 2014, although higher than the lows experienced over the last 4 years, but demand has risen due to population growth, increasing need and the commitment to improve these services.
- The NHS long term plan and Advancing our health: prevention in the 2020s both emphasise the importance of health promotion and disease prevention and research suggests school nursing services provide cost-effective prevention. Despite this, in 2018/19 the number of school nurses fell by a further 3.1% to just 2,220 FTEs across England.
- As in recent years, the largest percentage increase was among managers (6.2%) and senior managers (5.7%). The number of managers and senior managers has now increased for 29 consecutive months, although this is in the context of large reductions in numbers in 2013/14.
- While the NHS is experiencing significant staffing pressures, the issues in social care are even greater and the outlook is concerning. Registered nurse jobs in adult social care have decreased by 10,400, or 20%, since 2012, and by 2% between 2017/18 and 2018/19.
The changing general practice workforce
- Alongside investment in community and mental health services, The NHS long term plan prioritises investment in general practice. In 2016 the General practice forward view set a target to increase the number of GPs by 5,000 by 2020, compared with the number working in the NHS in England in 2014. The target is now that this will be reached ‘as soon as possible’.
- However, the number of people working as fully qualified, permanently employed FTE GPs continues to fall – there was a 1.6% decline from 27,834 in March 2018 to 27,381 in March 2019. Temporary staff (locums) and doctors in training (registrars on placement) are making up a greater proportion of the GP workforce, rising from 19% in 2018 to 21% in 2019. The growth in temporary and training staff means that overall GP numbers increased by 0.9% last year. But it is almost impossible to see how the original target for 5,000 extra GPs could be met by 2020; if this is to be reached over and above 2015 numbers the number of qualified permanent FTE GPs would need to increase by 6,250 next year.
- The number of patients that each FTE qualified permanent GP is responsible for continues to grow, increasing from 2,120 to 2,180 over the past year. Given the ageing population, the rise in chronic disease, and the aim to support more people’s health needs within the community, general practice services will need to continue to widen the skill mix of their workforce in order to match need and ensure patients can access care.
- There are now more non-GP clinical staff working in general practice in England than GPs. Nurses form an important part of the team in most general practices, with around one nurse for every two GPs. In 2018/19 the number of practice nurses fell by 0.4%, but this was more than offset by an increase in the number of advanced practice nurses (9.8%). Advanced practice nurses now account for 22% of the nurses working in GP practices, compared with 17% in 2015.
- Alongside the expansion in nursing, within general practice other professions are playing an increasing role in the delivery of care. The past year has seen an almost 40% growth in the number of FTE pharmacists working in general practice, from 743 to 1,029.
- This is a trend that will continue with the new contract for general practice, agreed in January 2019, which commits to grow the number of staff from other professions (pharmacists, physiotherapists and paramedics) by 20,000 by 2023/24. Additional funding of £900m has been ring-fenced for this purpose.
- The growth in the UK of registered pharmacists per 1,000 population has been the second highest of EU-15 countries. As a result it has gone from being below both the OECD and EU-15 averages to above both of them.
Training new nurses
- The 2018/19 workforce statistics confirm that nursing remains the key area of shortage and pressure across the NHS. The modest growth in nurse numbers has not kept pace with demand, and nursing vacancies increased to almost 44,000 in the first quarter of 2019/20, which is equivalent to 12% of the nursing workforce. Research by the Health Foundation, The King’s Fund and the Nuffield Trust projected that, without major policy action, the gap between the number of FTE nurses that are needed to keep up with demand and those available to the NHS could grow to 100,000 in a decade’s time.
- To prevent nursing shortages growing further, urgent action is needed to increase the numbers of nurses in training, reduce attrition and improve retention.
- In 2017, the government set out its intention to grow nursing undergraduate places by 25%. This year, the number of applicants to nursing courses in England increased for the first time since the NHS bursary was withdrawn in 2017. This 4.6% increase reversed 2 years of decline in which the number of applicants fell by almost a quarter. The number of applicants in England has now risen to 40,780, but nevertheless it remains below the figure for 2017.
- Scotland, where the NHS bursary has been retained and its value increased, has seen a 6.7% increase this year, taking the number of applicants to its highest ever level.
- Applications tell part of the story, but as applications have historically significantly exceeded the number of places available, the key issue for the NHS is not so much how many people apply, but rather how many students actually start training (acceptances). In 2018, there were only 80 fewer acceptances in England despite a 13.6% fall in applications compared with 2017.
- The total number of applicants accepted onto nursing courses starting in 2019 will not be known until the Universities and Colleges Admissions Service (UCAS) releases the end-of-cycle statistics. In the latest set of figures, released 28 days after A-level results day, the number of applicants from England who have been placed at universities in the UK is up by 3.9%, at 21,030. This is below the number of students accepted in 2016, but the second highest number of students starting a nursing degree this decade. It is still some way short of the additional 4,000 people in training by 2023/24 pledged in the NHS long term plan.
- If the NHS is to reduce vacancies and grow the pool of qualified nurses to recruit from, the forthcoming NHS people plan will need to set out measures that will rapidly expand the number of people starting undergraduate nursing degrees in England. The 2019 data show that there are different patterns of applications and acceptances by age, branch of nursing and geography.
- New data looking at trends in nurse training between 2014 and 2018 show that the numbers starting mental health and learning disabilities nursing fell significantly in 2017, by 10% and 30% respectively. All continuously running learning disability courses have fewer students in 2018 than in 2014. This is in contrast to children’s nursing, where around two-thirds (63%) have increased in size. We also see that fewer over-25s started nursing degrees in 2018 compared with 2016, particularly impacting learning disability and mental health courses.
- Overall trends can also hide pressure points in different areas of the country. Adjusting for population size London and the South East are in the bottom three regions for the number of acceptances to study nursing and the top three for the number of vacancies per 100,000 people.
- A relatively high proportion of students who start a nursing degree do not graduate within 3 years – either dropping out completely or putting their studies on hold. The latest data show that attrition remains high despite government commitments to reduce it. One in four nurses who were expected to graduate in 2018 did not do so, and this was highest for learning disability courses.
International recruitment
- One consequence of the failure to train, recruit and retain domestic nurses is that the UK is, and will continue to be, heavily reliant on international recruitment to maintain care quality and access. Previous research by the Health Foundation, The King’s Fund and the Nuffield Trust found that the NHS will need to recruit at least 5,000 nurses a year internationally to avoid a substantial further increase in unfilled posts. The latest data available suggest that in 2017/18 the NHS recruited just 1,600 nurses internationally.
- Since 2016 and the referendum on the UK leaving the European Union (EU), as well as changes to English language testing requirements, there has been a rapid decline in nurses joining the Nursing and Midwifery Council (NMC) register from the EU, but some increase in non-EU international inflow – mainly from India and the Philippines. Overall, the number of international nurses joining the NMC register grew last year, although it is still below the level in 2016/17. How this compares to the 5,000 nurses a year required will depend on how many of these nurses choose to work and stay in the NHS following registration.
Conclusions
- This analysis further highlights the deeply embedded challenge of skills shortages in key areas of the NHS – nursing, GP services, and community and mental health services. The effect of these shortages is increasingly felt through problems with access and quality, and this is rippling out to other sectors – notably social care and the nursing home sector.
- Our analysis of the nursing workforce this year reinforces several points: the UK has relatively few ‘new’ nurses graduating from higher education compared to other OECD countries; in England NHS nursing numbers have not changed markedly over the last few years; attrition during undergraduate nurse education continues to be persistently high; and reliance on international recruitment, which has ebbed and flowed, is on the up again, but with non-EU source countries now being the target.
- Against this background of supply-side issues, continuing concerns about relatively low increases in student nurse numbers in England become even more pronounced. Without radical and concerted action in the forthcoming NHS people plan, there is a very real risk that the additional funding committed to the NHS by the current and previous prime ministers will not deliver tangible improvements in care.
Box 1: Recent changes in staff numbers
Our analysis focuses on long-term trends in the number of staff working in the NHS and how these trends have changed over the most recent financial year. Due to the importance of NHS staff, new data is frequently published detailing the numbers of staff working in the NHS. The latest NHS workforce statistics at the time of publication (data 21 November) reinforce the long-term trends we highlight in this report. Overall growth of the workforce was 3.0%. Nurse numbers grew at just half the rate of support staff (for doctors, nurses, and midwives) at 2.0% vs 4.0%. The lack of growth for nurses working in community services continued, with a fall of 0.2%, while in mental health services there was some growth (1.7%) although levels remain below those in 2014. We set out some of these recent changes in Table 1, but our report as a whole focuses on a consistent basis on changes over financial years.
Background
This report is the Health Foundation’s annual assessment of trends in the NHS workforce. It examines changes in the overall staff profile of the NHS and identifies key trends. This is the fourth such report. Our aim over time has been to build progressively on each annual assessment to provide a long-term picture of trends and changing profiles, while also taking a year-by-year look at specific ‘pressure points’ that warrant more detailed attention.
For this annual cycle, we continue with the primary aim of providing long-term trends and analysis to place immediate NHS workforce challenges in the appropriate policy and planning context. This is the last annual report that will be published in this format. It will be replaced in the future with more rapid periodic evidence updates and analysis on NHS workforce issues, reflecting both the increased speed with which some workforce data are available and the rapidly changing NHS funding and policy environments. The Health Foundation will complement these evidence updates with more in-depth analysis of key health workforce issues that are clear and pressing national priorities.
Recent years have seen major staff shortages with national debate focusing on their negative impact on NHS services. The Health Foundation has contributed to informing debate, emphasising the need for more effective targeted funding, more responsive and flexible workforce planning, and investment that is focused on improved staff productivity and retention.
Staff shortages continue to dominate the discourse in 2019. Early in the year, the Health Foundation, in collaboration with The King’s Fund and the Nuffield Trust, published Closing the gap – a joint report on the NHS workforce, in the context of the 10-year plan for the NHS. The joint report argued that staffing was ‘the make-or-break issue for the NHS in England’. It pointed out that shortages are already having a direct impact on patient care and staff experience, and that without significant funding and policy action the staff shortfall was likely to become more pronounced, notably in nursing and primary care.
The joint report highlighted nursing and general practice as two critical areas, and made a series of recommendations. These included using the skills of other staff – including pharmacists and physiotherapists – much more widely in general practice, a ‘radical expansion of nurse training’, and an increase in international recruitment. The report also noted that the workforce implementation plan due to be published to underpin the 10-year plan would present ‘a pivotal opportunity’. In this review, we return to some of the detailed analysis conducted for Closing the gap.
At the time of developing this report, we are awaiting the forthcoming NHS people plan. The Interim NHS people plan was published in June 2019. It set out the ‘vision for people who work for the NHS to enable them to deliver the NHS long term plan’ but it was broad-brush in nature, and awaiting fuller analysis, stakeholder engagement and costing. We do not focus in any detail on the interim plan in this report.
Recent independent analysis of the state of the NHS workforce has reinforced the key points made by the Health Foundation and its partners. In May, the Migration Advisory Committee (MAC) was charged with assessing which occupations should be on the Shortage Occupation List (SOL), and therefore eligible for active international recruitment. It reported a ‘vast increase’ of applications for nurses and doctors. These occupations are currently provisionally on the list, after lobbying from the professions and employers. The MAC recommended that nurses should be included on the SOL, noting that a ‘significant number of stakeholders reported difficulties in the recruitment of nurses. Vacancy rates have been rising, even with increased employment, and they ranked relatively highly in the shortage indicators.’ More recently, in October 2019, the MAC’s recommendations that all medical practitioners, occupational therapists, psychologists, radiographers, speech and language therapists, and social workers be added to the SOL were implemented by the government. In this report we will give more attention to active international recruitment and its vital role in shoring up NHS nurse staffing levels.
Another analysis, published by the House of Commons Library in May, noted that there had been overall growth in the workforce in recent years, but significantly slower growth in nursing staff than in most other NHS occupations; it also highlighted that, since 2015, the number of GPs had fallen. A more recent House of Commons Library briefing on international workers in the NHS noted that 87% of NHS staff in England are British, and 5.5% are nationals of other European Union (EU) countries – totalling just over 65,000 staff. While the overall percentage of EU staff has remained at 5.5% since the EU referendum, the number of EU nurses has been in decline, and the number of EU nationals joining the NHS workforce has also been falling.
The deep-rooted problem of staff shortages was also reinforced by the NHS Pay Review Body. In its July 2019 report, it noted that:
‘The workforce gap we recognised in our last report persists and continues to create unsustainably high levels of vacancies, work pressures and potential risks to patient care… The trends in the nursing workforce are a particular concern with increasing nursing vacancy rates and substantial declines in the number of people applying for nursing degrees in the last 2 years in particular from mature students who represent 60% of entrants.’
Over the past year, an additional workforce challenge has emerged, as the impact of the pension cap has led to some senior doctors retiring early, or reducing their working hours. This is reportedly having an effect on waiting lists. The government has recently signed off a short-term scheme to try and alleviate the problem for clinicians. Similarly, a proposed ‘fix’ to the scheme has been out for consultation. NHS Employers has responded that the proposal ‘should apply to all NHS employees, to ensure the NHS Pension Scheme can continue to be used as a central part of the overall reward offer to attract, recruit and retain staff’ and that, as proposed, it will ‘only partly meet the forthcoming objectives set out in the NHS England/Improvement People Plan’.
Workforce challenges are also highlighted in social care. Both the NHS and social care employers recruit from the same pool for many care-giving roles. Recent analysis shows that the estimated number of adult social care jobs in England in 2018 was 1,620,000, of which 1,225,000 (76%) were direct care staff jobs and another 84,000 (5%) were regulated professionals, including 41,000 registered nurses (these are nurses not working in NHS). While overall numbers were up by 1.2% on the previous year, registered nurse jobs in adult social care have decreased by 10,500, or 20%, since 2012. Projections based on the analysis found that if the adult social care workforce grows proportionally to the projected number of people aged 65 and over in the population, then the number of adult social care jobs will increase by 36% (580,000 jobs) to around 2.2 million jobs by 2035.
Much of the emphasis on workforce analysis focuses on the supply side – on trends and numbers, on vacancies and workforce flows. It is also important to keep in mind that the workforce is the means of achieving safe, effective and timely care. This is particularly important when the continued, more rapid growth in activity in comparison to workforce is noted. For example, as shown in Figure 1, while ‘output’ (including the number of operations, consultations, diagnostic procedures and A&E visits in a year) grew by almost a quarter between 2010/11 and 2016/17, the number of nurses grew by less than a tenth of that.
Figure 1: Service output and FTE nursing staff numbers in the NHS Hospital and Community Health Service, 2010/11–2016/17
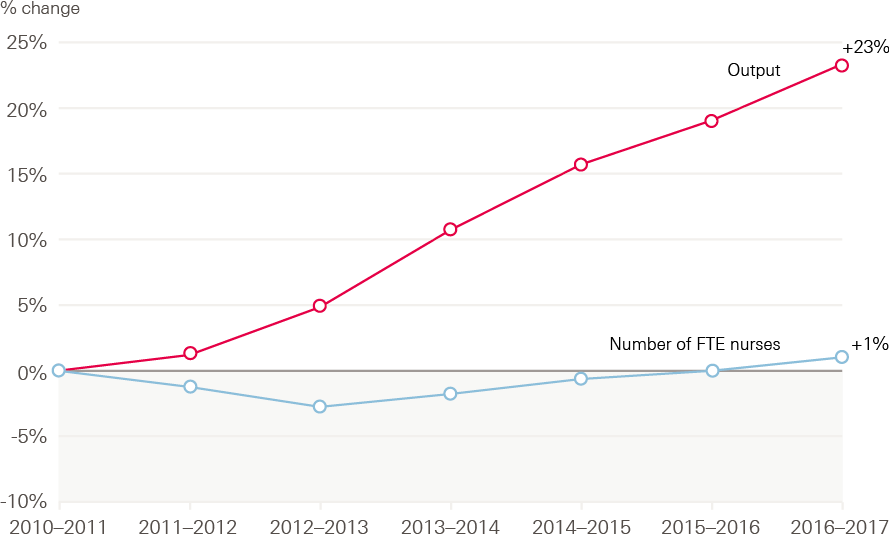
Source: NHS Digital, NHS Workforce Statistics; ONS, Public service productivity: healthcare, England. Note: output is cost and quality adjusted activity
The impact of staff shortages on existing staff in terms of increased workload, job-related stress and ‘burnout’ is also a cause for concern. For example, the most recent NHS Staff Survey highlighted that only a third of NHS workers felt there were enough staff for them to do their jobs properly, and that reported stress levels are at a 5-year high, with 40% of respondents reporting work-related stress within the last 12 months.
Detailed analysis of Staff Survey results by the Picker Institute and The King’s Fund, published in 2018, highlighted that NHS staff workplace experience was associated with sickness absence rates and spend on agency staff and staffing levels, indicating that the workforce was ‘overstretched and supplemented by temporary staff’ which was negatively affecting staff wellbeing. It also noted that there were negative associations between patient experience and workforce factors, including ‘higher spend on agency staff, fewer doctors and especially fewer nurses per bed, and bed occupancy’. The report concluded that care quality was at risk from staffing issues, observing that: ‘Staff-reported experience was correlated with patient feedback in several areas, notably between staff perceptions of care quality and patient experience, indicating that staff and patients’ perceptions about quality of care are consistent.’
Further concerns about the impact of workload on staff were highlighted in the report by the Care Quality Commission (CQC), State of care, published in mid-October 2019. The CQC reported that ‘Growing pressures on access and staffing risk creating a “perfect storm” for people using mental health and learning disability services’, with a national shortage of nurses in these areas. It also noted that, more broadly across health and social care, ‘access and staffing are presenting challenges across all care settings, with geographic disparities’ and also regional variation in the ability of services to recruit and retain staff. The CQC report points to workforce solutions related to the development of new roles and an emphasis on upskilling existing staff, including advanced nurse practitioners, nursing associates, physician associates, pharmacists, district nurses, mental health practitioners and social prescribing workers, working within GP practices.
This report builds on those of previous years to provide analysis of longer-term trends and insights into the changing NHS staff profile. It also focuses specifically on the critical NHS workforce issues that have been repeatedly identified in recent years: nursing shortages, and shortages of staff in general practice and primary care. We first present an overview of the NHS workforce in England, before examining trends in the supply of student nurses. Next, we examine the international flow of health professionals and place the UK in an international context. Finally, we focus on staff retention, before summarising the key workforce challenges that will need to be considered in the development of the full NHS people plan.
The NHS workforce in England: profile and trends
Our previous report, A critical moment, described modest and patchy growth in the NHS workforce, with almost no increase in the overall number of registered nurses and further reductions in the community health services workforce. We acknowledged the changing skill mix and the growing numbers of support staff in employment. In general practice we highlighted the falling number of qualified permanent GPs and the increase in other direct patient care staff. This section summarises recent trends in the NHS and GP practice workforces, looking at the 12 months of the financial year 2018/19 to the end of March 2019.
The NHS workforce profile
The NHS workforce statistics for March 2019, covering NHS Hospital and Community Health Service (HCHS) staff groups in England, show a total workforce of 1.24 million (headcount) and an overall increase of 2.8% (29,355) in the full-time equivalent (FTE) workforce since March 2018. At the same time, the number of posts advertised as vacant in the 3 months to 31 March 2019 was 2.4% higher, at 89,589 FTE, than in the same period in 2018.
This is by far the largest increase in the NHS workforce this decade. However, professionally qualified clinical staff (2.2%) and clinical support staff (2.8%) have grown more slowly than NHS infrastructure support staff (4.7%) – see Table 1.
Table 1: Change in staff groups in the NHS in England (%), Hospital and Community Health Service, March 2018–March 2019 (FTE)
|
Staff group |
2018 |
2019 |
Change |
% change 2018/19 |
August 18 to August 19 |
|
Professionally qualified clinical staff |
573,983 |
586,771 |
12,788 |
2.2 |
1.5 |
|
Doctors |
109,346 |
112,031 |
2,685 |
2.5 |
2.2 |
|
Nurses and health visitors |
285,745 |
290,010 |
4,265 |
1.5 |
2.0 |
|
Midwives |
21,790 |
21,870 |
80 |
0.4 |
0.6 |
|
Ambulance staff |
20,552 |
21,610 |
1,056 |
5.1 |
* |
|
Scientific, therapeutic and technical staff |
136,549 |
141,250 |
4,701 |
3.4 |
3.4 |
|
Support to clinical staff |
318,133 |
327,018 |
8,886 |
2.8 |
* |
|
Support to doctors, nurses and midwives |
245,602 |
252,060 |
6,458 |
2.6 |
4.0 |
|
Support to ambulance staff |
15,219 |
15,979 |
760 |
5.0 |
* |
|
Support to scientific, therapeutic and technical staff |
57,312 |
58,980 |
1,667 |
2.9 |
3.0 |
|
NHS infrastructure support staff |
167,617 |
175,476 |
7,859 |
4.7 |
4.7 |
|
Central functions |
82,649 |
86,157 |
3,507 |
4.2 |
5.5 |
|
Hotel, property and estates |
52,380 |
54,763 |
2,384 |
4.6 |
3.4 |
|
Senior managers |
10,233 |
10,816 |
583 |
5.7 |
5.3 |
|
Managers |
22,355 |
23,740 |
1,385 |
6.2 |
4.7 |
|
Other/unknown |
4,551 |
4,373 |
-178 |
-3.9 |
-42.7 |
|
Total |
1,064,283 |
1,093,638 |
29,355 |
2.8 |
3.0 |
* Changes to the way ambulance staff are categorised means that these figures are not consistent with previous years
Source: NHS Digital. NHS Hospital and Community Health Service (HCHS) monthly workforce statistics – March 2019 (2019).
As in recent years, the largest percentage increase was among managers (6.2%) and senior managers (5.7%). The number of managers and senior managers has now increased for 29 consecutive months. Of the professionally qualified clinical staff groups, the largest growth was among ambulance staff (5.1%). The number of hospital and community health service doctors has risen by 2.5% (2,682 FTE), a slightly smaller increase than in the previous year. Most of this increase is in the number of consultants (up by 1,380 FTE) and those in core medical training (up by 16.1% to 11,732 FTE).
A recent review of medical education, conducted by Health Education England (HEE), highlighted that more than half of those completing the foundation programme were taking one or more years out of training. Quoting a study by the General Medical Council (GMC), HEE reported that ‘Many of these doctors remain in the health care workforce either on a regular or ad-hoc basis but the review noted the detrimental effect this uncertainty can have on workforce planning.’ HEE noted that ‘Doctors currently in training told the review that deferral of entry to specialist training was because of many factors including “burnout”, the limited time trainees have to make career decisions and a desire to gain other experiences and skills, both within and outside of medicine.’
Over the past year, the number of allied health professionals (AHPs, who are within the scientific, therapeutic and technical staff group) has grown by 2.7% (1,756 FTE), up on the 2.3% growth seen in 2017/18. In absolute terms, the largest increases have been in diagnostic radiography, occupational therapy and physiotherapy, with larger percentage increases in some of the smaller specialties, such as orthoptics. AHP support staff numbers have risen at a similar rate, but at an increased pace compared with the previous year. The number of health care scientists also increased at a similar rate (2.6%), to just over 24,600 FTE.
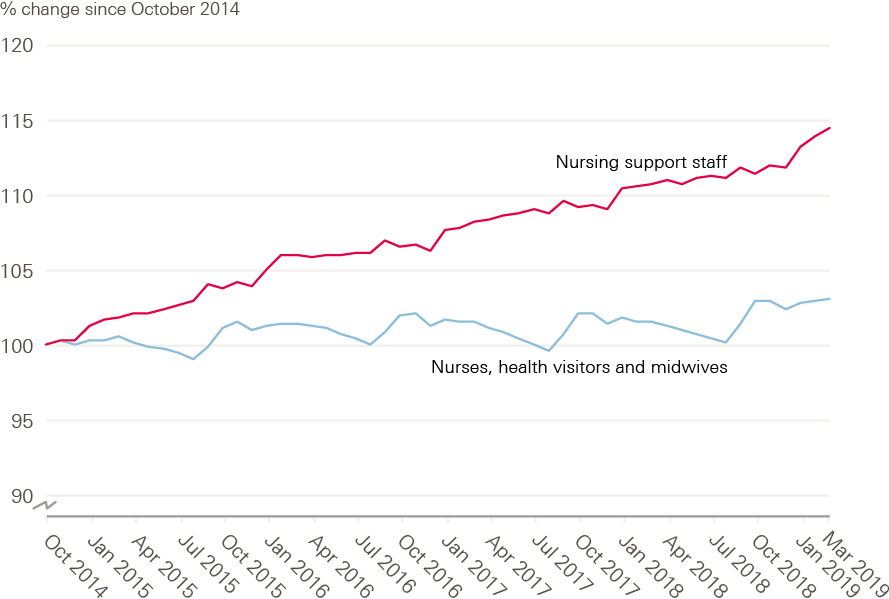
Midwives, nurses and health visitors
Compared with the rising numbers in the staff groups summarised above, the number of midwives, nurses and health visitors employed in the NHS has changed little, while advertised vacancies have risen. In the 12 months to the end of March 2019, the number of midwives grew by 0.4% (an increase of just 80 FTE), while nurse and health visitor numbers rose by 1.5%. At the same time, the FTE number of posts advertised in the period 1 January to 31 March 2019 was 37,378, some 7.6% higher than the same period in 2018. Even this limited growth masks some wide differences between work areas (see Figure 2). For example, while the FTE number of staff employed in children’s nursing grew by 2.7%, mental health nursing numbers only grew by 0.6% and community nursing services by 0.7%.
Figure 2: Change in nursing workforce by work area (index 100 = October 2014), October 2014–March 2019
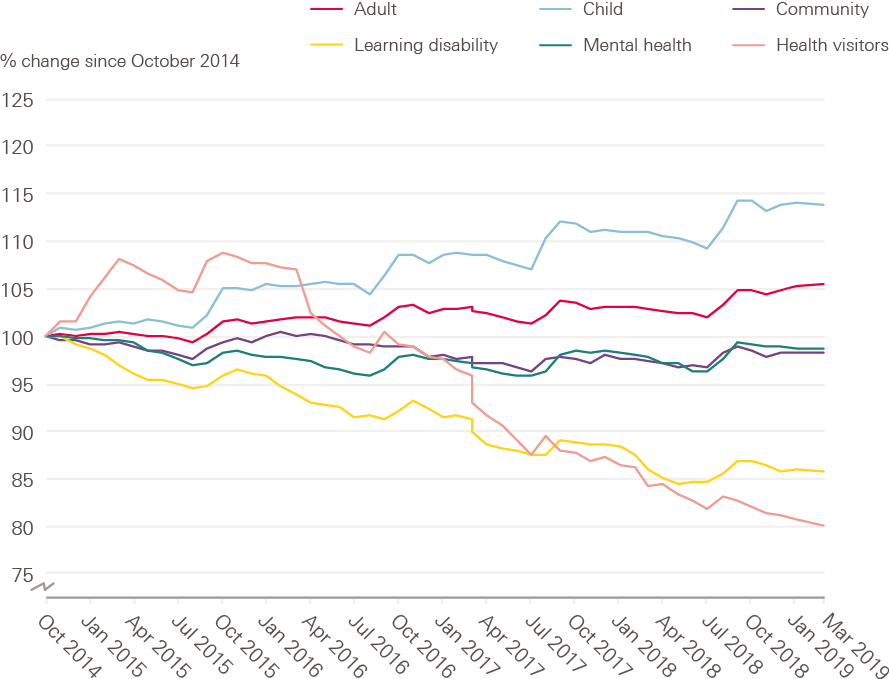
Source: NHS Digital. NHS Hospital and Community Health Service (HCHS) monthly workforce statistics – March 2019 (2019).
Moving care from hospital to community settings has been a stated policy priority for successive governments. But, judging by changes in the nursing workforce, there is little evidence that this is being translated into practice. The number of district nurses has increased slightly over the past year (by 116 to 4,331 FTE), but shows an overall decline in recent years, while the number of health visitors has continued a long-term decline, falling 7.1% in the last year (to 7,588 FTE). The number of other registered nurses working in community settings has scarcely changed, at 24,560 FTE – almost exactly the same as it was three years ago (see Figure 3). In previous reports we have also highlighted the drop in school nurse numbers. This has continued: the number of school nurses fell by a further 3.1% to just 2,220 FTE.
Figure 3: Change in community nursing and health visiting, selected occupations (index 100 = October 2014), October 2014–March 2019
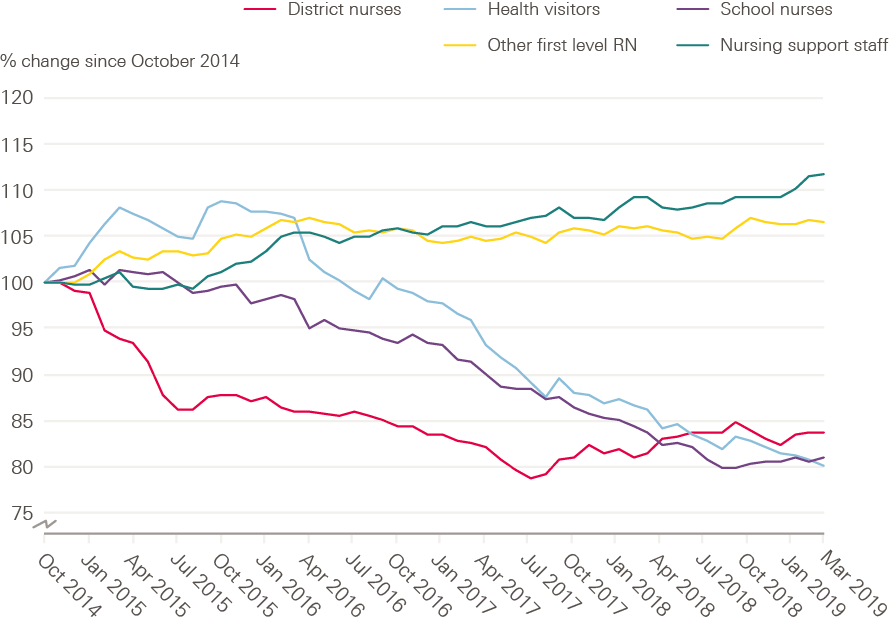
Source: NHS Digital. NHS Hospital and Community Health Service (HCHS) monthly workforce statistics – March 2019 (2019).
As a consequence, the relative sizes of the hospital and community nursing workforces have diverged even further over the past year (see Figure 4). While the number of nurses working in adult hospital nursing (acute, elderly and general) grew by 2.2% to 179,745 FTE, those working in community nursing (including school nursing and health visitors) actually fell by almost 1% to 43,218 FTE, while excluding health visitors this rose by just 0.7%.
Figure 4: Change in adult hospital nursing and community nursing/health visiting in the NHS in England (index 100 = October 2014), October 2014–March 2019
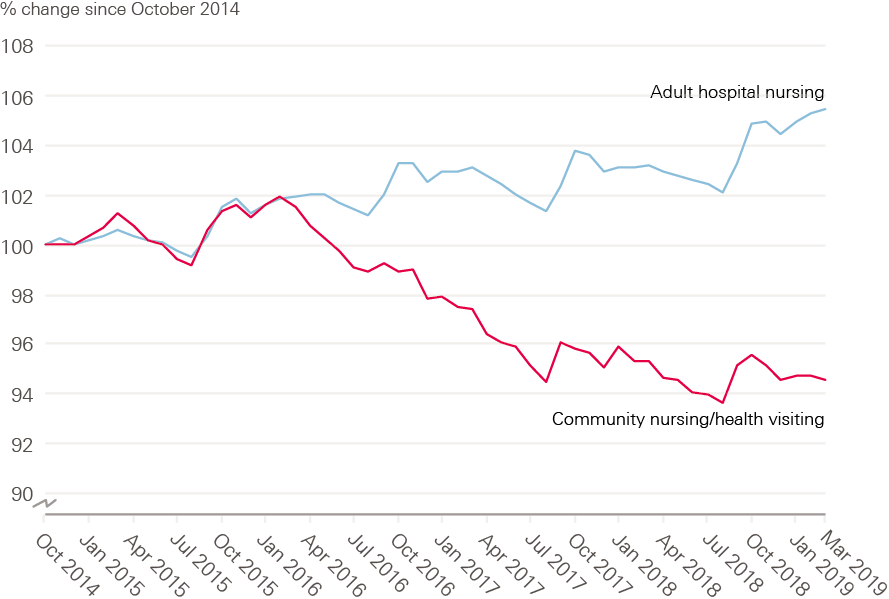
Source: NHS Digital. NHS Hospital and Community Health Service (HCHS) monthly workforce statistics – March 2019 (2019).
The NHS long term plan reaffirms the commitment of the Five year forward view, the 2014 plan for the NHS, to improve mental health services with new ring-fenced funding. Improving these services depends crucially on recruiting and retaining enough appropriately skilled staff. However, the number of nurses working in this area has risen by only 0.6% (216 FTE) over the last year (to 36,269 FTE), bringing it back up to the level it was four years ago and still well below where it was at the start of the decade. The number of nurses working in community mental health has risen by 2.9% (509 FTE) in the past year to 17,512 FTE, but the number of nurses working in other areas of mental health has fallen over the same period by 1.5%, to 18,757 FTE. The combined number of nurses in community and mental health nursing, including health visitors, is below the levels in 2014.
As noted earlier, registered nurses are also employed in social care. There are about 41,000 registered nursing jobs in adult social care in England, but there has been a significant decrease in recent years (of 10,500, or 20%, since 2012), and by 2% between 2017/18 and 2018/19. Skills for Care notes that this decline could be related to recruitment and retention issues, ‘but also may be a result of some organisations creating “nursing assistant” roles to take on some tasks previously carried out by nurses.’
Nursing support staff
Nursing support staff include nursing assistants and auxiliaries, nursing associates, nursing assistant practitioners and health care assistants (see Box 2).
Box 2: Nursing support staff roles
Nursing support staff work alongside registered nurses to deliver patient care in many care environments, but the ‘mix’ between registered nurses and these nursing support staff varies between work areas. In contrast to the modest 1.5% growth in the number of registered nurses described above, the number of nursing support staff, who are within support to clinical staff, has grown more rapidly, by 3.4% (5,074 FTE) in the 12 months to the end of March 2019. This is the biggest increase in nursing support staff for 4 years.
Figure 5: Change in FTE numbers of nurses, health visitors, midwives and
nursing support staff in the NHS in England (index 100 = October 2014),
October 2014–March 2019
Source: NHS Digital. NHS Hospital & Community Health Service (HCHS) monthly workforce statistics – March 2019 (2019).
The number of staff in the comparatively new role of nursing assistant practitioner has risen by 14.3% in the last year to 5,994 FTE, overtaking the growth in health care assistants (2.7%) which now number 66,281 FTE. The new role of nursing associate started to appear with the opening of the Nursing and Midwifery Council’s (NMC) nursing associate register in January 2019. By the end of March 2019, there were 331 FTE nursing associates in employment, with a further 2,479 FTE trainee nursing associates in post. In contrast to the growth in these new categories of nursing support staff, the number of traditional, ‘on the job’ trained nursing assistants and auxiliaries has continued to decrease, falling 1.6% (783 FTE) to 47,193 FTE in the year to the end of March 2019.
Again, however, community services have fared even less well. In hospital acute, elderly and general care, the number of nursing support staff has increased by 4.8% (4349 FTE) to 97,839 FTE, compared with a rise of just 2.2% (342 FTE) in community services (15,736 FTE).
General practice
We continue to see a fall in the number of qualified permanent general practitioners, despite the government’s target, set out in 2016 in the General practice forward view, for an additional 5,000 GPs by 2020. This is part of an ongoing set of changes in skill mix and work patterns – alongside increasing numbers of non-permanent staff, and other clinical staff such as health care assistants and pharmacists.
The fall in permanent qualified GP numbers is occurring alongside a rise in the number of non-permanent staff – with increases in the numbers of GP registrars and GP locums.
The category of GP registrars includes foundation and specialty registrar trainees on placements in general practice. Although the source data on registrars has recently changed, indicative comparisons can be made back to 2015. These show that registrar numbers changed very little between March 2016 and March 2018, at around 5,200 FTE, but grew by 14.2% in the 12 months to March 2019, reaching a total of 6,039 FTE. If these trainees are included (so that the definition is restricted to ‘regular’ GPs), the total number of GPs is 33,420 FTE, an increase of 0.9% on 2018.
GP locums are temporary GPs who may be providing cover for permanent staff, or choosing to work more flexibly – sometimes referred to as ‘freelance GPs’. The number of locums has increased by 0.9% over the past year, to 1,316 FTE. Comparisons before this point are not possible due to changes in data collection.
These two groups – registrars and locums – account for 7,355 FTE staff in general practice, which is 21% of the workforce (up from 19% in March 2018). Including them in the total number of GPs brings it to 34,736 FTE GPs at the end of March 2019, 0.9% higher than at the same point in 2018.
However, over this year the number of patients registered at GP practices has increased by 1.2%, or more than 700,000 people. The result is that the number of GPs per person, even including registrars and locums, has fallen over the past year.
In 2019, 45% of male GPs worked 37.5 hours or over per week, compared with 15% of female GPs. With an ageing male GP workforce (48% are aged 50 or older, compared with 31% of female GPs) the number of ageing male qualified permanent leavers is likely to rise. Although trainee numbers are increasing, just over 60% of GP registrars are women. This is significant because, historically, women have been more likely to work part time; if this trend continues, the number of new trainees required to replace the outflow to retirement will be even higher.
The majority of staff in general practice are not GPs. In March 2019 there were 29,459 FTE other clinical staff (including nurses) and 67,036 FTE admin or non-clinical staff working in general practice. The number of non-GP clinical staff has grown faster than the number of permanent qualified GPs – in March 2016 there were 6% fewer non-GP clinical staff, but by March 2019 they had overtaken GPs to outnumber them by 8%.
Although there are a wide variety of different nursing roles in general practice, the vast majority (over 90%) of nursing staff are either practice nurses (11,484 FTE) or advanced nurse practitioners (3,555 FTE). The number of practice nurses has been falling in recent years, declining by a further 0.4% in the last 12 months. However, numbers of advanced nurse practitioners have grown sharply, rising by 9.8% in the year to March 2019. Some of this growth will be practice nurses converting to the new advanced nurse practitioner roles.
Numbers of other direct patient care staff working in general practice have also risen, by 5.6%, to 12,976 FTE over the year to the end of March 2019. Most of these staff are health care assistants (6,928 FTE), dispensers (2,506 FTE), phlebotomists (727 FTE) and pharmacists (1,029 FTE). This last workforce has grown substantially since March 2016, when there were only 276 FTE pharmacists.
As outlined above, ‘counting GPs’ is not straightforward and differing trends emerge depending on the choices made over which groups to include and exclude. The issue is further complicated by the fact that GP workforce statistics are also relatively new, and are subject to changes in data sources and methodology; they also include estimates for practices where data has not been submitted. In the context of ongoing shortages of GPs, high-profile commitments to improving GP numbers, and significant ambitions to change skill mix in general practice, it will be important to improve the consistency and reliability of these data to help track progress and understand changes.
Summary
Year-on-year analysis shows that the NHS in England had a total workforce of 1.24 million people working in hospital and community health services in March 2019. There has over the year been an overall increase of 2.8% (29,355) in the full-time equivalent (FTE) workforce to March 2019. This is by far the largest increase in the NHS workforce this decade. Professionally qualified clinical staff (2.2%) and clinical support staff (2.8%) have grown more slowly than NHS infrastructure support staff (4.7%). In addition, in the three months to 31 March 2019, the number of posts advertised as vacant was 2.4% higher than in the same period of 2018, at 89,589 FTE.
The relative sizes of the hospital and community nursing workforces have diverged even further over the past year. While the number of nurses working in adult hospital nursing (acute, elderly and general) grew by 2.2% to 179,745 FTE, those working in community nursing (including school nursing and health visitors) actually fell by almost 1% to 43,218 FTE, while excluding health visitors this increased by just 0.7%.
In contrast to the modest 1.5% growth in the number of registered nurses, the number of nursing support staff has grown by 3.4% (5,074 FTE) in the 12 months to the end of March 2019. This is the biggest increase in nursing support staff for four years. Growth of nursing support staff has been much higher in acute care (4.8%) than in community services (2.2%).
The number of GP practice nurses has continued to decline, by a further 0.4% in the last 12 months; but the number of GP-based advanced nurse practitioners has grown sharply, rising 9.8% in the year to March 2019.
At the end of March 2019, the number of permanent qualified GPs was 27,381 FTE, down 1.6% on 2018. This is 4.6% fewer permanent qualified GPs than in March 2016, continuing a long-term decline.
* Core medical training is the 2-year part of postgraduate medical training following foundation years one and two. Successful completion of core medical training is required to enter higher training in the medical subspecialties.
† Health care scientists comprise those working in laboratory (pathology) sciences, physiological sciences, medical physics and clinical engineering, and bioinformatics.
‡ Those on the Nursing Associate Apprenticeship programme undertake academic learning one day a week and work-based learning the rest of the week. Qualified nursing associates can train as a registered nurse by undertaking a shortened nursing degree course.
§ Figures exclude GPs working in settings other than GP practices.
Student nurses
The UK picture
This year, the number of applicants to nursing courses at higher education institutions (HEIs) in England increased for the first time since the NHS bursary was withdrawn in 2017. This 4.6% increase reversed two years of decline, in which the number of applicants fell by almost a quarter. The number of applicants has now risen to 40,780, but remains below the figure for 2017. The trend in Scotland, where the NHS bursary has been retained and its value increased, is for a 6.7% increase in the most recent year, taking the number of applicants to its highest ever level.
The characteristics of nursing applicants remain distinctly different from those of the general population of applicants to university-based education, as recorded by the Universities and Colleges Admissions Service (UCAS). Nursing applicants are more likely to be female – although applications from men are increasing, they still account for fewer than 10% of all applicants. Nursing applicants are also more likely to be older. With the ending of the NHS bursary in England the proportion of applicants who are older students (aged 20 and over) has been falling. Nevertheless, the majority (63%) of applicants are still aged 20 and over, compared to a third of all applicants to higher education.
As we know from previous years, the trend in applicant numbers is not necessarily the same as that of acceptances. In 2018 there were only 80 fewer acceptances in England despite a 13.6% fall in applications compared with 2017.
We will not know how many applicants have been accepted onto nursing courses starting in 2019 until UCAS releases the end-of-cycle statistics. In the latest set of figures, released 28 days after A level results day, the number of applicants placed on nursing degree courses at UK universities was 28,120, some 4.6% higher than at the same point in 2018. The number of applicants from England who have been placed at universities in the UK is up by 3.9%, at 21,030. This compares with increases of 5.2% for applicants from Wales, 4.8% for Northern Ireland and 6.9% for those from Scotland.
Table 2: Number of acceptances to nursing courses 28 days after A level results day, by domicile of applicant
|
Country: |
2010 |
2011 |
2012 |
2013 |
2014 |
2015 |
2016 |
2017 |
2018 |
2019 |
% change |
% change |
|
England |
20,570 |
18,380 |
18,500 |
18,620 |
20,660 |
20,670 |
22,040 |
20,820 |
20,250 |
21,030 |
7% |
-5% |
|
Scotland |
3,060 |
2,900 |
2,590 |
2,640 |
2,970 |
2,950 |
2,950 |
3,200 |
3,340 |
3,570 |
-4% |
21% |
|
Wales |
1,050 |
1,080 |
1,160 |
1,280 |
1,270 |
1,500 |
1,580 |
1,630 |
1,720 |
1,810 |
50% |
15% |
|
Northern Ireland |
510 |
490 |
530 |
910 |
940 |
950 |
1,100 |
1,070 |
1,050 |
1,100 |
116% |
0% |
How the UK compares internationally
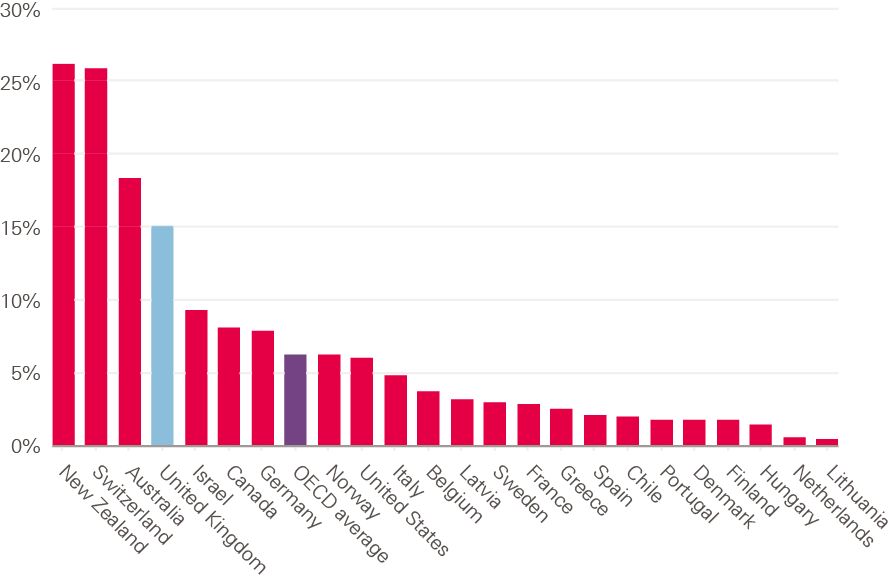
Data from the Organisation for Economic Co-operation and Development (OECD) presents the opportunity to assess how many nurses the UK is training, compared with other high income countries. Caution must always be exercised when interpreting such international comparisons, but it can help us better understand and contextualise the UK situation. Analysis of the data suggests that significantly fewer nurses graduate per capita in the UK than in most other OECD countries (see Figure 6).
Figure 6: Number of nurse graduates per 100,000 population,
OECD countries, 2018 or nearest year
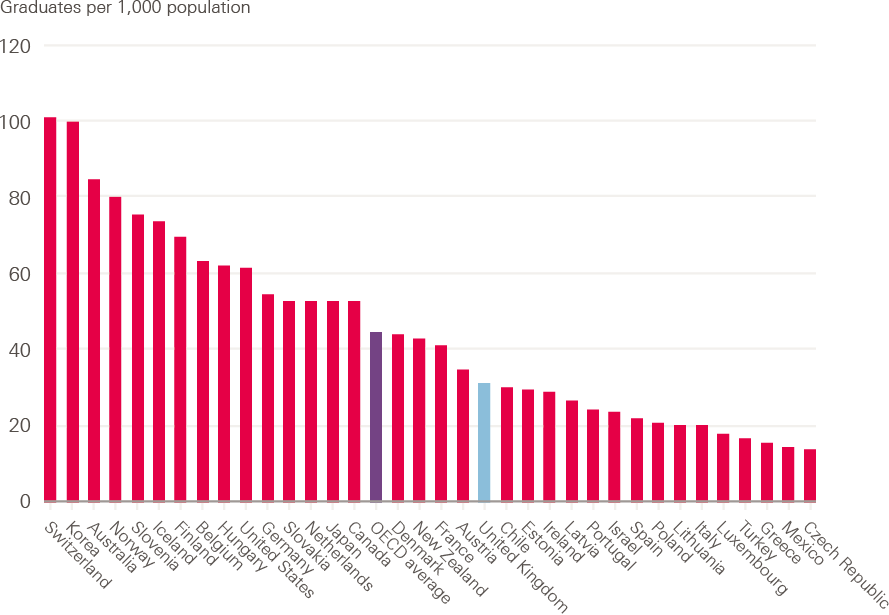
Source: Organisation for Economic Co-operation and Development (OECD). Nursing graduates (indicator) (2019).
Using the indicator of nurse graduates per 100,000 population (the number of students who have obtained a recognised qualification required to become a licensed or registered nurse) gives a broad-brush ‘league table’ of how many new graduate nurses are potentially entering the labour market in each OECD country. The UK is towards the bottom of the table, with approximately 30 new nurse graduates per 100,000 population graduating each year. This is less than half the graduation rate in Australia (where there are more than 80 nurse graduates per 100,000 population), and half the rate of the USA.
The OECD notes that ‘In response to concerns about current or anticipated shortages of nurses, many OECD countries have taken steps in recent years to expand the number of students in nursing education programmes.’ However, a more detailed trend analysis of nurse graduation rates in the UK and some comparator countries since 2001 shows that the UK not only reports a lower graduation rate than most other OECD countries, it also has not exhibited the same rate of growth of graduations as the selected comparator countries of Germany, Australia and the USA (see Figure 7).
Figure 7: Trends in nurse graduation rates since 2001, selected OECD countries
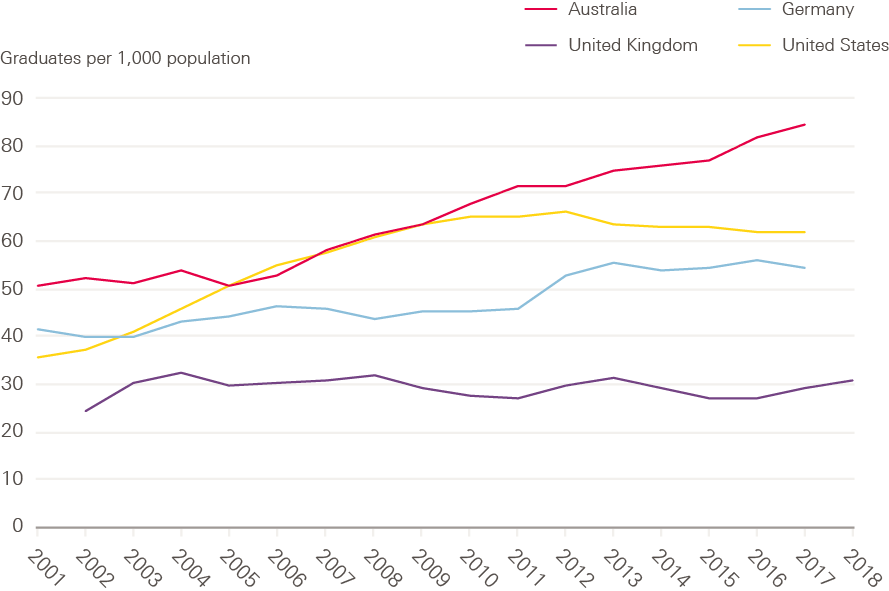
Source: Organisation for Economic Co-operation and Development (OECD). Nursing graduates (indicator) (2019).
In the next section, our analysis of UCAS data will highlight that there was little indication, so far at least, of the claimed boost to student numbers from the changed funding model in England. Applications have dropped, and although applicant numbers are up slightly in the most recent year in England, the other UK countries that have retained some type of bursary model have seen a higher percentage increase than England. Analysis of OECD data suggests that the UK has been producing a significantly lower relative rate of new nurse graduates than most OECD comparator countries, and that it has not shown the same increase as some other OECD countries in recent years. In the next sections we will examine recent trends in applications and acceptances in England in more detail, in order to assess the policy implications.
Trends in applications and acceptances by branch of nursing and course
While it is important to look at the total numbers of people going into nursing courses, this can hide variation between different branches of nursing education (adult, children’s, learning disability and mental health), and different parts of the country. With more than 80 providers of undergraduate nursing courses across the country, data from different providers and different courses varies markedly. For example, in previous reports we have pinpointed concerns about the impact a reduction in mature applicants (those aged 20 or over) could have on courses such as learning disability and mental health nursing, more than others. This concern has also been raised by the Council of Deans, highlighting that older students are thought to be more debt adverse, and so the changes in the bursary could adversely impact these courses.
This is of particular concern given that there are already shortages of nurses in these areas. Analysis of the NMC register shows that the number of learning disability nurses fell for the fourth year in a row in 2018/19, and the number of mental health nurses is still 2,000 below the number on the register in 2015.
To provide more detail on some of this variation, we have analysed course-level data between 2014 and 2018 from UCAS to see how applications and acceptances have varied. A course is a specific entry route at a specific university – for example, Adult Nursing at London South Bank University. We have not used the Joint Academic Coding System codes for the courses as our analysis has shown these to be inaccurate. Instead, we categorised courses based on their course name using text-matching methods, and manually checked all courses accepting more than 10 students. While these course names are also inconsistent – with more than 170 different course names for nursing – they give a better indication of the contents of the course.
As noted above, there are four main branches of nursing: adult (which accounts for almost 60% of all places), mental health (15%), children’s (12%), and learning disability (2%). The ‘B7 – nursing’ UCAS categorisation also incorporates midwifery, dental nursing and other nursing courses, including dual registration courses. We have excluded these courses (which account for about 15% of acceptances in the subject group) from our analysis, which focuses on the four main branches of nursing. As a result, our numbers will not match the overall numbers reported in the previous sections.
In England, there have been changes to the student finance system, while the other three UK countries have retained variants on the bursary system. This will have potentially impacted students differently depending on a complex interaction of: which country they live in (and for how long they have been living there), which country they are applying to study in, and their eligibility for new forms of funding support. We cannot directly monitor this at course level, but we have limited our analysis to courses in England, which will account for most of this impact.
What has happened to the number of nursing applicants?
The overall fall in the number of nursing applicants has been widely reported, although the number of acceptances has held up. This is a result of the high number of applicants relative to places: four in every 10 applicants were accepted before 2017, and the figure is now six in 10.
At a national level, our analysis highlights that the drop-off in applicants was higher for learning disability and mental health nursing than for the other branches. However, if some applicants are applying to multiple different branches, these figures may not reflect the true picture due to double counting of students.
We can see the impact more clearly by looking at specific courses (see Figure 8). Nearly all courses that were running between 2014 and 2018 are now recruiting from a smaller pool of applicants. In particular, learning disability nursing courses, all of which had fewer than 500 applicants in 2014, have had an average reduction of more than 50% in the number of unique applicants. This raises serious concerns about the viability of these courses.
Figure 8: Median reduction in number of unique applicants to courses, by branch of nursing, 2014–18
Source: Analysis of UCAS data
What has happened to the number of acceptances?
Reductions in the numbers of nursing applicants are concerning because they reduce the pool that universities can choose from, and may limit student numbers or the quality of applicants in the long run. However, our main focus in the short term is what has happened to the numbers of acceptances, because students starting their training represent the nurses who may in the future be available to the NHS (although only around half of them will translate to FTE starters, due to attrition during training, and people joining non-NHS settings or taking on non-health work).
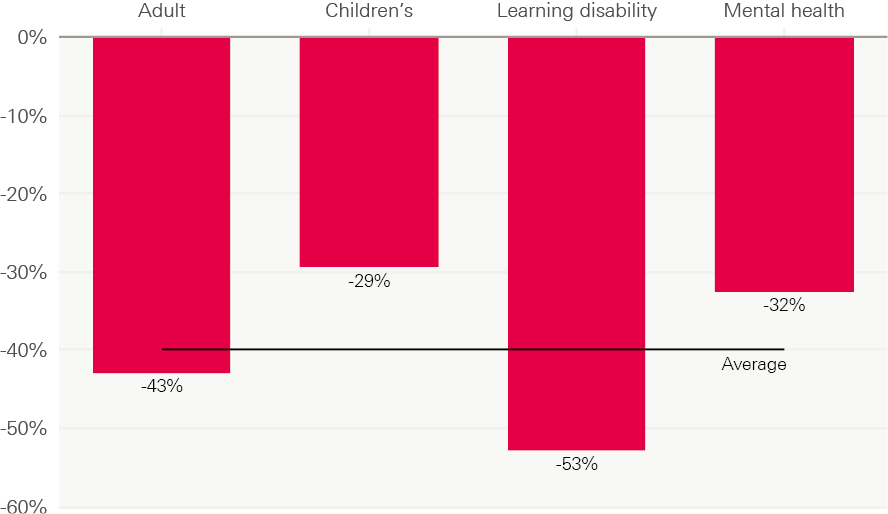
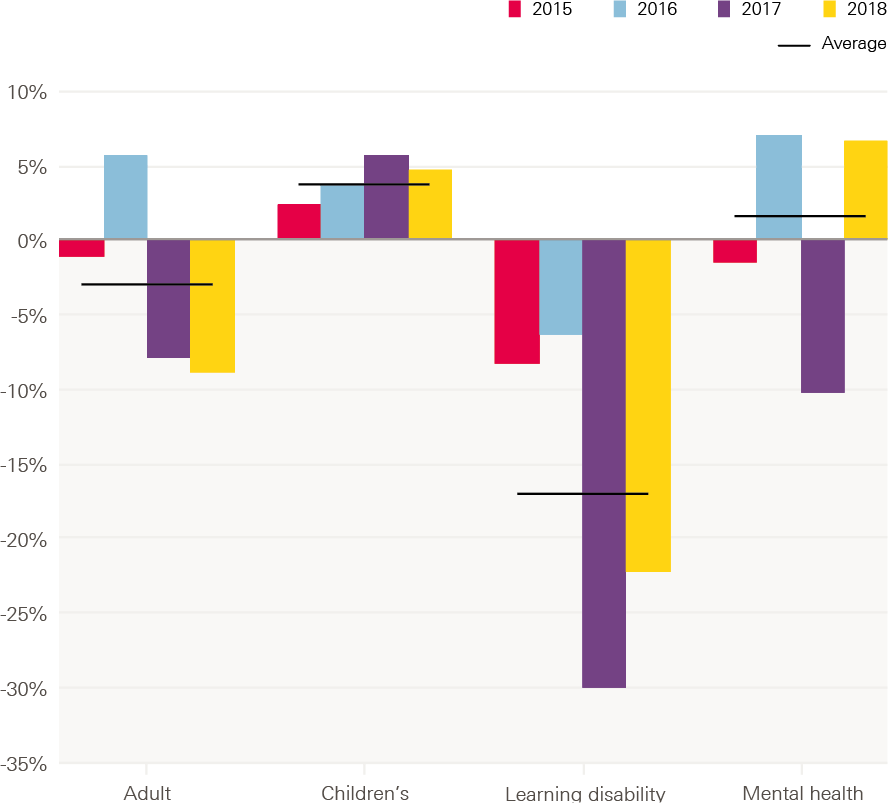
As shown in Figure 9 below, the biggest overall impact has clearly been on learning disability nursing, with the number of students accepted dropping by 30% in 2017, then by a further 10% in 2018. By contrast, the number of acceptances to children’s nursing has held up strongly and grown year-on-year.
Figure 9: Percentage change in number of acceptances by branch of nursing, by year, 2014–18
Source: Analysis of UCAS data
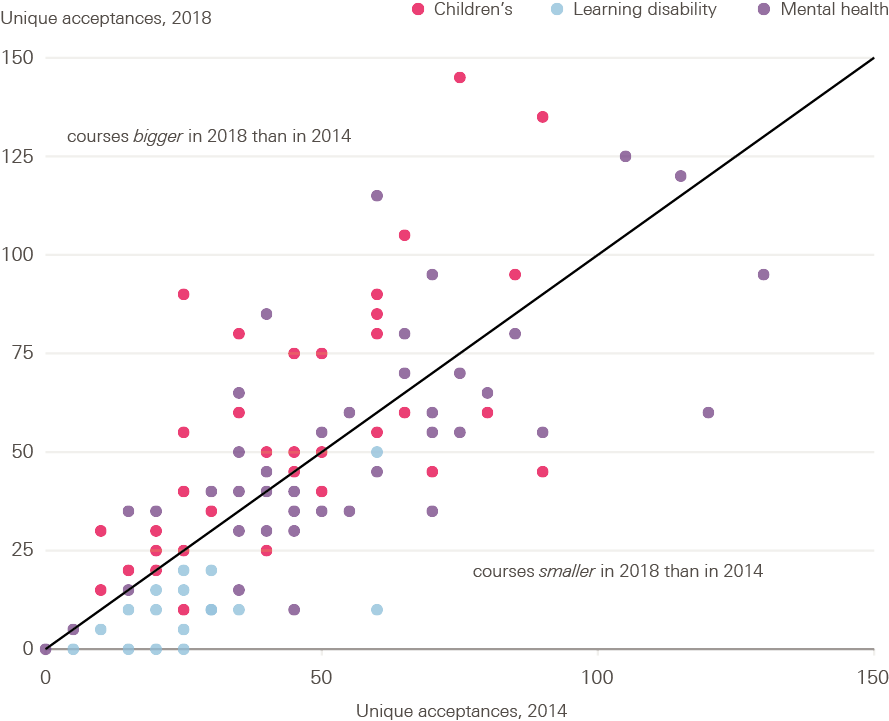
Figure 10, below, shows the change in number of acceptances by course between 2014 and 2018, excluding adult nursing courses. This shows all courses which run in both years, and so excludes courses which are new or which have been discontinued. Courses above the diagonal line have increased their intake between 2014 and 2018; those below the line have decreased it. The learning disability courses are largely in the bottom left-hand corner – smaller courses with reduced size since 2014 – with all continuously running learning disability courses being smaller in 2018 than in 2014. This is in contrast to children’s nursing, where around two-thirds (63%) have increased in size.
Figure 10: Percentage change in number of acceptances 2014–18 by nursing course, by size of course, 2014
Source: Analysis of UCAS data
How has the pattern of applicants varied by age?
One concern we have raised before is the fact that the biggest drop-off in applicants was among more mature students, who have historically been more likely to apply for learning disability and mental health nursing than younger applicants.
Our analysis of the data reinforces this concern, with clear differences between the age profiles of students in the different branches of nursing. In particular, in both 2014 and 2018 the age profiles of starters in learning disability and mental health nursing were significantly different from those of children’s nursing.
For learning disability and mental health courses, the average (median) course in 2014 consisted of around 50% students 25 and over. In children’s nursing, for the average course this was just 25%.
We applied a similar analysis to 2018 data to assess and illustrate the change over time. Overall, we saw a similar profile in 2018 to 2014, but with two major differences. Firstly, the profile of children’s nursing students became younger – in 2014, 25% of those on the median course were 25 and over, whereas by 2018 this had fallen to 15%, and only a quarter of children’s nursing courses had more than 25% aged 25 and over. Secondly, the age profile of courses in each branch has spread out, with a much wider range of age profiles represented. The reduction in the number of learning disability courses suggests that some of this increased spread may be due to mature students concentrating into fewer courses or universities.
The different challenges faced by the different branches is stark - the number of 18 and 19 year olds accepted onto children’s nursing courses increased by 45%, while in learning disability nursing it fell by 66%. The result of these changes is not just affecting learning disability and mental health courses, but it is changing the make-up of undergraduate nursing as a whole.
This can also be seen in the number of unique applicants - the pool that individual courses can choose from. It is only in 2018 that for both adult and learning disability nursing courses, the average number of unique applicants under 20 outnumbered those 20 and over. This problem is most acute, however, in learning disability courses due to their size - courses received on average just 9 mature unique applicants in 2018, half as many as in 2014.
Our analysis suggests that the profile of children’s courses has been getting significantly younger; that the drop off in mature students is happening in all courses, not just learning disability nursing; but that this was most serious in learning disability nursing which has had a historically high reliance on mature students and where the courses are small and as such less resilient to these shocks.
Have acceptances varied geographically?
Variation can be seen not just by course, but also by region. This is important because where nurses undertake their training may impact on where they choose to work afterwards, in particular mature students who may choose where to study based on where they live.
Looking only at universities that provide courses in one of the four branches, some areas – such as the West Midlands and the North West – have almost twice as many student nurses starting pre-registration nurse education as the national average across all regions (see Figure 11 below). The South West region reports the lowest number of student nurses going into training.
By comparing acceptances with advertised nursing and midwifery vacancies (a loose measure of recruitment levels) we can see that in some areas with below average numbers of acceptances – such as the South West, London and the South East – there are also high numbers of vacancies. In the South East, for instance, there are almost twice as many vacancies as the national average, but it accepts a lower number of student nurses than the national average. The picture is similar in London. This contrasts with the West Midlands, which trains more nurses but reports lower vacancies than other regions.
These regions differ in many ways, one of which is the size of their populations – the South West is almost twice the size of the East Midlands, for example. Once adjusted for population size these differences are even more stark: with London and the South East in the bottom three regions for the number of acceptances and the top three for the number of vacancies per 100,000 people.
While this geographical variation may not in itself be a problem, it does highlight the importance of having a better understanding of the geographic mobility of nurses. Without this, some relatively ‘undertraining’ regions could be vulnerable to changes in the patterns of cross-region flow, and could then be caught in a vicious cycle if their vacancies were also to rise.
Figure 11: Number of acceptances onto the four branches of nursing, and advertised vacancies, by region
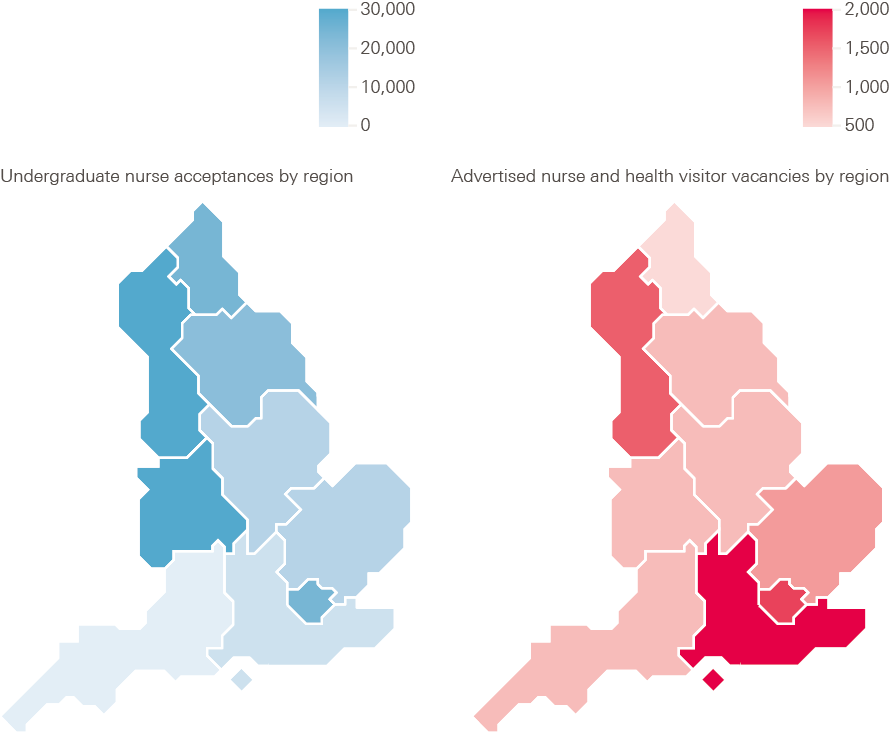
Note: The vacancies are advertised nursing and midwifery vacancies between April 2018 and March 2019 as published by NHS Digital, which gives a measure of need for additional staff. This differs from the vacancy numbers published by NHS England and NHS Improvement, but allows analysis by different geographic areas.
Source: Analysis of UCAS data.
Attrition from pre-registration nurse education
Once student nurses have begun their courses, it is important to track how many complete them in the expected time frame. This is a major data element in any workforce planning, as well as being an indicator of the student learning experience.
Data obtained by Nursing Standard and the Health Foundation through a Freedom of Information (FOI) request show that of 19,566 UK nursing students who began 3-year degrees were due to finish in 2018, a total of 4,695 left their courses early or suspended their studies. Our data cover around three-quarters of total nursing acceptances in the UK. By this measure, the average nursing student attrition rate in the UK is 24.0%, meaning that one in four do not complete their course within the expected time frame. A similar analysis conducted last year showed that the attrition rate for courses finishing in 2017 was 25.0%.
Previous research has shown that students who leave their courses cite reasons including; financial hardship, quality of clinical placements, supervision and mentoring.
When looking at the attrition rate measure by course (see Figure 12), there is some indication that rates of attrition are slightly higher for learning disability courses, although not significantly.
Figure 12: Rate of nursing students leaving or suspending their studies before graduation, by branch, 2015–18
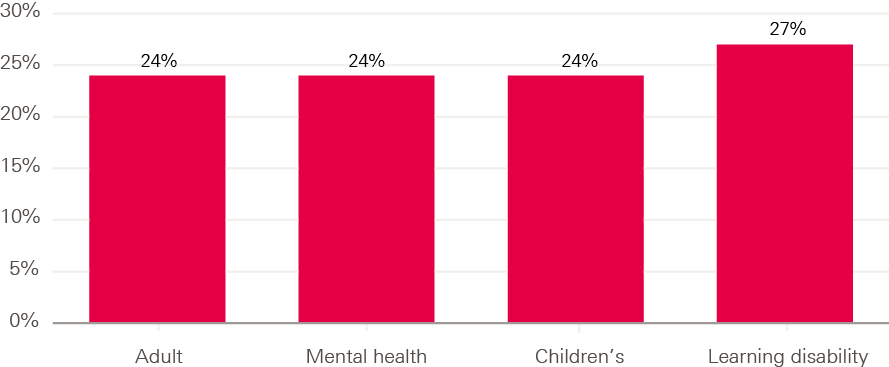
Note: Number of students included in each group is 13,196; 2,868; 2,125; 600. Data are obtained from FOI requests, therefore some caution should be taken in interpreting small differences. For this reason we have mostly focused our analysis on the overall level of attrition in the UK.
Analysis like this can help us understand the rates of nursing students leaving or suspending their training, and how this varies by institution, area and branch of nursing. However, data from FOI requests can vary in quality. Until attrition data are accurately collected, systematically analysed on a full national basis, and routinely made publicly available, this FOI-based survey remains the main source of data to better understand the rates of attrition across the UK.
The international context and international recruitment
International comparisons
In previous years, we have shown how the UK’s health professional profile compares with other high income comparator countries, using Organisation for Economic Co-operation and Development (OECD) data. Caution should be used when interpreting such data, due to differences in definitions, but it does provide scope to make broad-brush comparisons.
The OECD data highlight that the UK is below OECD average both for practising doctors and practising nurses per population. Figure 13 shows the number of practising doctors per 1,000 population in 36 OECD countries, giving some indication of the relative availability of doctors. By this measure, the UK has just under three doctors per 1,000 population. This is below the OECD average and significantly lower than many other western European and Scandinavian countries, but not dissimilar to the USA, Ireland and Canada.
Figure 13: Practising doctors per 1,000 population, 2018 or nearest year
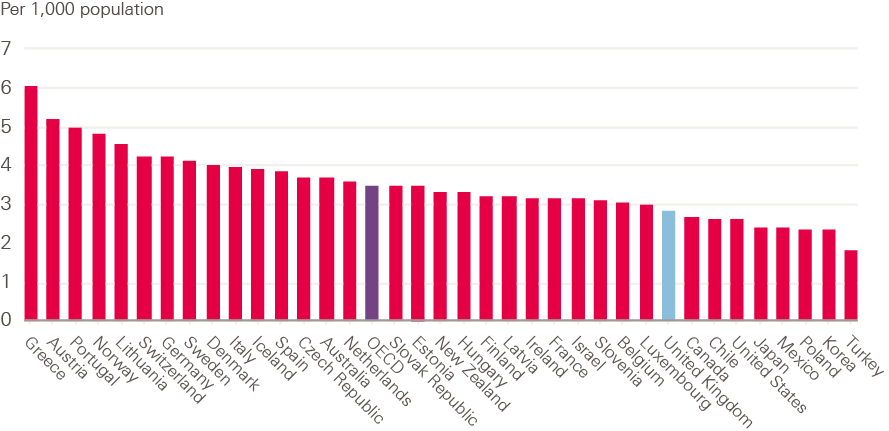
Source: Organisation for Economic Co-operation and Development. OECD Health Statistics 2019 (2019).
The OECD also notes that the growth in the number of doctors per person has been ‘particularly rapid in some countries that started with low levels in 2000, such as Korea, Mexico and the United Kingdom, converging to some extent to the OECD average’. This growth reflects significant policy attention to increasing medical training output in the UK, including the opening of new medical schools.
The UK is also reported to be below the OECD average for practising nurses (see Figure 14). There are approximately eight nurses per 1,000 population in the UK; this is a significantly lower ratio than in the most frequently cited comparator countries in western Europe, North America and Australasia, where the number is more often 10 nurses per 1,000 people, or higher.
Figure 14: Practising nurses per 1,000 population, 2018 or nearest year
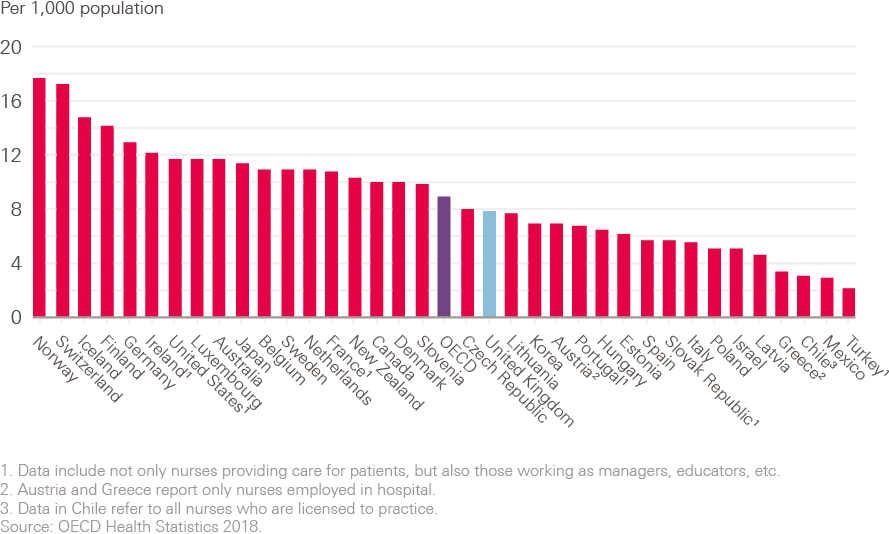
Source: Organisation for Economic Co-operation and Development. OECD Health Statistics 2019 (2019).
The OECD notes that the growth in the number of practising nurses per population has been particularly rapid in countries that already had a relatively high number of nurses in 2000 – such as Norway, Switzerland and Finland – with ‘more modest’ growth in the United States, Canada and Australia. It also highlights that, ‘In the United Kingdom, the number of nurses per capita increased rapidly between 2000 and 2006, but has gradually decreased since then, so that the number per capita was slightly lower in 2016 than in 2000.’ While data for the years since 2016 will show a return to a slow upward trend in the UK, this has not mirrored the overall growth in nursing numbers shown in many comparator OECD countries since 2000.
One area of notable growth is in the number of practising pharmacists. The growth in the UK of pharmacists per 1,000 population has been the second highest of EU-15 countries. As a result it has gone from being below both the OECD and EU-15 averages to above both of them.
Figure 15: Percentage change in practising pharmacists per 1,000 population from 2002–17 or nearest year
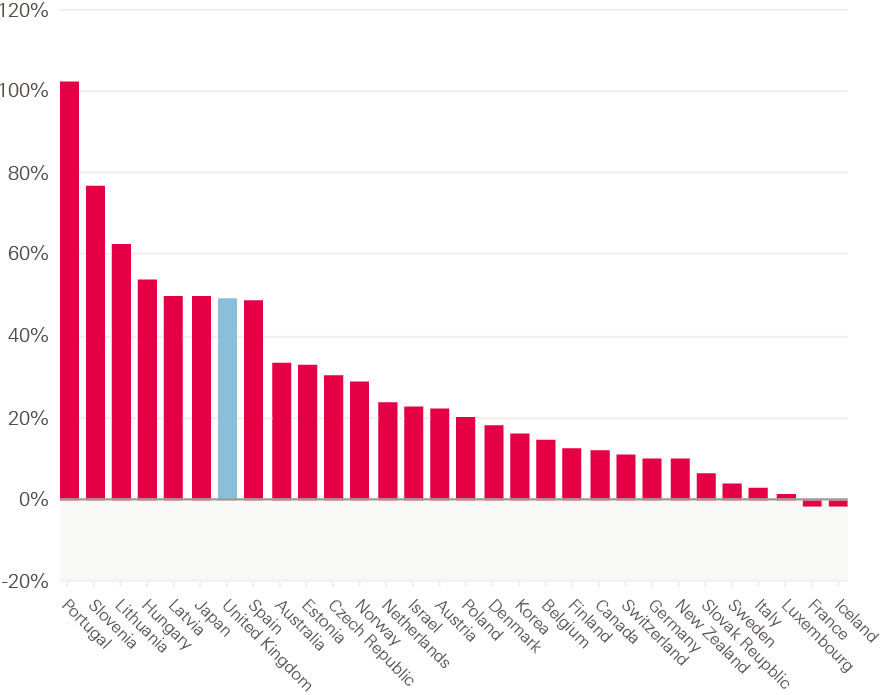
Source: Organisation for Economic Co-operation and Development. OECD Health Statistics 2019 (2019).
Levels of reliance on international health professionals
In previous years, we have highlighted the NHS in England’s long-term, and often significant, reliance on international workers. This has been brought into sharp relief by the referendum vote to leave the EU and the subsequent assessment of its implications for both international health workers already working in the UK, and those who may be recruited in the future. Most recently, as we note in the introduction, additional categories of all medical practitioners, occupational therapists, psychologists, radiographers, speech and language therapists, and social workers have been added to the Shortage Occupation List by the government. This means that these occupations and professions will now join nurses and senior medical staff as categories that can be more easily recruited from other countries.
In this first section we look at how the UK’s reliance on international health professionals compares with other countries, using OECD data, with a focus on doctors and nurses. Figure 16 shows the percentage share of doctors who are ‘foreign trained’ across OECD 29 countries, giving an indication of the extent to which they are reliant on doctors trained elsewhere. It does not tell us when the doctors arrived, but is a loose measure of how ‘self-sufficient’ or otherwise different countries are in terms of the supply of doctors.
The UK reports about one in four doctors as being foreign trained. This is higher than the OECD average of approximately one in six, but not dissimilar to comparator countries such as the USA, Canada and Australia.
Figure 16: Foreign-trained doctors working in OECD countries, 2018 or nearest year, % of total workforce
Source: Organisation for Economic Co-operation and Development. OECD Health Statistics 2019 (2019).
The OECD reports that over the past decade the share of foreign-trained doctors has increased rapidly in Ireland, Norway, Switzerland and Sweden, and steadily in Belgium, France and Germany. In contrast, it has decreased slightly in the United Kingdom ‘as the number of domestically-trained doctors has increased slightly more rapidly’. Even so, the UK had more than 50,000 foreign-trained doctors in 2017.
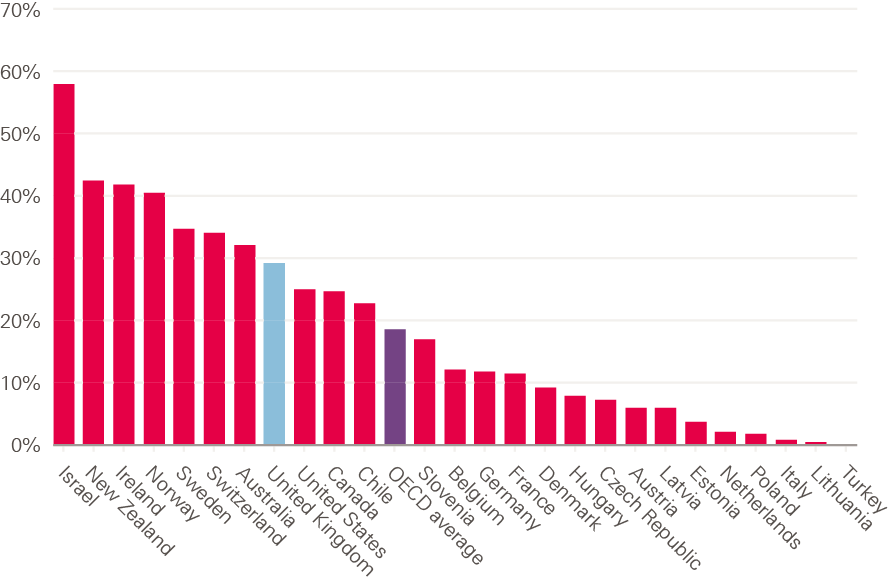
Data on the level of reliance on international nurses is shown below in Figure 17. Overall, there tends to be a lower proportion of reported foreign-trained nurses in OECD countries than doctors. The average across OECD countries is about 6%, with the level in the UK being more than twice as high; but it is lower than in some comparator high income English speaking countries, such as Australia and Ireland, but much higher than in others, such as Canada and the USA.
Figure 17: Foreign-trained nurses working in OECD countries, 2018 or nearest year, % of total workforce
Source: Organisation for Economic Co-operation and Development. OECD Health Statistics 2019 (2019)
The OECD reports that, in absolute numbers, the United States has by far the highest number of foreign-trained nurses, with an estimated number of almost 200,000 registered nurses (RNs) trained abroad; the UK is next highest, having over 100,000 foreign-trained nurses in 2017.
As noted above, reporting on the ‘stock’ of foreign-trained health professionals within a health care system gives some indication of its level of reliance on international staff (or, alternatively, of the shortfall from any target for ‘self-sufficiency’). To get a clearer sense of the extent to which that reliance has shifted over time, and an indication of likely future trends, we can examine data on ‘inflow’ – annual trends in the number of new foreign-trained nurses that register in the UK each year.
In the figures below, data from the Nursing and Midwifery Council (NMC) is used to assess trends in inflow of nurses to the UK. There are almost 700,000 nurses and midwives on the NMC register – the ‘pool’ from which all employers must recruit. The total number of people on the register increased by 5,169 (0.9%) between March 2018 and March 2019. As noted above, more than 100,000 of those nurses were trained in another country, or approximately one in seven of the total number of registered nurses. There are about 33,000 registrants from EU countries, and another 73,000 trained in other, non-EU, countries.
Analysis of annual registration data gives a long-term perspective of changing levels of reliance on international nurses and midwives, as well as an indication of ‘flows’ of nurses into the UK.
Figure 18 below shows the annual number of nurses registering in the UK for the first time, from EU and non-EU countries, since 1990. The pattern is clear. There was a rapid increase in non-EU international inflow in the period up to 2001/2, mainly driven by active recruitment of nurses from the Philippines and India at a time of NHS-funded staff expansion. This was followed by a rapid overall decline in inflow in the period up to 2009/10. The next phase was a period of increased inflow as employers struggled to address shortages – mainly by recruiting from EU countries, such as Spain, Portugal and Italy. Finally, in the most recent period since 2016 and the referendum vote to leave the EU, there has been a rapid decline in inflow from the EU, but a rapid increase in non-EU international inflow – again, mainly from India and the Philippines.
Figure 18: Annual number of new NMC registrants from EU and non-EU countries, 1990-2019
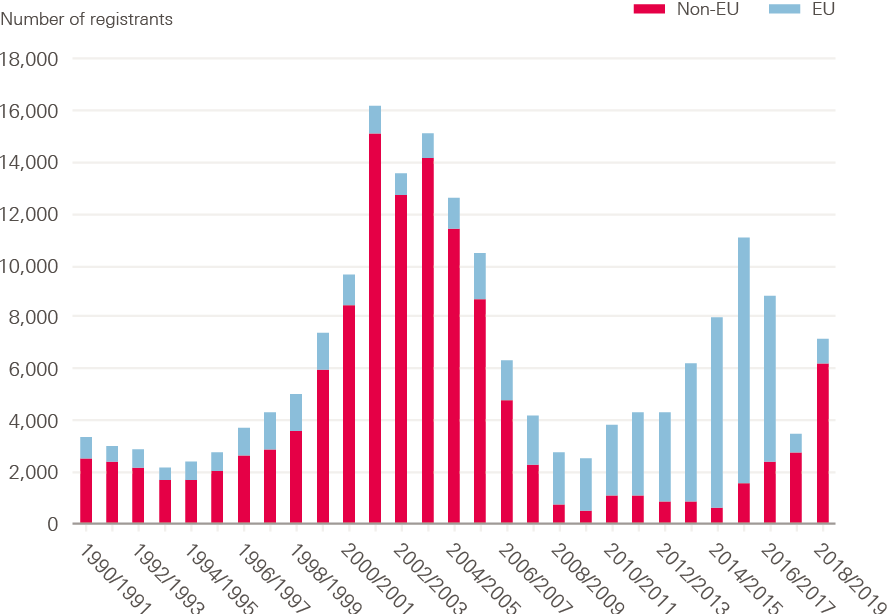
Source: Nursing and Midwifery Council (NMC)/UK Central Council for Nursing, Midwifery and Health Visiting (UKCC), and authors’ analysis.
The NMC notes ‘a significant increase in the number of people from outside the EEA (European Economic Area) joining our register for the first time (an increase of 126.4 percent). The total on our register increased from 68,438 last year to 73,308 this year.’
To put into context the UK’s reliance on an international inflow of nurses (now mainly from non-EU countries): in 2018-19 more nurses first entered the UK register from the Philippines (3,118) than from Scotland, and more entered the register for the first time from India (1,791) than from Wales. Figure 19 compares the UK’s inflow of nursing registrants from international sources (both EU and non-EU) with new registrants coming from UK nurse education, each year since 1990.
Every year, at least one in every 10 new entrants to the NMC register (which makes them eligible to practise as a nurse in the UK), has come from other countries. In most years, this percentage inflow from other countries has been much higher – peaking at over 50% in 2001/2. The level of reliance on international inflow then dropped until 2010, after which there was a second period of growing reliance between 2011 and 2016, followed by a second recent period of decline, and then an increase in the most recent year, 2018/19.
Figure 19: Annual intake of new NMC registrants: % from UK and from international sources, 1990–2019
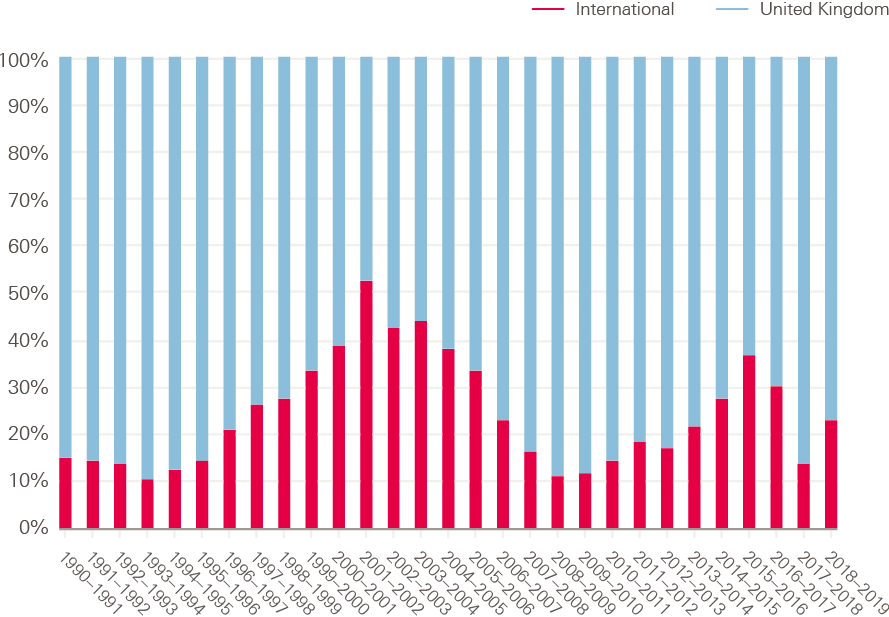
Source: Nursing and Midwifery Council (NMC)/UK Central Council for Nursing, Midwifery and Health Visiting (UKCC), and authors’ analysis.
The recent NMC data suggest that two different factors are impacting on international inflow of nurses to the UK. Shortages are driving an upward trend in the number of UK employers wishing to use active international recruitment. However, this has been constrained by the general approach to UK immigration policy in recent years, and further impacted by the referendum vote to leave the EU and subsequent uncertainties about the status of EU nurses.
The negative impact of immigration policy on inflow has been reduced, at least temporarily. In the introduction to this report, we noted the recent analysis by the Migration Advisory Committee (MAC), which highlighted changes made to immigration rules in 2018 that exempted all doctors and nurses from the immigration cap, leading to what the MAC described as ‘a vast increase of Tier 2 RCoS (Restricted Certificates of Sponsorship) applications being given to nurses and doctors’, – with nurses being the single largest user. The MAC also stated that ‘a significant number of stakeholders reported difficulties in the recruitment of nurses. Vacancy rates have been rising, even with increased employment and they ranked relatively highly in the shortage indicators’. The MAC recommended retaining nurses on the Shortage Occupation List. In addition, attempts have recently been announced to enable ‘fast-tracking’ of applications from international nurses, in order to make recruitment quicker.
Summary
Compared with most OECD countries, the UK has had a significant reliance on international doctors, but unlike key comparator OECD countries, this level of reliance is reportedly dropping. The UK is also above the OECD average in terms of its reliance on international nurses – it has the second largest number of international nurses of any OECD country.
Further analysis of the inflow of nurses to the UK register shows a varied picture across time, but a recent switch from EU inflow – now markedly reduced since three or four years ago – to a growth in inflow from non-EU countries. Uncertainties related to Brexit are a likely main factor in the shift of active recruitment of nurses away from EU countries to non-EU countries, such as India and the Philippines.
¶ This includes all registered pharmacists, not just those working in the NHS.
Retention
One in nine staff leaves the NHS each year, and needs to be replaced if the number of people working in the NHS is to remain consistent, let alone keep up with growing need. The leaver rate of nurses and health visitors increased significantly over this decade, from 8.5% in 2010/11 to 10.7% in 2017/18, before recovering slightly to 10.2% in 2018/19. In nursing, around 2% of the workforce leave the NHS each year at retirement age, while 8% leave before that age. Finding ways to support these staff to stay will be part of the solution to reducing staff shortages in the NHS. It is also important because people leave for a reason – and looking at retention focuses attention on why people leave, and how to improve staff experience and morale. Choosing to leave a job is a complex, personal decision, which can be the result of a number of things, such as work-life balance, pay, morale and job prospects.
Reasons for leaving the NHS
Over recent years, work-life balance in particular has increased as a reported driver, with more than two-and-a-half times as many people citing it as a reason for leaving the NHS in 2018/19 than in 2011/12 (see Figure 20). While this is partly accounted for by more nurses leaving and increased data availability, it has grown from representing 17% of stated voluntary reasons for leaving to 23%, where we have the relevant information. However, the analysis we can do here is limited because the most common reason reported for leaving is ‘other/not known’.
Figure 20: Change in reason for leaving given by staff (for voluntary resignations), 2011–12–2018–19
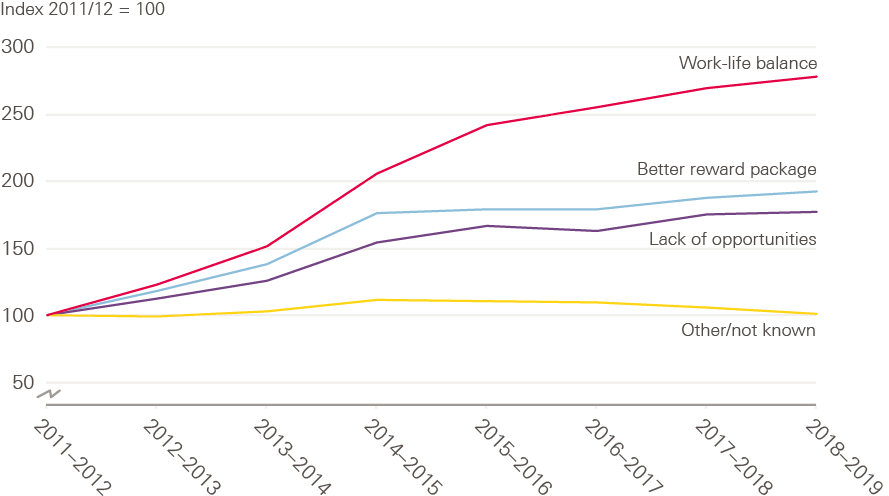
Source: NHS Digital. NHS Workforce Statistics.
Movement within the NHS
Retention is an issue not just in terms of the number of staff leaving the NHS entirely, but also the movement of people from their organisation. Community trusts have much higher rates of staff leaving than other types of trust – and twice as high as acute teaching trusts (see Figure 21). Retention rates are also lower at smaller acute trusts than medium or large acute trusts. Some of these findings will be driven by other factors, such as the types of staff they employ and their geographical location.
Figure 21: Leavers from the organisation, by type, 2018/19
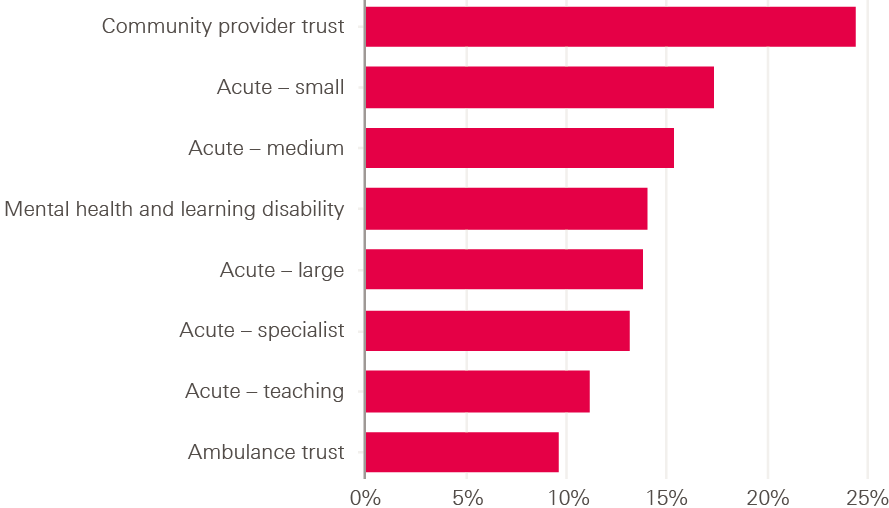
Source: NHS Digital. NHS Workforce Statistics.
While there are some early positive signs from the NHS Improvement retention programme, and some indication that leaver rates have slowed this year, future progress will rely on the NHS’s ability to embed and spread these efforts in the context of ongoing staff shortages.
Key points and conclusion
We noted in the introduction that we will be replacing the annual workforce trends report with a more timely and flexible approach to publishing analysis on trends and immediate ‘pressure points’. This does not mean that we do not see the value in monitoring longer term trends at a national level. This type of analysis both pinpoints emerging challenges and gives evidence about the extent to which current challenges are being met or mitigated. In particular, in this year’s report we have continued to emphasise three key workforce challenges.
1 Increasing nurse numbers to match need
The extent to which there are ongoing and persistent vacant nursing posts in the NHS flags a core challenge of skills shortages. This then ripples out to other sectors where significant numbers of nurses are working or are sought for work, notably in social care and the nursing home sector. Our analysis this year reinforces the points that:
- the UK produces relatively few ‘new’ nursing graduates compared to other OECD countries
- NHS nursing numbers in England have not changed markedly over the last few years
- attrition during pre-registration nurse education continues to be persistently high
- the reliance on international recruitment, which has ebbed and flowed, is on the up again, but with non-EU source countries now the target.
Against this background of supply-side issues, continuing concerns about relatively low increases in student nurse numbers in England become even more pronounced.
Our joint analysis with The King’s Fund and the Nuffield Trust for Closing the gap, published earlier this year, reported that based on current trends, in 10 years’ time the NHS would have a shortfall of 108,000 full-time equivalent nurses. It also suggested that half of this gap could be bridged by increasing the number of nurses joining the NHS from training (5,000 more nurses to start training each year by 2021), by reducing the drop-out rate during training by a third, and by encouraging more nurses to join the NHS once they qualify. In addition, we highlighted the need for 5,000 internationally recruited nurses to be employed each year until 2023/24.
While it is only a few months since that analysis, it is apparent that there is no early indication of significant growth in the number of student nurses, or a reduction in student attrition, and that the international recruitment has ‘switched’ sources from EU to non-EU countries, rather than exhibiting any significant numerical growth. This means that the fundamental challenge remains the same as we set out at that time – and will require action not just in the upcoming NHS people plan but also across government, on issues such as migration and funding.
2 Lack of growth in the primary care workforce
The long-term policy imperative of shifting more care to the primary care sector is not being matched by any significant trend of relative growth in the workforce in primary care. The aim to provide more care at home, and the growing incidence of non-communicable diseases and co-morbidities argues for a multidisciplinary primary health care team, and this was reinforced in the recent Care Quality Commission (CQC) report State of care. In Closing the gap, we highlighted that national efforts to increase the number of GPs need to continue, but that ‘the stark reality is that even with a major focus on increasing the number of GPs in training, we project the numbers of GPs in the NHS will fall substantially short of demand and of the government’s target of an additional 5,000 GPs’. As such, we argue that the only way forward is to make substantial progress towards a new model of general practice, with an expanded multidisciplinary team drawing on the skills of other health care professionals. There is increasingly compelling evidence about the effectiveness of nurses,,, pharmacists,, allied health professionals and other staff working in advanced roles in community and primary care. The new GP contract and the NHS long term plan both support this shift, and there are some early encouraging signs, but the key issue is the speed, consistency and quality of implementation across the NHS.
In our updated review we continue to flag problem areas in primary care, but also some possible improvements. One major ongoing problem is community nursing workforce shortages. The challenge of recruiting and retaining nurses in this sector is pronounced, and likely to become more difficult. This is because the older age profile of nurses in the community and primary care sectors points to a growth in retirement, while these sectors also appear less amenable to the quick fix of international recruitment. There are now fewer NHS community nurses and health visitors than there were in 2014, and fewer GP practice nurses. The Deputy Chief Nursing Officer for NHS England was quoted recently as saying that there would need to be a 20% increase in community nursing numbers over the next 10 years.
One positive note is that there has been some growth in advanced practice nurses working with GPs, which we highlight in this report. We also note that the ambitious growth target for GPs is not being met, with our latest analysis showing little change in overall GP numbers. We have argued before that staffing and skills shortages are a major block on delivering services, and therefore also a potential block on the effective implementation of the NHS long term plan. This point takes on even sharper focus when looking at the ambitions for greater service delivery in primary care, which are not currently being matched by any marked growth in the health professional component of the primary care workforce. There is a related risk that there may be an overall skill dilution in primary care, at a time when patient and resident acuity may be increasing, raising complexity of care and overall workload.
3 Reliance on international recruitment
At the time of writing the report it is unclear what the outcomes of Brexit negotiations will be, and how this will impact on the international flows of health workers to and from the UK. Even so, it is apparent in our analysis that the country falls well short of any measure of ‘self-sufficiency’ when it comes to the current significant numbers of international recruits working in the NHS. The long-term reliance on international recruitment for doctors may reduce over time given the significant increase in medical education capacity in the UK – which is now translating into more UK-trained NHS doctors, notably at consultant level. However, there is no sign of a decreasing trend in the recruitment of international nurses, with the number of nurses from non-EU countries now increasing. Our analysis for Closing the gap indicated that the UK will have to continue international recruitment activity for nurses for many years to come, even if there is an increase in domestic training (which in any case is not yet evident). Irrespective of how the government decides to take forward immigration policy, one key question will be how that policy enables or constrains inflow of health professionals from other countries. Domestic policy on the health workforce will have to take account of, and align with, immigration policy.
We also noted in the introduction to this report that the full NHS people plan is awaited. What we have set out in this year’s analysis is a range of relatively longstanding challenges that still need to be addressed fully, plus some emerging new workforce challenges. The extent to which the new plan recognises these challenges, and sets out how to address them with adequate funding, will be a key marker of its seriousness of intent.
References
-
Beech J, et al. Closing the gap: Key areas for action on the health and care workforce. Health Foundation,
The King’s Fund and Nuffield Trust; 2019 (www.health.org.uk/publications/reports/closing-the-gap). - NHS Improvement. Interim People Plan. NHS Improvement; 2019 (www.longtermplan.nhs.uk/wp-content/uploads/2019/05/Interim-NHS-People-Plan_June2019.pdf).
- Migration Advisory Committee. Full Review of the Shortage Occupation List. Migration Advisory Committee; 2019 (www.gov.uk/government/publications/full-review-of-the-shortage-occupation-list-may-2019).
-
NHS Employers. Shortage occupation list changes now implemented [webpage]. NHS Employers; 2019
(www.nhsemployers.org/news/2019/10/shortage-occupation-list-changes-now-implemented). - House of Commons Library. NHS Key Statistics: England, May 2019. House of Commons Library; 2019 (researchbriefings.parliament.uk/ResearchBriefing/Summary/CBP-7281).
- House of Commons Library. NHS staff from overseas: statistics. House of Commons Library; 2019 (researchbriefings.parliament.uk/ResearchBriefing/Summary/CBP-7783).
- NHS Pay Review Body. Thirty-Second Report 2019. NHS Pay Review Body; 2019 (assets.publishing.service.gov.uk/government/uploads/system/uploads/attachment_data/file/819464/NHSPRB_2019_Report_Web_Accessible__1_.pdf).
- Fenton W, Polzin G, Arkesden J, McCaffrey R. The size and structure of the adult social care sector and workforce in England, 2019. Skills for Care; 2019 (www.skillsforcare.org.uk/adult-social-care-workforce-data/Workforce-intelligence/documents/Size-of-the-adult-social-care-sector/Size-and-Structure-2019.pdf).
- The King’s Fund. The King’s Fund responds to the findings of the NHS staff survey [webpage]. The King’s Fund; 2019 (www.kingsfund.org.uk/press/press-releases/kings-fund-responds-findings-nhs-staff-survey).
-
Sizmur S, Raleigh V. The risks to care quality and staff wellbeing of an NHS system under pressure.
The King’s Fund and Picker Institute; 2018 (www.picker.org/wp-content/uploads/2014/12/Risks-to-care-quality-and-staff-wellbeing-VR-SS-v8-Final.pdf). -
Care Quality Commission. Growing pressures on access and staffing risk creating ‘perfect storm’ for people using mental health and learning disability services [webpage]. Care Quality Commission; 2019
(www.cqc.org.uk/news/releases/growing-pressures-access-staffing). - Care Quality Commission. The state of health care and adult social care in England 2018/19. Care Quality Commission; 2019 (www.cqc.org.uk/publications/major-report/state-care).
- NHS Digital. NHS Workforce Statistics – March 2019. NHS Digital; 2019 (digital.nhs.uk/data-and-information/publications/statistical/nhs-workforce-statistics/nhs-workforce-statistics---march-2019-provisional-statistics).
- Health Education England. Supported from the start; ready for the future; The Postgraduate Medical Foundation Programme Review. Health Education England; 2019 (www.hee.nhs.uk/sites/default/files/documents/FoundationReview%20FINAL%20for%20web.pdf).
-
NHS Employers. Assistant practitioners [webpage]. NHS Employers; 2018 (www.nhsemployers.org/
your-workforce/plan/workforce-supply/education-and-training/developing-your-support-workforce/
assistant-practitioners). -
NHS Digital. Patients registered at a GP practice. NHS Digital (https://digital.nhs.uk/data-and-information/
data-tools-and-services/data-services/general-practice-data-hub/patients-registered-at-a-gp-practice). - OECD. Nursing graduates (indicator) [webpage]. OECD; 2019 (https://doi.org/10.1787/c54611e3-en).
- Jones-Berry, S. Nursing student attrition: are we losing the battle? Nursing Standard; 2019
- Health Education England. Reducing Pre-registration Attrition and Improving Retention [webpage]. Health Education England; 2019 (www.hee.nhs.uk/our-work/reducing-pre-registration-attrition-improving-retention).
- Nursing and Midwifery Council. The NMC Register 2019. Nursing and Midwifery Council; 2019 (www.nmc.org.uk/globalassets/sitedocuments/other-publications/nmc-register-data-march-19.pdf).
-
Jones-Berry S. Nursing student attrition: are we losing the battle? Nursing Standard; 2019
(rcni.com/nursing-standard/newsroom/analysis/nursing-student-attrition-are-we-losing-battle-152466). - Dussault G, Buchan J. Noncommunicable diseases and human resources for health: a workforce fit for purpose. In: Jakab M, Farrington J, Borgermans L (eds.) Health systems respond to noncommunicable diseases: time for ambition. World Health Organization Europe; 2018 (http://www.euro.who.int/__data/assets/pdf_file/0009/380997/Book-NCD-HS.pdf).
-
Nursing and Midwifery Council. The NMC Register 2019. Nursing and Midwifery Council; 2019
(www.nmc.org.uk/globalassets/sitedocuments/other-publications/nmc-register-data-march-19.pdf). - Jones-Berry S. NMC streamlines registration process for overseas nurses and midwives. Nursing Standard; 2019. (rcni.com/nursing-standard/newsroom/news/nmc-streamlines-registration-process-overseas-nurses-and-midwives-153846).
- Dussault G, Buchan J. Noncommunicable diseases and human resources for health: a workforce fit for purpose. In: Jakab M, Farrington J, Borgermans L (eds.) Health systems respond to noncommunicable diseases: time for ambition. World Health Organization Europe; 2018 (http://www.euro.who.int/__data/assets/pdf_file/0009/380997/Book-NCD-HS.pdf).
- Swan M, Ferguson S, Chang A, et al. Quality of primary care by advanced practice nurses: a systematic review. International Journal for Quality in Health Care. 2015; 27(5), 396-404.
- Martin-Misener R, Harbman P, Donald F, et al. Cost-effectiveness of nurse practitioners in primary and specialised ambulatory care: systematic review. BMJ Open. 2015; 5(6), e007167.
- Maier C, Barnes H, Aiken L, Busse R. Descriptive, cross-country analysis of the nurse practitioner workforce in six countries: size, growth, physician substitution potential. BMJ Open. 2016; 6(9), e011901.
- Mossialos E, Courtin E, Naci H, et al. From “retailers” to health care providers: transforming the role of community pharmacists in chronic disease management. Health Policy. 2015; 119(5), 628-639.
- Barnes E, Ashraf I, Din A. New roles for clinical pharmacists in general practice. Prescriber. 2017; 28(4), 26-29.
- Sanchez A, Bully P, Martinez C, Grandes G. Effectiveness of physical activity promotion interventions in primary care: A review of reviews. Preventive Medicine. 2015; 76, S56-S67.
-
Ford M. Community workforce ‘must grow 20%’ to shift care out of hospitals. Nursing Times; 2019.
(www.nursingtimes.net/news/community-news/20-increase-community-nurses-needed-shift-care-sector-25-09-2019/).