Acknowledgements
The authors would like to gratefully acknowledge the input of those Health Foundation staff who commented on and contributed to this text in a variety of ways including Anya Gopfert, Dominique Allwood, Hugh Alderwick, Jenny Cockin, Louise Marshall, Sarah Reed and Yannish Naik.
They would also like to thank those who contributed to the case studies of Greater Manchester (Thomas Johnson, David Boulger and Jane Pilkington) and Wales (Jane Davidson).
Thanks also go to all those who attended the Green Paper Prevention workshop held at the Health Foundation in April 2019. The discussion and views shared at that workshop have been extremely helpful in shaping the thinking in this paper.
Executive summary
1. Introduction and context
The health of the population is one of any nation’s greatest assets. Good health improves people’s wellbeing, their productive capacity and their ability to participate in society. Yet a healthier population cannot be achieved by focusing solely on the treatment of illness. In fact, the strongest determinants of health are the social, economic, commercial and environmental conditions in which people live. Unless there is sufficient government attention paid to these wider determinants of health, major improvements in health and reductions in health inequalities will not be possible.
The health inequalities that exist in the UK, and the unequal living conditions that drive them, have been comprehensively studied over many decades.,, There have, at times, been effective policy initiatives to tackle them, including the introduction of the welfare state and, more recently, the health inequalities strategy implemented by the UK government between 1997 and 2010. However, the gains from these policy initiatives have not always been sustained.
Life expectancy in the UK has been stalling since 2011, and there is an 18-year gap in healthy life expectancy between the least and most socioeconomically deprived populations. Fluctuations in government priorities, a tendency towards short-term political decision-making, and challenges in addressing complex dynamic issues, all lead to insufficient attention by government on creating the conditions for a healthy life.
This suggests that a more fundamental change is needed; an approach where people’s health is valued as an asset by government and society. While all sectors have a role to play in addressing this agenda, many of the issues are structural and require government to recognise this issue more explicitly and take an active lead.
The Health Foundation, alongside others, is working to bring about this change through our Healthy Lives strategy. Building on our previous work, this report makes the case for a whole-government approach to improve the nation’s health, and identifies some of the steps required to achieve it. An effective approach needs:
- an explicit recognition of the value of good health in contributing to a more prosperous and flourishing society
- long-term thinking from government, with more focus on maintaining people’s health throughout their lives
- more joined-up policy action on the strategies that enable people to stay healthy.
With a growing number of working-age adults experiencing avoidable illness, and rising levels of multiple long-term conditions in the population (not least in mental health), now is the time for a reassessment of how the government invests in the nation’s health and wellbeing. Ambitions such as those set out in the 2017 Industrial Strategy – to ensure that people can enjoy at least five extra healthy years of life by 2035 while narrowing the gap between the richest and poorest – are welcome but require a whole-government strategy to be delivered effectively.
In England, the prevention green paper recently released by the government, Advancing our health: prevention in the 2020s, also sets out proposals designed to contribute towards that target. What is needed, however, is not a short-term policy initiative but a fundamental shift in government strategy that is long term in focus, underpinned by investment that prioritises keeping people healthy, and places the value of the UK’s health on an equal footing with measures of GDP.
2. Achieving good health for all: where are we now?
A flourishing society depends upon the whole of government taking responsibility for maintaining and improving people’s health throughout their lives. The stalling life expectancy and widening health inequalities seen in the UK today mean a major change in the action being taken to improve the nation’s health is imperative.
However, the challenge of building the UK’s health should not be underestimated. Life expectancy in England does not compare well to other similar countries, showing that there is significant room for improvement (see Section 2.1). Moreover, while there have been some advances made in public health outcomes in recent years, other indicators show worrying signs of longer term problems ahead if action is not taken soon (see Section 2.2). Against this backdrop, meeting the government’s Ageing Society Grand Challenge of giving people extra years of healthy life, will be extremely challenging (see Section 2.3). For women, healthy life expectancy actually fell slightly in recent years, while for men, it would take 75 years to complete the Grand Challenge at the current rate of improvement.
3. What is the social and economic impact of poor health?
Poor health has significant social and economic consequences for society and individuals. Evidence shows that health status has one of the largest impacts on a nation’s wellbeing (see Section 3.1). Good health also allows people to maintain social relationships and play an active role in their communities (Section 3.2). Poor health has significant economic consequences both for society and individuals, whose participation in the labour market may be limited by health problems (see Section 3.3). Consequently, poor health carries a high financial cost for the state, including the costs of treating avoidable illness and social security costs associated with poor health (Section 3.4).
4. Government, communities and business: the role of all sectors in creating health
A shift towards health creation cannot be delivered purely or even primarily by the health and care system or through focusing on individual responsibility. It requires organised efforts across all sectors, with government showing the required leadership.
Ensuring that everyone has the best possible opportunities to be healthy requires action across the whole public sector. Departments across central government have necessary and important roles to play in creating the conditions for good health and preventing avoidable ill health – whether through shaping local economies, providing services or, perhaps most importantly, through setting the tone for the national conversation (see Section 4.1). Nevertheless, many of the most important levers for creating healthy living conditions sit at local level, so place-based approaches led by local government need to be at the heart of the government’s approach to improving the nation’s health (see Section 4.2).
The public sector has an important role in investing in community infrastructure such as leisure, social care, crime prevention and housing. However, an effective approach to enhance and prolong health needs to extend well beyond the actions of the state. Strong communities are an important contributor to people’s wellbeing. Moreover, local communities are often best placed to know what is needed to improve their local environment (see Section 4.3). A whole-government approach, therefore, requires a commitment to create the structures and support that will allow local communities to participate as partners in a new approach to enhancing health and wellbeing.
While the strongest determinants of health lie outside of health and care services, the health and social care system has an important part to play (see Section 4.4). The NHS can reduce levels of poor health through its role as a direct provider of health care, as an employer, as a partner in local systems and as an anchor institution in local communities.
The private sector can play either a positive or negative role in creating health. As businesses have significant influence over the conditions in which people live and work, they can have a greatly health-enhancing influence on their employees and the communities which they are part of (see Section 4.5). Local and central government can shape the role of the private sector, both through regulation of health-harming products and by designing economies that share the benefits of economic growth.
5. Storing up problems for the future: the price of short-term approaches to government spending
A wide range of government budgets have an impact on people’s health, across social security, housing, children’s services and investment in the natural environment. A failure to take a long-term view of the value of investments that promote and maintain people’s health means that recent trends in government spending are storing up problems for the future.
At the national level, even accounting for real term increases in day-to-day departmental spending set out at the 2019 Spending Round, austerity has resulted in significant spending reductions across some areas of government that play a crucial role in creating the conditions for good health (see Section 5.1).
Moreover, current spending plans for future years appear set to tip the balance further away from investment in maintaining good health (see Section 5.2). For example, plans for NHS spending to make up an ever-greater share of government expenditure puts pressure on funding available for areas such as housing, social security and local services that are all vital for long-term health.
Analysis of local government spending (see Section 5.2) shows that, on top of large reductions in spending on areas vital for creating healthy places, there has been a dramatic shift away from proactive spending that maintains people’s life chances towards reactive, crisis management services. This is demonstrated most starkly in children’s services at local level (see Section 5.2). At national level, health spending has become increasingly skewed away from prevention, particularly through major cuts to the public health grant between 2015/16 and 2019/20 (see Section 5.3).
6. In it for the long term: What is needed to embed health across the whole of government and beyond?
Securing a future where everyone has the opportunity to enjoy the best possible health requires specific policy actions and investment in the right areas, but it also needs mechanisms that embed health and health equalities as a shared value across government and beyond. This requires government to show the necessary political will and leadership, to harness the full potential of opportunities in existing legislation, and to put in place structures that can counteract tendencies towards short-term decision-making and focus on a narrow range of issues. This will require government to:
- Change the way success is measured. Good health should be considered a primary measure of successful government. There are already examples of such approaches within the UK and internationally – most notably, New Zealand’s efforts to put non-GDP measures of wellbeing at the heart of government decision-making. This case provides an example of how using broader measures of success can create the right incentives for a shift towards long-term investment approaches within government (see Section 6.1).
- Embed long-term health considerations in legislation and policy across the whole of government. Mechanisms could include development of legislation such as the Well-being of Future Generations Act for Wales and the use of independent bodies to scrutinise and advise on health, in the way the Children’s Commissioner does for England (see Section 6.2).
- Prioritise investment in people’s health as one of the nation’s greatest assets. This will involve rebalancing investment towards health-creating areas of spending such as children’s services, housing and social security (see Section 6.3). Investment should begin with reversing cuts to the public health grant and making a commitment to maintain its value as a proportion of total health spending. In the longer term, finding ways to measure and monitor the balance between preventative versus reactive spending across government will be important to aid rational, long-term decision-making.
- Enable the NHS to play a stronger role in prevention (see Section 6.4), particularly as the integration of health and social care is set to progress rapidly in the coming years.
- Ensure that national policy enables coordinated, place-based approaches to improving health that involve communities and local government. Local government can provide leadership with other public-sector bodies but creating healthy social, economic, environmental and commercial conditions will only be possible with full involvement and participation of local communities in decision-making and action (see Section 6.5).
It will take bold political decisions at national government level and commitment over the long term to create the conditions for good health. There’s an opportunity now to set the direction for a healthier, more prosperous future.
1. Introduction and context
This report has been developed as part of the Health Foundation’s long-term strategy to improve people’s health in the UK. It sits within a broader Healthy Lives programme of work aimed at focusing policy attention on the wider determinants of health, building evidence on the social and economic value of health and supporting action to address health inequalities.
Securing a healthier population over the long term requires a different conversation; one that focuses on people’s health as one of the nation’s greatest assets, rather than a preoccupation with the burden that arises from ill health.
The issues explored in this report are not new. Over several decades, independent reviews have been undertaken for the UK government that have drawn attention to widening health inequalities and called for urgent action. This includes the ‘Black Report’ on inequalities in health published in 1980,1 Sir Donald Acheson’s 1998 Independent Inquiry into Inequalities in Health, and Sir Michael Marmot’s strategic review of health inequalities in England, which concluded with the Fair Society, Healthy Lives report published in 2010.
There have also been notable previous attempts to implement health-creating policy change in England. Between 1997 and 2010, for example, there was a strategic government focus on tackling the underlying determinants of health and increasing social investment for the most deprived areas of the country. There is evidence that this approach led to a decline in geographical inequalities in life expectancy. But, such progress has been short-lived. Not enough has yet been done to create the foundations for a more sustainable framework for action – one in which people’s health is at the heart of every part of government as a shared value. The analysis presented in this report shows that recent trends in government spending, rather than investing in people’s future health, are instead storing up more problems.
This report argues for both investment in people’s health over the longer term and new mechanisms to embed a whole-government approach to creating good health. Action needs to be taken across the factors that have the strongest influence on people’s health, such as transport, education, social security, children’s services, housing and work. The seeds of a longer term and more holistic approach to health creation are already being sown across other nations of the UK, with opportunities to learn from the recent steps taken to create an enabling policy context in both Wales and Scotland. There is also much to learn from further afield, with New Zealand leading the way on embedding wellbeing at the heart of government. The consultation around the prevention green paper recently released by the government, Advancing our health: prevention in the 2020s, could provide an opportunity for progress, but only if supported by more fundamental change across wider government.
Social, economic, commercial and environmental conditions are the strongest determinants of people’s health. This includes people’s access to homes that are safe, stable and warm; the quality of their work; the availability of an adequate financial safety net; and a healthy, affordable food environment. There is abundant evidence that when the right conditions are in place, people lead long, healthy and productive lives.
Individual behaviour is part of the causal chain that links the wider determinants of health to avoidable illness, but there is strong evidence that people’s behaviour is highly constrained by their social, economic, commercial and environmental circumstances. For example, while good diet is a key driver of good health, approaches to changing what people eat that focus solely or primarily on influencing individual choices have been found to be extremely limited in their impact. There is good evidence that healthier diets are more expensive and that meeting basic nutritional guidelines is unaffordable for many families in the UK, who may face other barriers such as lack of access to healthy foods.
Moreover, there is abundant evidence that inequalities in health between different social groups are driven primarily by the conditions in which they live.,, Reducing major inequalities in health requires improvements in the wider determinants of health, particularly for people living in the most deprived communities. However, current trends in a number of areas suggest that conditions may be getting worse for many people rather than better, making the need for a whole-government approach to health improvement even more pressing.
Creating healthier lives in the UK therefore requires a significant reframing of how people understand what shapes their health. There needs to be a shift away from the individualistic ways of thinking that too often dominate discussion. As identified by recent Health Foundation analysis with the FrameWorks Institute, despite extensive evidence for the impact of wider determinants on people’s health, public discourse and policy action is currently limited in acknowledging the role that societal factors such as housing, education, welfare and work play in shaping people’s long-term health.
While bold political decisions will need to be driven forward at national government level to create the conditions that lead to good health, sustainable change will not take root without communities also participating in the agenda. The engagement undertaken as part of the Health Foundation’s Young People’s Future Health inquiry provides one example of how policy development can begin by developing an understanding of the concerns of people with lived experience.
This report begins by outlining the scale of the challenge the nation faces to improve health and reduce health inequalities, including an assessment of how England fares compared to other countries (see Section 2). It goes on to demonstrate the social and economic impact that poor health is having, as well as the potential for far-reaching benefits from improving health (see Section 3). Every sector in society has a role to play in improving health – Section 4 outlines the contributions needed from central government, local government, communities, the health and social care system, and the private sector. Section 5 examines recent trends in government investment, showing the tendency for short-term priorities to skew spending away from long-term investments in health towards reactive services. Finally, Section 6 considers the implications for policy, outlining a range of ways in which health can be embedded as a shared value across the whole of government and beyond.
2. Achieving good health for all: where are we now?
Key points
- Since 2010/11, there has been an unprecedented reversal of life expectancy in some groups, indicating that continuing improvements in health cannot be taken for granted.
- People born in the most deprived 10% of local areas are expected to live over 18 fewer years in good health than those born in the least deprived 10% of local areas.
- Internationally, the UK ranks 22 out of 38 OECD countries for life expectancy.
- There is a shift in the pattern of ill health towards multiple health conditions. In 2006/07, one in ten patients admitted to hospital as an emergency had over five conditions. In 2015/16, the figure was one in three.
2.1 Closing the gap in health inequalities
Life expectancy improvements have slowed
In the post-war period, the UK saw life expectancy increase by an average of about one year over every five years (a 12.5-year increase over 60 years since 1950) but this has slowed dramatically in recent years. In Wales and Scotland, life expectancy has started to decline. Across the UK as a whole, life expectancy trends vary by a person’s level of deprivation and sex, with certain regions and groups particularly badly affected.
A recent Public Health England review of trends in mortality in England found that, rather than being attributable to any single cause, the slowdown in improvement is likely to be the result of a number of factors operating simultaneously across a wide range of age groups, geographies and causes of death.
The Health Foundation has commissioned analysis to provide a more detailed understanding of the causes of the recent stalling of improvements in mortality and life expectancy in the UK. This work will present a more detailed picture of what is happening to mortality and life expectancy patterns across different population subgroups, and the multiple complex drivers at play. Figure 1 shows that, since 2011/13, female life expectancy at birth in England has started to decline for girls born in the most deprived 10% of local areas, while it has continued to improve for those born in the least deprived 10%. Life expectancy improvements for boys born in the most deprived 10% of local areas also appear to have been outstripped by boys born in the least deprived 10% over the same period. This reversal of life expectancy in some groups is unprecedented in modern times and indicates that continuing improvements in health cannot be taken for granted.
Figure 1: Life expectancy trends by local area deprivation and sex, England, 2011–13 to 2015–17
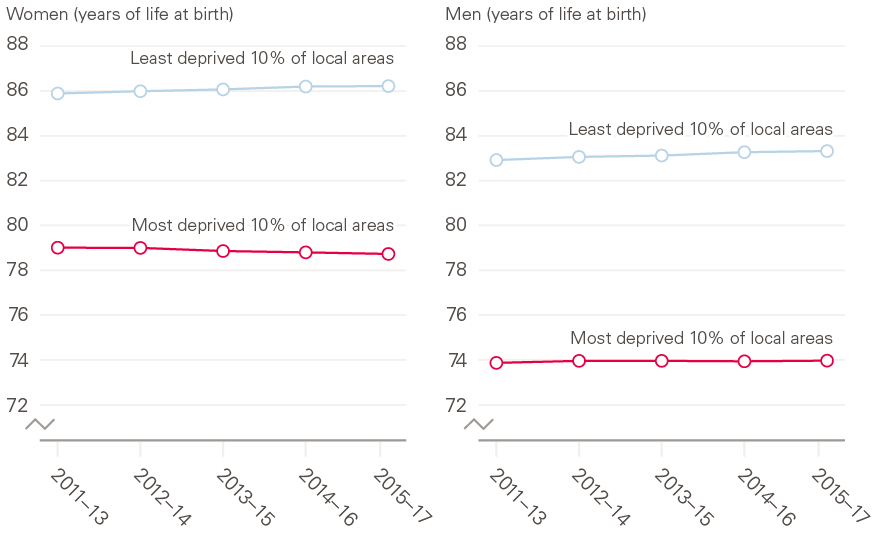
Source: ONS, Health State Life Expectancies by deprivation decile, England, 2011–13 to 2015–17.
Inequalities in healthy life expectancy are widening
In addition to the inequality in life expectancy across local areas, there are far greater inequalities in healthy life expectancy (the number of years lived in self-assessed good health). People born in the most deprived 10% of local areas are expected to live over 18 fewer years in good health than those born in the least deprived 10% of local areas. The data for women are shown in Figure 2.
This means that not only can those born in more deprived areas expect a shorter overall life span, they can also expect a greater share of their life to be spent in poor health and a longer absolute number of years in poor health. For example, women living in the most deprived 10% of areas have a healthy life expectancy of just 52, but a life expectancy of 78.7, meaning they can expect to have nearly 27 years of poor health towards the end of their lives.
This difference in healthy life expectancy shows the scope for improvement in health across the population and the additional healthy life years that could be gained. However, in the context of current trends, improving these measures of health will be tough. For example, healthy life expectancy at birth for males in England increased by only 0.4 years between 2009–11 and 2015–17. If that rate of improvement continued to 2035, healthy life expectancy would have risen by only a further 1.1 years. Therefore, for men, it would take 75 years to complete the stated aim of the government’s Ageing Society Grand Challenge (as set out in the Industrial Strategy) to ‘ensure that people can enjoy at least five extra healthy, independent years of life by 2035, while narrowing the gap between the experience of the richest and poorest’. For women, where healthy life expectancy has slightly fallen in the last six years, there is an even greater challenge in meeting this goal.
Figure 2: The wide inequality in healthy life expectancy at birth by decile of deprivation, England, 2015–17, women (years of life)
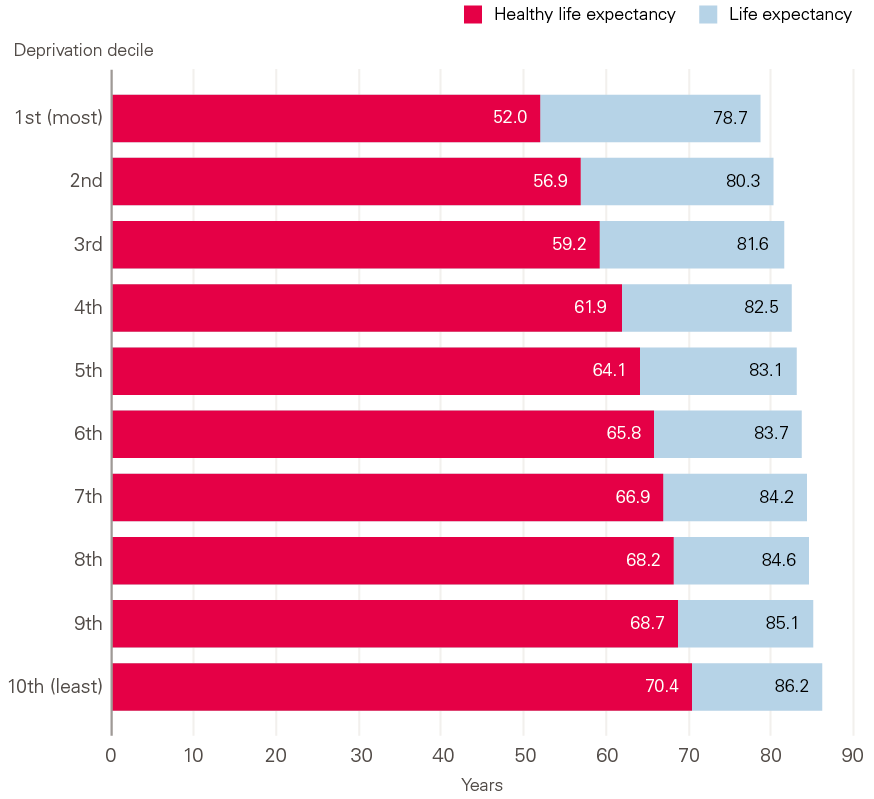
Source: ONS, Health State Life Expectancies by deprivation decile, England, 2015–17.
International comparisons
Comparing the UK to other countries provides some indication of the potential scope for improvement. Internationally, the UK ranks 22 out of 38 OECD countries for life expectancy; Japan is the leader at 84.1 years compared to 81.2 for the UK.
The UK also has one of the biggest health gaps between the most and least deprived people compared to many other developed countries across the world. As shown in Figure 3, the share of the UK population in good health is 24% lower in the lowest income bracket than in the highest. In contrast, within the top-performing countries such as New Zealand, Greece and France, there is a gap of only 5–10% between the lowest and highest socioeconomic groups. Together, this highlights the significant room for improvement in outcomes in the UK in both an absolute sense and from the perspective of inequality.
Figure 3: International comparisons of inequalities in good health, difference in share of population aged over 15 reporting good health between income quintiles 1 and 5
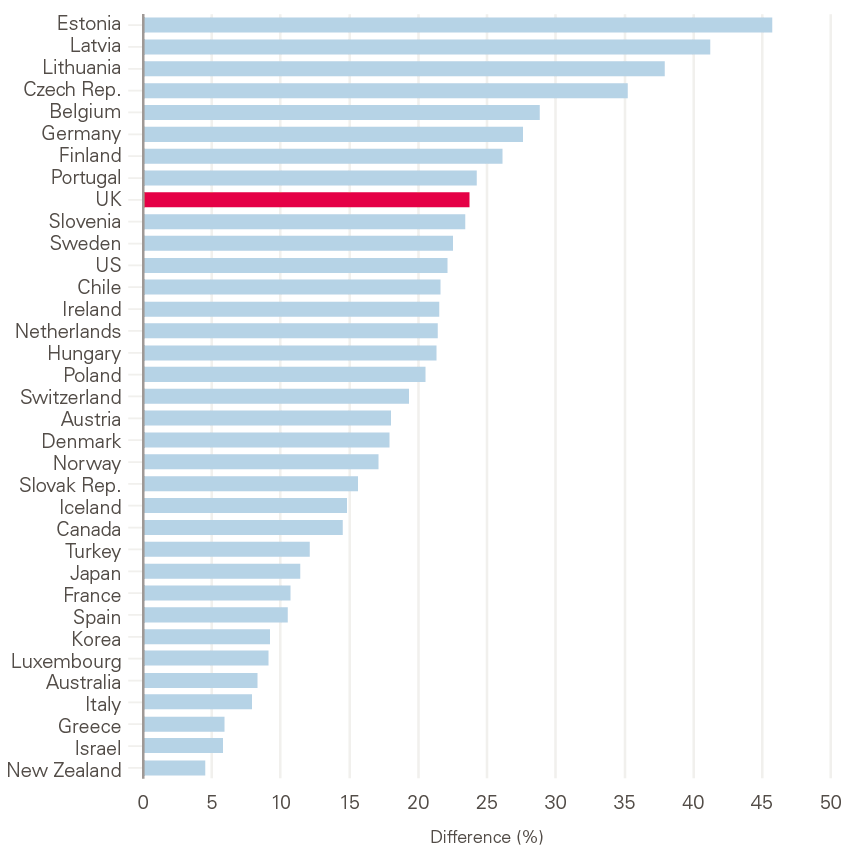
Notes: Life expectancy shown is estimated on a ‘period’ measure for 2016, apart from France, Canada and Chile (all 2015). Health measure is reported in 2016, apart from New Zealand (2014) and Chile (2015).
Source: Health Foundation analysis using OECD.Stat, extracted November 2018.
Local comparisons
There are large differences in health, not only between areas with different deprivation levels, but also between areas with similar levels of deprivation.
Closing the inequalities gap will improve individual outcomes as well as the national position. Such a large change may feel extremely challenging. However, looking at variation within deciles shows that some areas with high levels of deprivation are already performing well. Figure 4 shows that, even within the most deprived deciles, there is a considerable variation in health. For instance, if health outcomes across the most deprived half of the population matched those in the middle of the distribution, there would be an average 3-year improvement in healthy life expectancy across the whole birth cohort.
Figure 4: Healthy life expectancy (years) for females in England by deprivation decile, for each local authority, 2015–17
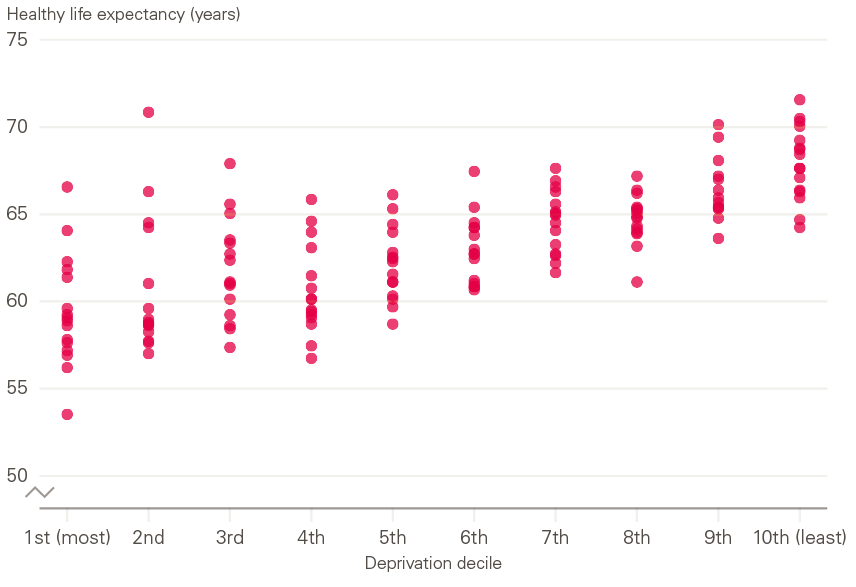
Notes: Isles of Scilly and City of London excluded due to insufficient mortality data for ONS to calculate HLE.
Source: Health Foundation analysis of health state life expectancy at birth and at age 65 by local areas, UK, 2018.
Understanding the causes and drivers of the wide variations that exist in healthy life expectancy within areas of similarly ranked deprivation would provide useful insights into how to improve health outcomes. This will be the focus of future work at the Health Foundation.
2.2 Trends in key public health outcomes
Trends in more specific measures of public health outcomes provide important indications of where a major shift towards a preventative approach is needed most (trends in specific disease outcomes have been set out in the 2018 Global Burden of Disease study).
In considering the challenges facing government, attention needs to be paid to:
- the growing needs of people with multiple health conditions
- key prevention service indicators
- risk factors for poor health.
Addressing the trends in these different types of health outcomes will require action at different levels (from individual to societal) and strategies that operate on different time horizons (from short to long term).
The growing needs of people with multiple health conditions
There is a shift in the pattern of ill health towards multiple health conditions. In 2006/07, one in ten patients admitted to hospital as an emergency had over five conditions.
In 2015/16, the figure was one in three. Meeting the growing needs of people with multiple health conditions is also a particular challenge in the most disadvantaged areas. Recent research undertaken by the Health Foundation found that, in the least deprived fifth of areas, people can expect to have more than two conditions by the time they are 71 years old, yet in the most deprived fifth, people reach the same level of illness a decade earlier, at 61 years of age.
As the number of people with multiple health conditions grows, the NHS will need to implement more effective secondary and tertiary prevention strategies that prevent disease progression and the harm done by long-term conditions. For example, there are still significant improvements to be made in areas such as cancer diagnosis. While there is a positive trend towards improvements in cancer survival rates overall, many cancers are still diagnosed at a late stage, with almost half of all lung cancers diagnosed at the most advanced stage.
Trends in prevention service indicators
While some prevention services have shown improvements in outcomes in recent years, there are worrying signs in others.
Figure 5: Indexed changes in alcohol-specific deaths and drug misuse deaths per 100,000 since 2001
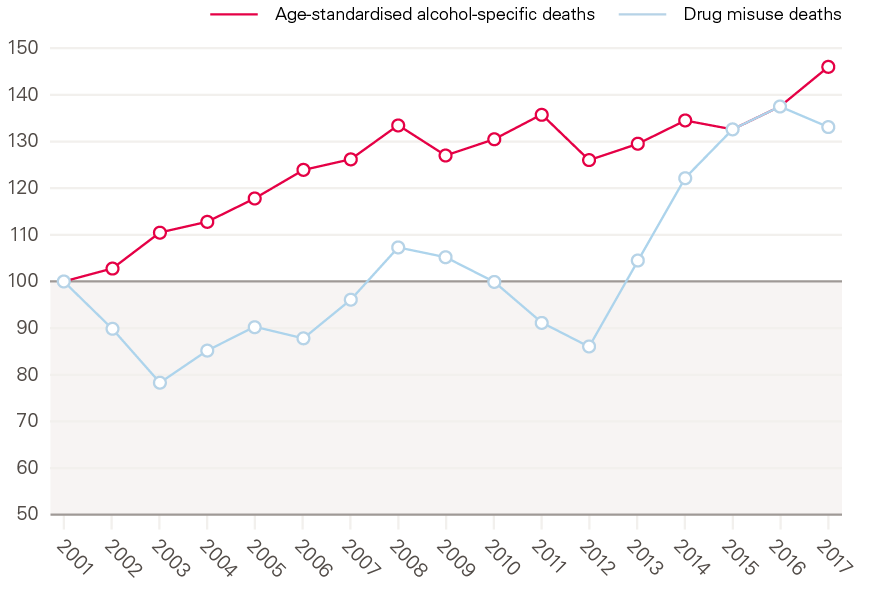
Source: ONS, Drug-related deaths by local authority, England and Wales, 2018; Alcohol-specific deaths in the UK, 2018.
Despite drug misuse death and alcohol-specific deaths rates having increased over the last five years as shown by Figure 5, the number of people receiving treatment for drug and alcohol misuse is down 11% since the high point in 2013/14. The success rate of treatment has also been falling: it is now five percentage points lower than it was in 2013/14.
Other areas of concern identified by analysis from QualityWatch were:
- The proportion of pregnant women who smoked at delivery fell 5% in the decade to 2016/17 but has plateaued since.
- After large improvements in the early 2000s, the proportion of HIV cases diagnosed at a late stage of infection, when significant health damage may already have occurred and the infection may have been transmitted to others, increased by 3% between 2015 and 2017.
- Coverage for all childhood vaccines has declined since 2013/14, and all but one are below the World Health Organization’s 95% coverage target.
Trends in risk factors for ill health
The decline in the prevalence of smoking in recent years has been a major success in the fields of public health and prevention. However, levels of obesity remain stubbornly high. This has implications for people’s overall wellbeing and long-term health and will have significant implications for future health and health service use. Obesity remains one of the country’s greatest public health challenges, with 29% of adults obese in 2017, up from 18% in 1997. In children, 20% were obese at age 10–11 in 2017/18, an increase of 1.7 percentage points compared with 10 years previously. More worrying still is that growth in child obesity has been driven by increasing rates of obesity among the most deprived 10% of children, as shown in Figure 6.
Figure 6: Prevalence of obesity (including severe obesity) in year 6 children in England in most and least deprived deciles, index of multiple deprivation 2015 on County/Upper Authority level
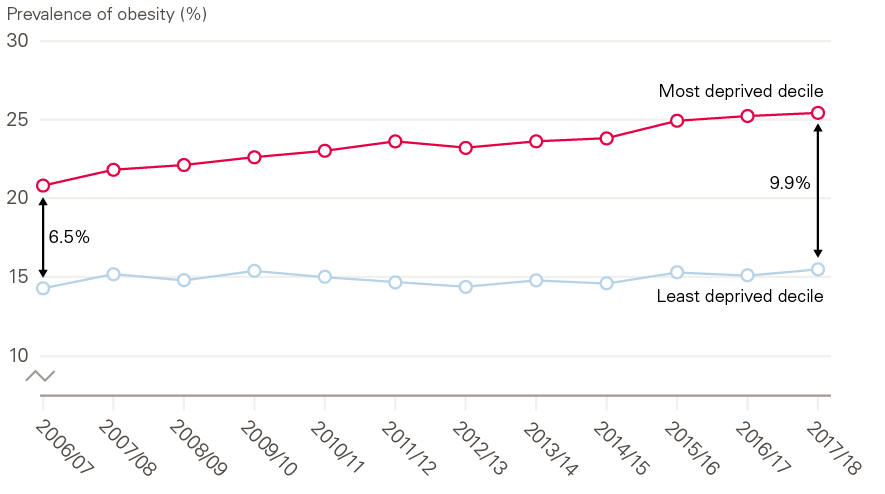
Source: NHS Digital, National Child Measurement Programme.
Loneliness is increasingly recognised as a risk factor for poor health. Although loneliness can be experienced at any age, it is particularly common in older people. While the proportion of people aged over 50 in England who say they are often lonely has remained similar over the last 10 years, population ageing means that the numbers experiencing it are increasing. If current trends continue, it is estimated that 2 million people aged over 50 will feel lonely by 2026, up from 1.4 million in 2016. This has major implications for health service use. Health Foundation analysis has found that people aged 65 and older who live alone are 50% more likely to go to A&E than those who live with someone else. They are also at increased risk of being admitted to hospital as an inpatient.
Young people’s mental health is another area of concern, with the latest data showing that 11.2% of 5- to 15-year olds report having at least one mental health disorder in 2017, up from 9.7% in 1999. This rise has been driven by increased rates of emotional disorders, particularly anxiety and depression. Emotional disorders are particularly common in teenagers, with 14.9% of 11- to 16-year olds affected.
One of the most fundamental drivers of good health is having an adequate income. An area of particular concern is the number of children experiencing poverty. Projections discussed in Section 5 (Figure 10) indicate that child poverty could rise from 30% in 2017/18 to a record high of 35% in 2023/24. Much of this is likely to be within working households. The child poverty rate for working households averaged 20% between 1996/97 and 2013/14, but is projected to increase to 29% by 2023/24. All of this suggests that, without policy action, a growing number of children will experience health-damaging poverty.
2.3 Creating the conditions for good health across the life course
Improving the length of time people live in good health has rightly been the focus of much recent policy debate. In 2018, for example, the government set out a mission, as part of the Ageing Society Grand Challenge in the Industrial Strategy to, ‘ensure that people can enjoy at least five extra healthy, independent years of life by 2035, while narrowing the gap between the experience of the richest and poorest’.
Recent trends show how big a challenge this will be. Healthy life expectancy at birth for males in England increased by only 0.4 years between 2009–11 and 2015–17. If that rate of improvement continued to 2035, healthy life expectancy would have risen by only a further 1.1 years, meaning it would take 75 years for the mission to be completed. For women, healthy life expectancy has actually slightly fallen in the last six years.
In aiming to improve health, it is important to consider that health-state life expectancies, which are effectively averages across the life course, tend to be discussed as though years spent in poor health always occur at older ages. However, that is not necessarily the case. Periods of poor health can occur at any age, including in the working age population, particularly for those living in the most deprived areas.
Figure 7 shows how the share of the population reporting good health deteriorates as people age. It also highlights that improving health means taking action over the life course through strategies that improve the living conditions experienced by all age groups. Only 50% of people living in the most deprived 10% of local areas in England report good health by age 55–59, compared to the same proportion reporting poor health a whole 20 years later at ages 75–79 for those from the 10% least deprived of local areas.
Figure 7: Population reporting good health by age for males in most and least deprived areas in England
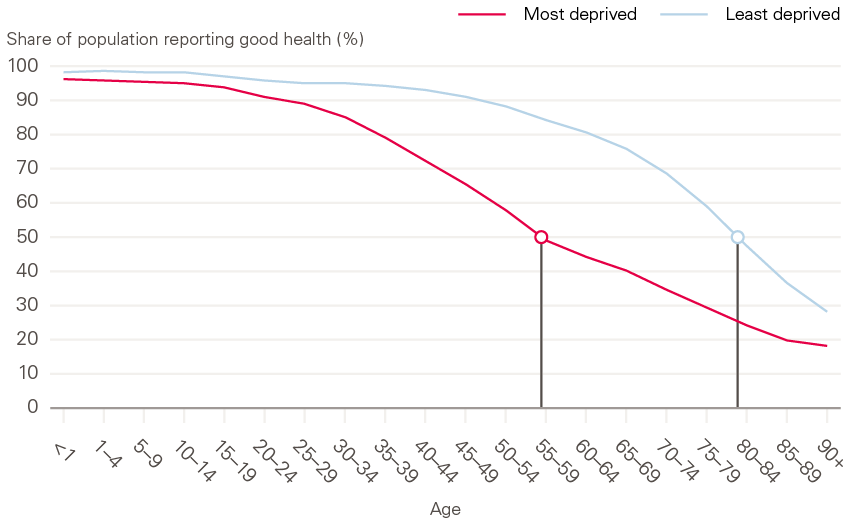
Source: ONS, 2011 Census – sex by age by general health – 2011 deciles IMD2010 from LSOAs in England.
Making improvements in health across the life course also raises difficult measurement issues. There are currently several different measures for understanding how long people stay healthy. Disability-free life expectancy (DFLE), which will be used to measure progress towards the target contained in the Industrial Strategy, is based on a narrower definition of people reporting whether they have a disability or limiting illness than the alternative, healthy life expectancy (HLE), which is based on people reporting on the wider definition of whether they are in good health.
Both tell similar stories about years of health and inequalities, but HLE can capture a broader picture of health. The DFLE metric could lead to policies becoming more focused on the deterioration of health at older ages and extending workforce participation, rather than looking at strategies to enable people to stay healthy across the life course.
* The period for which data with consistent definitions is available.
3. What is the social and economic impact of poor health?
Key points
- Poor health has significant social and economic consequences for society and individuals.
- Health is one of the strongest contributors to people’s wellbeing and poor health can limit people’s participation in communities.
- People with a long-term health condition have an economic activity rate of 68% –a fifth lower than for those without a long-term health condition.
- The Community Life Survey (2017/18) found that disabled people or those with long-term limiting illness were less likely to have someone to socialise with or feel they belong to their neighbourhood.
- Poor health results in high costs to a range of public services, estimated at £200bn or 7% of GDP in 2016/17. These costs have risen considerably in recent years.
3.1 Impact of health on wellbeing
The health of its population is one of any nation’s greatest assets. Good health improves people’s wellbeing, their productive capacity and their ability to participate in society. As such, it is an important contributor to a successful economy and a thriving society.
However, a study by Newton et al estimated that around 40% of health care provision in the UK is used to manage conditions that are potentially preventable. This is a lost opportunity for individuals and society.
Repeated studies have found that people’s health status affects their subjective wellbeing. Indeed, comparisons across countries show that health status has one of the largest impacts on a nation’s wellbeing. In the UK, people with ‘good’ self-rated health are more likely to be satisfied with life, less likely to be anxious, and more likely to be happy and feel that life is worthwhile.
3.2 Impact of health on communities and society
Good physical and mental health allows people to play an active role in society and their local communities. For example, the Community Life Survey (2017/18) found that disabled people or those with long-term limiting illness were less likely to have someone to socialise with or feel they belong to their neighbourhood. The same survey found that 13% of disabled people or those living with long-term illness often or always felt lonely, compared to 3% of people living in good health. A number of studies have also highlighted the often profound effects of living with multiple health conditions, finding that people living with multiple health conditions have poorer quality of life, difficulty with everyday activities and often experience isolation as a result of reduced mobility.,,
There is some evidence, too, that inequality can damage communities. For example, income inequality, which is closely linked to health inequality, is linked to higher rates of crime and lower social cohesion. It is important to recognise that these inequalities do not simply arise from different levels of education or employment, other barriers (such as discrimination) can limit people’s ability to access good employment and housing.
3.3 Economic impacts of poor health on workforce supply and productivity
Poor health has significant economic consequences for both society and individuals. For individuals, poor health can mean they are unable to participate in the labour market altogether, or it can limit the amount or nature of the work they do.
Figure 8 highlights the scale of the gap in economic activity between those who report a long-term health condition and those who do not, by age. In 2018, 31% of the working age population (aged 16–64) report that they have a long-term health condition. People with a long-term health condition have an economic activity rate of 68% – a fifth lower than for those without such a condition. As might be expected, it is a gap that gets wider with age, increasing from 5% for those aged 16–24 to 20% for those aged 55–64.
Figure 8: Employment rates for people with and without a long-term health condition, by age group, UK, 2019
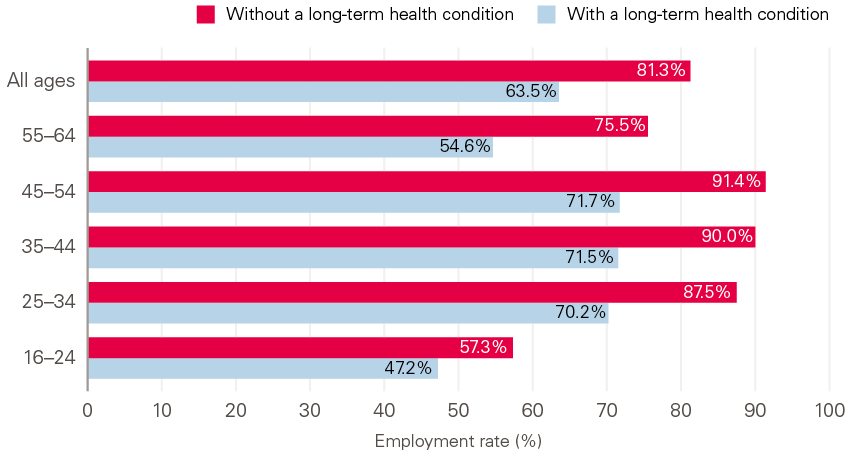
Source: ONS, Quarterly Labour Force Survey (LFS), 2019 (quarter 1).
Poor health can affect an individual’s productivity through missed days of work or reduced performance. Analysis by the Health and Safety Executive shows that there were 26.8 million working days lost to work-related ill health in 2017/18. Although this was, on average, just under one day lost per worker across the entire population, this was not evenly distributed; those who were absent for health-related reasons were, on average, likely to miss 16.5 working days. Stress, anxiety and depression accounted for 15.4 million lost working days, with those affected missing an average of 25.8 days of work. A large proportion of the illnesses causing a loss of working days are likely to be avoidable.
‘Presenteeism’ – turning up to work when unwell – can also reduce productivity at work or lead to lower quality of work because people spend less time on tasks compared to those who are well. The European Working Conditions Survey 2015 found that 59% of workers in the UK reported working when sick at some point in 2015.
Poor health can also compound economic difficulties for the individual. For example, people who have excellent health have been shown to earn 4–7% more than those with average health after controlling for other characteristics, while people experiencing health shocks (measured by large declines in an index of different health measures) have been found to be more likely to enter retirement at younger ages.
Differences in employment because of people’s health status have consequences for individual incomes. For example, analysis from the Institute for Fiscal Studies has shown that those of working age in poor health are 50% more likely than healthy individuals to experience income poverty. Health status also has important implications at an aggregate level for the national tax base and economic dependency ratios (the number of non-working people for each person in paid employment). A population that is supported to remain fit, healthy and working for longer can both increase tax revenues through a larger, more productive workforce and can reduce the costs of supporting an ageing society.
Figure 9: Mortality rate by age and Townsend deprivation quintile, men
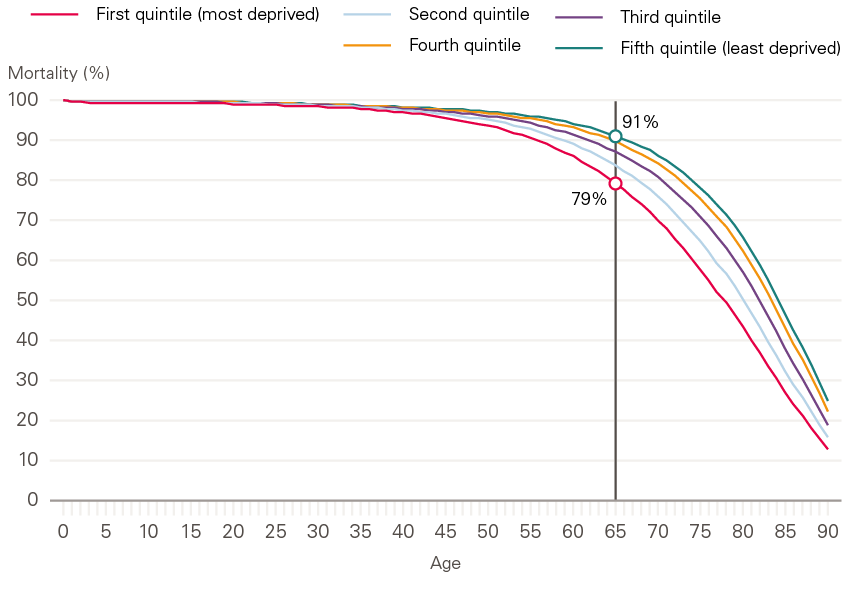
Source: Health Foundation analysis using ONS, mortality rates by deprivation decile.
Health inequalities are not simply an injustice for the individuals affected but are also a lost opportunity for the national economy. Less productive local areas of the economy are related to areas with poorer health. The causal links between low productivity and health in local areas are complex and poorly understood at present. A previous Health Foundation publication – The nation’s health as an asset – outlined a programme of research that is currently underway at six research institutes across the UK to try to improve understanding of these issues. However, a population’s health is an important determinant of potential labour supply. As Figure 9 shows, by 65 years of age, 21% of men from the most deprived fifth of areas in England and Wales will have died: more than twice as many as men from the least deprived fifth (9%).
3.4 The cost of poor health to the public sector
Avoidable poor health carries a high financial cost for the state, manifesting across several different areas of government spending, including the costs of treating illness in the NHS, the costs of supporting people whose poor health means they need assistance from the social care system, and the costs to the social security system through a range of benefits. In analysis for the Chief Medical Officer’s annual report, the Institute for Fiscal Studies estimates the total cost of all of these at around £200bn or 7% of GDP in 2016/17. Moreover, the costs across these different areas of spending have been rising both in absolute terms and as a proportion of GDP. As recently as 2001, the cost was lower at about 5% of GDP, or £80bn in 2016/17 prices.
While not all these costs can be avoided, poor levels of health in a population have major economic and social impacts. Comparisons between areas with better and worse health give some indication of the scale of that impact. For example, there is greater entitlement to Employment Support Allowance (ESA), an ill health income-replacement benefit, in the most deprived 10% of areas – with 7.7% of the working age population in England in 2018 in those areas in receipt, compared to 3.3% of those in the least deprived areas.
4. Government, communities and business: the role of all sectors in creating health
Key points
- Giving people the best possible chance to lead a healthy life requires organised efforts across all sectors, including central and local government, the health and social care system, the voluntary sector, communities and the private sector.
- Central government has a responsibility to set a tone that prioritises the population’s health as a core measure of success and uses its levers of taxation, regulation, spending and information provision to this end.
- The power of place in influencing people’s health outcomes indicates that a comprehensive and integrated place-based approach, underpinned by national investment needs, is central to improving people’s wellbeing and health.
- In addition to the services that local government directly delivers or funds, it has an important role as a convener and leader in local areas.
- An effective whole-government approach to health creation requires a commitment to invest in policies that build and strengthen local communities and enable those communities to fully participate in shaping their local areas and the services they receive.
4.1 The role of central government
Creating healthy social, economic, commercial and environmental conditions for people’s lives is a responsibility shared across all levels of government. Key determinants of health include housing, education, transportation, work, the environment and the quality of a person’s physical surroundings.
Taken together, it is clear that many parts of central government have a role to play across the spectrum of activity to maintain and improve health. Many factors are also the responsibility of more than one government department. For example, poverty has long been recognised as cutting across several policy domains and is itself a common factor underlying many of the conditions that result in avoidable illness.
Often policy success stems from a combination of policy levers and joint cross-government action to achieve a shared aim (see Case Study 1 on smoking legislation for an example). There are four main channels of government influence, which in the UK tend to be delivered from the centre, and to a lesser, but increasing, degree through forms of local government:
- Taxation: Taxes are well known to affect the behaviour of companies and individuals through their effect on the prices of the goods and services they are levied on. Some taxes are designed specifically to reduce consumption (such as the high rate of tax imposed on tobacco products or, more recently, the soft drinks industry levy). Evidence suggests that taxing unhealthy foods, tobacco and alcohol can be beneficial to health and health equity.
- Regulation: The control of particular goods, services or activities have proved to be highly effective for tackling public health issues, especially on a national scale. The 2007 smoking ban exemplifies the large health impact such legislation can have (see Case Study 1) but this also includes road safety measures, work standards, and gambling and alcohol licensing.
- Spending: This can take two main forms, the first being direct transfers to redistribute income, which from a health perspective can be important in alleviating poverty and reducing inequality. Second, directly funded service provision or investment in infrastructure can play a redistributive role, such as the provision of universal education. The balance of spending between proactive, health-creating services and reactive services is an important lever explored in detail in Section 4.
- Information: The provision of information can help people, businesses and other institutions to make more informed choices about the types of activities they engage in, or the goods they consume. However, it is important to understand the constrained choices people can be faced with when seeking to influence their behaviours.
An effective strategy to maintain and improve people’s health will need to maximise the use of all four of these levers in a concerted fashion. However, over and above the technical levels of government, it is the tone it sets for the national discourse that is important.
This will require governments to frame their measures of success in terms of investing in the long-term health outcomes of the population and reducing health inequalities, and will also require them to put in place coherent policy frameworks that span central and local government, communities, business and voluntary sectors. Potential approaches are discussed further in Section 5. Other practical attempts to improve health and health equity through cross-sector action are also explored in the Health Foundation’s case study collection, Implementing health in all policies: lessons from around the world.
Case Study 1: Legislating to reduce smoking
For decades, smoking has been the leading cause of death and illness in the UK and the biggest contributor to the gap in life expectancy between the richest and poorest parts of society
Since the 1960s, successive tobacco control measures have been introduced nationally including taxation, advertising bans and consumer protection policies. As a result, over the past four decades, the share of adults who smoke has fallen from 39% to 15%.,
Primary legislation is one of the most powerful levers government has for creating health-promoting conditions. On 1 July 2007, smoking was banned inside public places in England under the 2006 Health Act. The government’s aim was to protect people from secondhand smoke and reduce smoking-related harm, and they had the public’s support for a legislative approach.
The ban’s effects were immediately apparent. Within a year the number of people giving up smoking increased and hospital admissions for heart attacks fell by 2.4%; 1,900 fewer adults were admitted to hospital for asthma each year for three years following the ban.
The legislation made an important impact on smoking in the UK. The evidence of its success has also supported other countries considering smoke-free laws and has furthered understanding of how smoking and other health risks can be tackled globally.
4.2 The role of place-based approaches led by local government
While place may not be an absolute determinant of outcomes, it profoundly shapes experience, expectation and opportunity, and has implications for long-term health and wellbeing. The extent to which people have access to the spaces, services and social networks they need to lead healthy lives varies considerably across the UK. The power of place in influencing people’s health outcomes indicates that a comprehensive and integrated place-based approach, underpinned by national investment – particularly for those areas experiencing the greatest deprivation – needs to be adopted as a core component of any strategy to improve people’s wellbeing and health.
Alongside the development of an enabling national context that regulates and invests to lay the foundations for good health across the country, local authorities have a pivotal role to play in creating health in their communities. They have responsibility to deliver many of the local services that support good health and the devolution agenda means that there is increasing opportunity for locally determined policy. For example, local authorities can do the following:
- Deliver early years services that bring long-term benefits for children through creating healthy educational and social environments at crucial points in their lives. By supporting a child’s early physical, social and cognitive development, these services in turn influence their school-readiness, educational attainment, economic participation and adult health.
- Design transport systems that are accessible, affordable and support those least able to travel. This also has the potential to transform a place and enable healthier lives, opening up access to jobs, markets and goods, social interaction, education and a range of other services.
- Provide public services such as libraries, which can create a wide range of health-promoting conditions, such as encouraging reading and literacy, supporting local businesses and providing spaces for people to meet and socialise. Research suggests that people who use libraries frequently report better wellbeing and visit the GP less.
- Provide financial support for services such as Citizens Advice that help resolve benefits, debt and housing problems, as well as offering information and advice on health issues. Citizens Advice estimates that, for every £1 invested in the service in 2018, it saved the government and public services £1.88 and generated over £11 in public value.
- Through their economic development role, create inclusive economies, that work for everyone. Places can do this by using data to understand the ways in which local economies influence health and health inequalities in their local population (for example, by developing interventions that address health-related barriers to employment, and by working to ensure that the jobs being created locally are beneficial to health). As Case Study 2 illustrates, large organisations can act as anchor institutions – using their procurement, employment and estates to deliver added benefit to their local community and economy in line with the Social Value Act 2012.
In addition to the services that it directly delivers or funds, local government has an important role to play as a convener and leader in local areas. Local government can promote health through working differently with local businesses and voluntary, community and social enterprise organisations. For example, civic leaders can encourage businesses with a strong record on workforce wellbeing and procure services from local organisations that benefit the community. A key part of the role of local authorities, therefore, is creating the conditions in which other sectors can flourish and make a positive contribution to health.
The current focus on rolling out social prescribing schemes that enable workers to connect with local groups and support services – as advocated within The NHS Long Term Plan and referenced within the Prevention is better than cure vision – should also be viewed within this context. While social prescribing services may have an important preventative role to play, such schemes will not be sufficient on their own to ensure action across the wider determinants of health and must be underpinned by wider place-based approaches led by local government. Indeed, many social prescribing services provided by the voluntary sector are directly supported by local government, with cuts to local authority budgets likely to have a harmful impact on their ability to support and empower local communities.
It is vital that national strategies should not impose top-down priorities on local areas where they may be inappropriate. Similarly, at local level it is vital that strategies to improve health should be co-created with local communities rather than being imposed by officials. Local authorities have a critical role to play, therefore, in working alongside local communities to plan and design effective local responses to improve their health and wellbeing and to tackle inequalities.
Case Study 2: Partnering for greater impact – the role of anchor institutions in a place
Anchor institutions are large organisations such as local councils, hospitals and universities whose long-term sustainability is tied to the wellbeing of the populations they serve. The role of the NHS as an anchor institution is explored below (see Section 4.3 of this report and the Health Foundation’s publication, Building healthier communities: the role of the NHS as an anchor institution). Anchors get their name because they have ‘sticky capital’ (ie their strong connections to the local population mean that they are unlikely to move) and have a significant influence on the health and wellbeing of a local community through their sizeable assets.
Working as anchors, these organisations have the potential to influence their local economy, improve the health of their local community and develop their local environment. They can do this through their roles as large employers, purchasers and land owners, and by taking a leading role in championing environmental sustainability. While individual organisations can make progress through embedding anchor approaches in their own operations, it is the combined weight of working in partnership with other anchors that offers the scale of opportunity for impact.
For example, in the Leeds City Region, the Joseph Rowntree Foundation (JRF) analysed the scale of impact that anchor organisations have when working together. In the region, 70 large anchors employ more than 200,000 people and have budgets in excess of £11bn. As part of its analysis, JRF found that, if 10 anchor institutions (including the local council, universities and hospitals) shifted 10% of their total spending to the local economy, this could drive an additional £168–196m into the local community.
A key challenge to collaborative working across anchor institutions is bringing together complex and multi-faceted organisations with different cultures, often working with different populations and with different pressures and demands. A key to the success of the anchor collaboration in the Leeds City Region case was the development of a shared framework that allows the different anchor organisations to assess their baseline activity across a range of domains and measure progress using shared metrics. JRF observed that, in the UK, local government has a critical role to play in convening and enabling other anchors across a place.
4.3 The role of communities
A whole-government approach is needed to create good health, but it would be a mistake to think that government alone can create the conditions needed for healthy lives. The approach needs to extend well beyond the public sector, with communities and families being a fundamental part of the health environment. Not only are strong communities and families a vital contributor to people’s wellbeing, it is also important for the public sector to acknowledge that local communities are often best placed to know what is needed to shape their local environment. An effective whole-government approach to health creation requires a commitment to invest in policies that build and strengthen communities and enable local communities to fully participate in shaping their local areas and the services they receive.
Relationships are a vital part of people’s lives and there is growing evidence of their importance for health. Loneliness is known to be a strong predictor of poor health and living alone is associated with increased health care use. By contrast, people with high levels of social capital (ie strong networks of relationships) are likely to have better health. However, there is evidence that individual social capital seems to be a significant contribution to health only when people live in regions with sufficiently high community social capital. This highlights the importance of building strong communities that have high levels of trust and strong social connectedness.
The role of government in building strong and healthy communities is two-fold. First, investing in community infrastructure has been found to improve social relations and wellbeing in a community. Community infrastructure – places designed for people to meet – includes public places and spaces where people coincidentally meet such as squares, parks, play areas, village halls and community centres. Other places that have a dual role in allowing people to meet include libraries, schools and places of faith and spirituality. Recognising the value of these to individual and community wellbeing and investing in community infrastructure is an important part of a whole-government approach to creating health.
Equally important, however, is the need to give local communities a meaningful role in shaping the places where they live. Local government has an important part to play in facilitating co-production of its services and its place-making by working in partnership with communities, while central government needs to put in place an enabling policy environment to support co-production and community participation in decision-making.
4.4 The role of the health and social care system
Last year in England there were 307 million GP practice appointments, 93.5 million outpatient appointments and 24.8 million A&E attendances. Many of these appointments and interactions with the health service were for conditions that are largely preventable, and which have a significant direct cost to the NHS. In addition, the NHS is the largest employer in the UK (employing 1.6 million people) and has a significant economic influence across most regions of the UK. All of these factors provide an opportunity for health care services and organisations to do more to focus on prevention and contribute to improved health for local communities.
Too often, the NHS is seen solely as a sickness services, and a prevention strategy should recognise and support the wider impact the NHS can have on prevention and population health. Not only does there need to be more coherent and systematic implementation of cost-effective preventative interventions and services, but all care pathways and services need to emphasise prevention. Nor can the NHS operate without greater awareness of how people’s circumstances affect their ability to be full partners in their care. Services need to understand and address this wider context. Examples of such interventions funded by the Health Foundation include: a community-based clinic to reduce social isolation and anxiety for people with severe chronic obstructive pulmonary disease; a physical health intervention for young people with psychosis; and a youth violence intervention programme based in hospitals.
Beyond provision of services, local NHS providers and commissioners need to find opportunities to participate in initiatives that shape the wider community within which they operate and ensure they are advocates for health creation.
Prevention and population health are central to greater integration of health and care at a place-based level and need to involve working in collaboration with partners across local government and the wider public sector. There is more scope for the development and use of linked data in local planning systems. The linking of electronic health records to data from local authorities, mental health providers in schools, and other providers of health and care services (including voluntary sector) can improve understanding of inequalities in access, care quality and outcomes across the full range of services that can impact on health. This will enable better monitoring of people’s health and enhance understanding of the relationship between health outcomes and wider determinants.
As the country’s largest employer, the NHS has a responsibility to act as a role model to provide good physical and psychosocial working conditions, as well as to advocate for improved health and wellbeing of its staff and communities. More locally, the NHS is often the largest economic force in local communities (an anchor institution). The NHS can have far reaching impact by intentionally leveraging its resources and activities to maximise social value and contribute to wider economic and social wellbeing in a place in order to create healthy local areas. The roles it can fulfil are as a:
- Major employer: The NHS can act as an important ‘ladder into employment’, particularly for underserved or disenfranchised populations.
- Large purchaser: Procurement and commissioning practices can be used to build community wealth and derive greater social benefit for local populations by shifting more spending locally, and working with suppliers that help achieve broader social and economic objectives.
- Significant owner of capital estate and property: Using its buildings and lands in a way that maximises population welfare.
- Leader on environmental sustainability: Using its position to influence others and adopting practices to improve environmental sustainability.
- Partner across a place: Working collaboratively with others, the NHS can learn, spread good practice and model civic responsibility to have a greater impact on community development.
4.5 The role of the private sector
While the role of government is crucial, the step-change needed to improve the nation’s health and reduce health inequalities cannot be achieved by the public sector acting alone. The private sector has an important role to play in creating the conditions that allow people to live healthy lives. Embedding health creation as a goal for all sectors will be necessary to see the desired improvements in people’s wellbeing and health.
Businesses have the potential to play either a positive or a negative role in creating a society that keeps people well and avoids preventable illness. Businesses can influence health through their role in producing and marketing potentially health-harming products (including tobacco, alcohol, food and drink) and their role as employers, as well as through the impact they have on their local – and the wider – environment.
The role of government regulation and taxation of commercial products is explored above (see Section 3.3). There is also a wider potential role for government to reward or recognise good practice in the private sector and to encourage or require further measurement of the health impacts that businesses have. This would ideally take into account all of the impacts, from those on consumers to those on employees and supply chains.
Beyond the role and impact of individual businesses, there is a role for government (at both local and national levels) to design and incentivise inclusive economies that share the benefits of economic growth with all sections of society. Over the long term, reducing poverty and creating economic opportunities for all sectors of society may be a significant strategy for addressing health inequalities.
5. Storing up problems for the future: the price of short-term approaches to government spending
Key points
- Many areas of spending across central and local government influence people’s health – not just spending on the NHS and social care. These wider areas of government spending have had their budgets placed under considerable pressure in recent years.
- Not only has spending on health-creating areas of government fallen, but there has been a significant shift away from proactive, health-creating areas of spend towards reactive, crisis management services. This can be seen in areas such as children’s services and housing, as well as in the health sector where less is being spent on public health and more on treatment.
- A real terms increase in the public health grant in 2020/21 will end five years of real term cuts that had reduced the grant by a fifth, but will fall significantly short of the £1bn required to reverse them. By failing to match the rate of increase in budget for NHS front-line services the grant will still represent a shrinking share of overall health spend.
- Spending on social security has fallen since 2012/13, partly due to falls in unemployment, but also because of a series of cuts to working age support. Changes introduced in the Summer Budget 2015 are set to mean further reductions across the rest of this decade and are likely to lead to rates of child poverty not seen for two decades, with the accompanying risks to health outcomes.
- In a context of fiscal austerity and rising demand, the capacity for local authorities to focus on the strategies that support better health and wellbeing has been eroded. There have been substantial reductions in central funding to local authorities since 2009/10 and cuts have fallen disproportionately on activities that maintain health and wellbeing.
- Current spending plans are intended to end the era of austerity with real term increases for all day-to-day spend of all departments announced in the 2019 Spending Round and overall departmental spending set to rise on a per capita basis. Comprehensive spending plans beyond 2020/21 are yet to be set out. Previous commitments for large increases in NHS funding into the next decade are likely to place pressure on funding for other departments, which would continue the broad prioritisation pattern of the last decade and the ensuing risks to the nation’s health.
5.1 How trends in central government expenditure are storing up problems for the future
Since 2010, reducing the extent to which annual government revenues are exceeded by spending, and reducing the existing stock of debt, have been a core focus for government. This has largely been achieved by reducing spending, as opposed to increasing tax revenues, with net debt falling as a share of GDP since 2017/18.
With some areas of spending protected, there have necessarily been larger than average reductions in spending across other areas of government (see Figure 11). Current spending plans suggest that this trend is set to continue, with many of these areas playing a crucial role in creating and maintaining the conditions that lead to good health – such as education or local government services. Under-investment in such policy areas that create the conditions for a healthy life risks significant problems being stored up for the future.
Social security
Social security is an example of government spending that helps protect people’s health. Around 28% of government spending is on social security, and the majority of that support (excluding most State Pension provision) is targeted at the most vulnerable in society – people who are out of work, disabled people, people with long-term illnesses and people with low income. This provision of supplementary income helps to protect the living standards of the most vulnerable and, in doing so, their health.
Targeted support through the Tax Credit system and Pension Credit has had some success at reducing poverty among children and pensioners since their introduction in the late-1990s. However, while pensioner benefits have been protected since 2010, working age support has been subject to a series of cuts that are set to continue until the end of the decade, as shown in Figure 10.
Figure 10: The changing generosity of working age welfare and percentage of children in poverty, index (100=2013/14), constant price terms (GDP deflator)
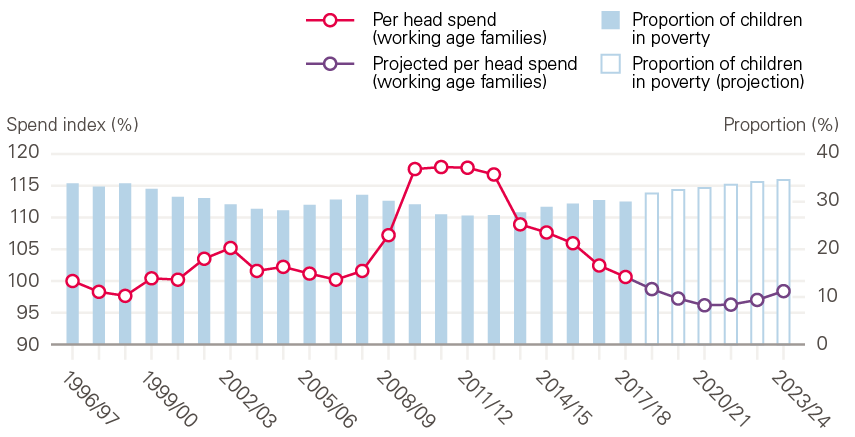
Note: Data from 2018/19 onwards are projections.
Source: Health Foundation analysis using Spring Statement 2019 Benefit Summary Table; Households Below Average Income, DWP.
Social security spending is measured on a per person basis across the non-pensioner population; that is, taking into account all those of working age, not just those receiving benefits. This makes the measurement sensitive to the number of people receiving benefits. On that basis, social security spending increased in 2009/10 due to a rise in unemployment and falls in earned income that led to higher overall spending on unemployment benefit and tax credits. The reduction in spending since 2012/13 – to below pre-financial crisis levels – partly reflects further falls in unemployment but also reflects a series of cuts to working age support. The largest of these were introduced in the Summer Budget 2015 and will mean further reductions in generosity across the rest of this decade. Resolution Foundation analysis anticipates that these cuts are likely to lead to nearly 35% of children living in poverty, a level not seen for two decades, with the accompanying risks to health outcomes. In comparison, pensioner poverty is expected to remain broadly flat over the period after experiencing significant reductions since the turn of the century.
5.2 Likely implications of future government spending plans
The spending plans set out in the 2019 Spending Round are intended to end the era of austerity with real term increases for all day-to-day spend of all departments announced in the 2019 Spending Round and overall departmental spending set to rise on a per capita basis. However, spending plans beyond 2020/21 are yet to be set out and large commitments to increase NHS funding are likely to mean that budgets for other departments will come under pressure, continuing the broad pattern of the last decade where NHS spend has represented a growing share of government spend (see Figure 11).
Figure 11: The differing impact of austerity across government departments, 2009/10 to 2020/21, real change in departmental resource budgets (resource Departmental Expenditure Limit per person, GDP deflator)
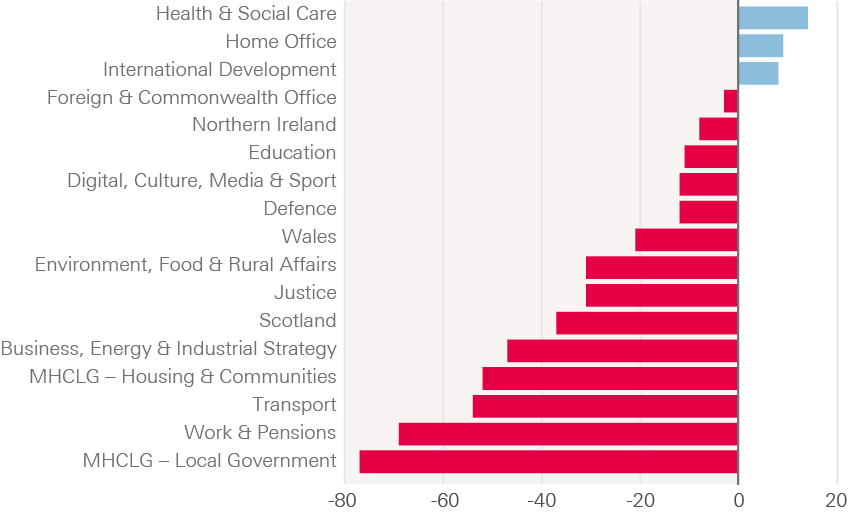
Source: Resolution Foundation, Rounding up: putting the 2019 Spending Round into context.
Even with the increased spend for 2020/21 set out at the 2019 Spending Round, compared to 2009/10, there have been substantial reductions to most government department budgets; the exceptions being international development (which accounts for a relatively small share of spending), the home office (following the 2019 Spending Round) and health and social care. By 2020/21 per person spending on health and social care is expected to be 14% higher than in 2009/10, while departments from education to local government will experience reductions of 11–77%.
There are already signs emerging that the drift away from expenditure that maintains wellbeing and health is leading to the emergence of considerable public health challenges – both in the short and long term. Ultimately, this approach creates a false economy. Underfunding preventative services and inadequate action across the wider determinants of health will only further increase pressure on the NHS and other crisis services. Such short-termism cannot continue as the demographic shifts towards an ageing society, which will bring its own pressures on government finances through both increased demand for services and pensions for the older population, and a relatively smaller working age population to provide the revenues to fund that support.
However, governments face a conundrum. The upfront investment required to maintain people’s health over the long term, while providing enough support to the current population with acute need – both older and younger – will require higher levels of spending. The next big debate will need to be about where those revenues come from. Investments in strategies that maintain and improve the nation’s health should not be considered solely as a ‘cost’. An effective strategy that places people’s health as a primary asset could in itself help improve the long-term fiscal picture, with a healthier population reducing future costs of poor health and increasing the productivity and activity rates of the population to fund those necessary services.
In a context of fiscal austerity and rising demand, the capacity for local authorities to focus on the strategies that support better health and wellbeing has been eroded. There have been substantial reductions in central funding to local authorities since 2009/10. The often statutory nature of services that are required to meet immediate needs and the discretionary nature of preventative spending has meant that, to stay within budgets, cuts have disproportionately targeted activities that maintain and protect health.
This is most starkly illustrated through the changing patterns in spending on children’s services and housing. While cases are few relative to the total population, being homeless or in the care system is associated with considerable health challenges. Cases of severe need increased at the same time as spending has shifted from prevention to meeting these needs (Figure 12). This creates the risk of a cycle, whereby prevention spending is cut to meet crisis need, thus fuelling greater future need.
Figure 12: Indexed changes in measures of severe need for housing and children’s services, England, 2010–2018
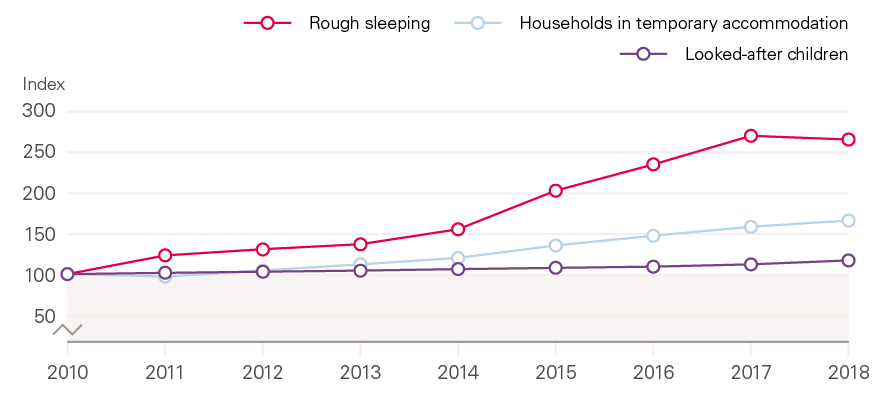
Source: Ministry of Housing, Communities and Local Government (MHCLG), Live Tables on Homelessness; Department for Education, Looked-after Children.
Children’s services
Children’s services encompass a range of activities from proactive early intervention, such as spending on youth centres, family support and children’s centres, to reactive, late intervention, which includes youth justice, and support for ‘looked-after’ children. ‘Looked-after’ children experience poor outcomes across a range of measures, including educational attainment as well as physical and mental health.
Figure 13 shows that spending by local authorities in England on children’s services between 2013/14 and 2018/19 has fallen by 2.9% in real terms. At the same time, the focus of that spending has changed considerably. By 2018/19, the share of spending on reactive services (children in need or ‘looked-after’) had reached 73%, up from 64% in 2013/14. There has been an increase in both the total amount spent and the share of what is an overall smaller budget for children’s services in the period. The share spent on preventative services has fallen from almost a third (32%) to less than a quarter (24%).
This increase in spending on more acute need appears to be a result of the growth in the number of children in the care system. With a statutory obligation to provide care, spending has increased: there were 75,000 children ‘looked-after’ in the year ending March 2018, up by 2,800 on the previous year and an increase of 7,350 (11%) on five years earlier.
Figure 13: The changing pattern of spend on local children’s services, England, 2013/14 to 2018/19, constant 2019/20 price terms (GDP deflator)
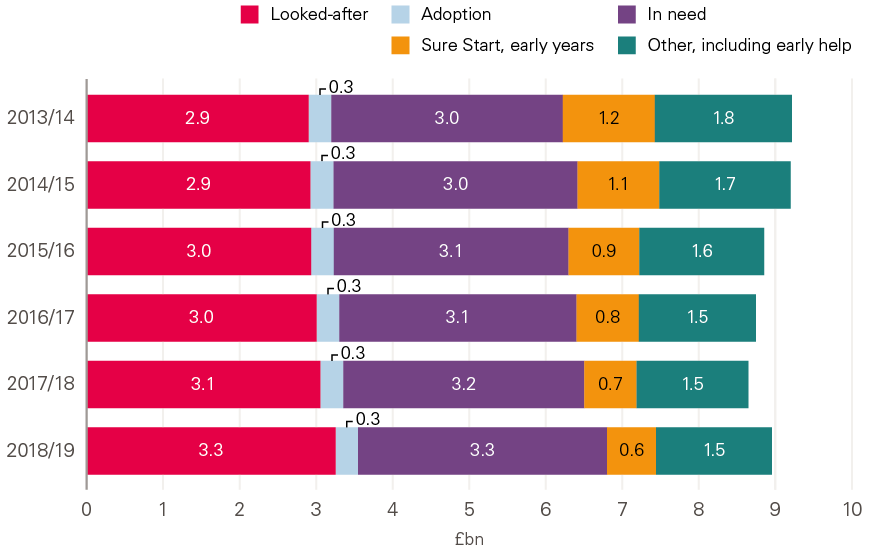
Source: Health Foundation analysis using Department for Education, Children, Schools and families financial data collection, 2013/14 to 2018/19.
The drift of spending away from prevention has important health implications. For example, a recently published evaluation of the Sure Start children’s centres programme found that it significantly reduced hospitalisations among children by the time they finish primary school. Importantly, the benefits of the programme were found to be greatest for children living in the most disadvantaged areas. The two-thirds reduction in funding for the programme (from £1.8bn in 2009/10 to £600m in 2017/18) is likely to have had a detrimental impact on children’s health and health inequalities.
Local housing provision
Rough sleeping is associated with tri-morbidity (physical and mental ill-health combined with substance misuse) and an average age of death 30 years shorter than the general population. The health care costs associated with homelessness are much higher per person, for example.
As well as being harmful to the health of those experiencing severe need, the risk is that cuts to preventative services will lead to further growth in reactive need and, ultimately, higher spending. For example, a study looking at the rise of homelessness in local authority areas found that reductions in local authority housing spending (including prevention spending) led to higher rates of homelessness. It also found a similar effect across a broader range of programmes not specifically designed to prevent homelessness, such as adult social care and other areas of social security.
Figure 14 shows that spending on homelessness activities has increased by a quarter since 2009/10, rising from £1.1bn to £1.4bn by 2017/18 (in 2019/20 real terms). Within that, however, the greatest increase has been in provision of temporary accommodation – a rise of £0.4bn since 2011/12 – rather than prevention to avoid homelessness in the first place.
Figure 14: The changing pattern of local authority spend on housing, 2009/10 to 2017/18, constant 2019/20 price terms (GDP deflator)
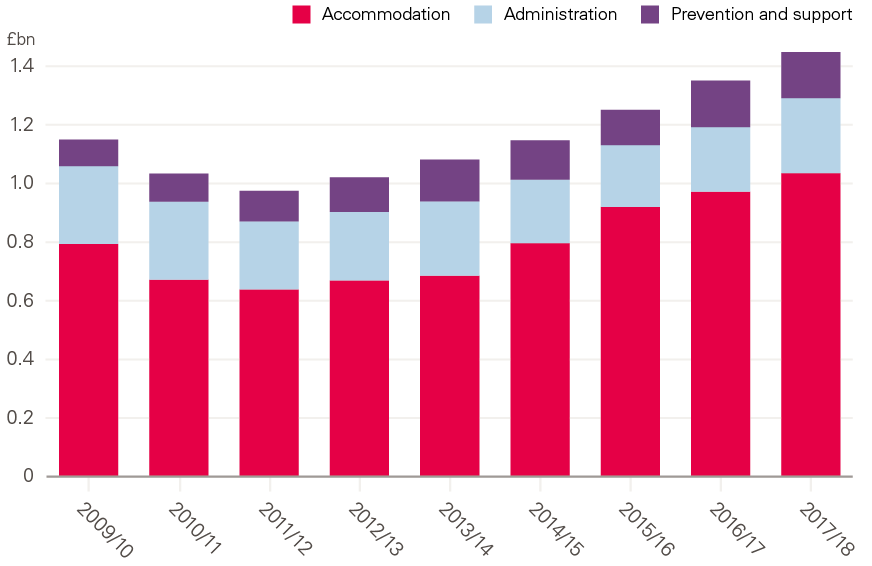
Source: Health Foundation analysis using MHCLG, Local authority expenditure data: 2009/10 to 2017/18.
5.3 Health spending increasingly skewed away from prevention
Within the Department of Health and Social Care’s expenditure there has been greater protection of spending on more severe needs via the NHS, while support to local authority public health services that help prevent ill health in the first place has been reduced (see Figure 15). Between 2015/16 and 2019/20, spending on NHS England is expected to have grown by 8% on a real term per head basis, relative to a 23% cut in the public health grant since allocations were first set out for 2015/16. This is despite recent analysis that found 75% of public health interventions reviewed by NICE were either cost-effective or cost-saving over time.
The public health grant supports prevention services and enables directors of public health to influence the determinants of health at a local level by working across other departments in local authorities.
The public health grant, currently £3.1bn a year, was first introduced in 2013/14. At this point, responsibility for preventative services – such as sexual health clinics, stop-smoking support, and drug and alcohol abuse services – moved from the NHS to local government. Responsibility for services for children aged 0–5 years was also moved to local government in the middle of 2015/16, with the annual equivalent of an additional £0.9bn a year of funding. But the total value of the public health grant has declined (in real terms) since 2015/16.
Figure 15: Growth in elements of health spend per person, 2015/16 to 2019/20, index (100=2015/16), constant price terms (GDP deflator), England population (all ages)
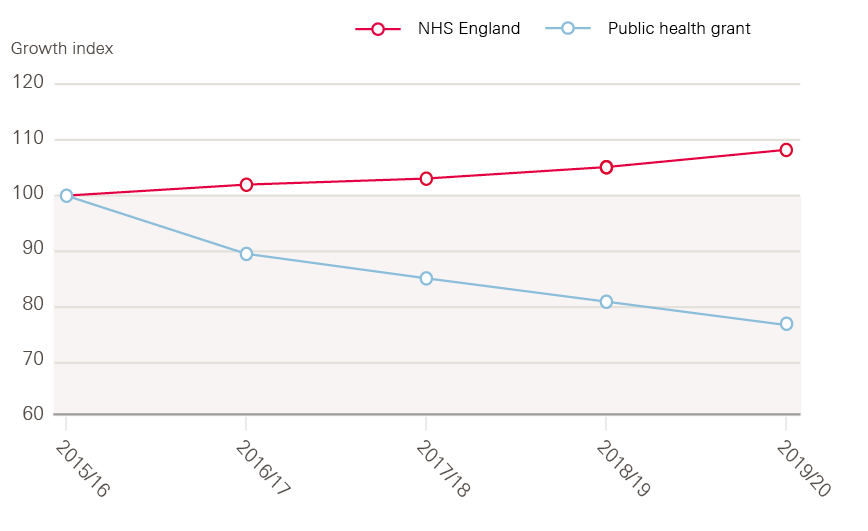
Source: Health Foundation analysis using Department of Health and Social Care, departmental spend; and MHCLG, Local government finance and expenditure, various.
The public health grant allocation for 2019/20 was £850m lower (23% lower in real terms per person) than when the grant was implemented in 2015/16. The 2019 Spending Round announced a real term increase in the grant for 2020/21, but this is likely to fall significantly short of the additional £1bn required to reverse real term per capita cuts since 2015/16. Nor is the increase in the public health grant likely to keep pace with growth in frontline NHS services. The result is that, since 2015/16 the public health grant represents a decreasing share of total health spend.
Making the case for public health interventions against health care treatments (in the context of the share of health spending dedicated to acute or preventative measures) can be difficult, given that the former tend to be assessed on an overall return on investment (ROI) basis and the latter in relation to the cost per quality-adjusted life-year (QALY). Research into the ROI from local-level public health measures suggests a typical return of 14:1 – that is, society benefits by an average of 14 times the initial investment into each intervention. There can be a wide range of returns, depending on intervention type and the geographical level (national or more local) at which it takes effect. For example, regulatory measures such as smoking bans (typical ROI of 46.5), health protection such as immunisation schemes (typical ROI of 34.2) and social interventions such as working with young offenders (typical ROI of 5.6). However, this research indicates that there is a clear case for greater ‘upstream’ public health investment.
6. In it for the long term: embedding health as a shared value across the whole of government and be
Key points
- A range of measures and structures are needed to ensure that health and addressing health inequalities are embedded as shared values across the whole of government, with action taken across the wider determinants and a renewed focus on preventative activity that stops people from becoming ill in the first place.
- There needs to be a fundamental shift in the way governments measure success. This needs to go beyond narrow measures of GDP and encompass wider outcomes including health and wellbeing.
- The cycle of short-term decision-making that currently prevails is undermining efforts to improve people’s health over the long term. There needs to be stronger legislative frameworks and cross-government bodies in order to encourage and facilitate long-term decision-making.
- Investment across government needs to be rebalanced towards health-creating areas of spending such as children’s services, housing and social security.
- While the role of government is pivotal in creating the conditions for long-term investment in strategies to maintain and improve people’s health, reductions in health inequalities will not be possible unless there is genuine and effective involvement of communities and place-based approaches.
6.1 Change the way success is measured
Good health is a country’s greatest asset but is not considered a primary measure of successful government. There needs to be new ways of measuring policy success, moving beyond traditional economic indicators such as GDP and encompassing wider metrics of population wellbeing and health equity. This would enable policies to be evaluated in terms of their contribution to health and wellbeing as well as their economic impacts, and would incentivise all areas of government to put health and wellbeing at the heart of policy.
A leading example of this approach comes from New Zealand which, in 2019, became the first country to commit to setting budgets on the basis of wellbeing rather than economic growth (see Case Study 3). The prevention green paper recently released by the government committed to developing and launching a new ‘Composite Health Index’, a policy that was originally recommended by the former Chief Medical Officer for England in her 2018 Annual Report. This could be a useful tool for embedding health as a shared value, but will only have the necessary impact if it is based on meaningful measurement of people’s wellbeing and health. If it is used in policy evaluation right across government, it could help to embed an approach that views health as one of the nation’s primary assets. Further research has also found that public health expenditure is three to four times as productive at the margin than health care expenditure, adding to the case for greater investment in public health.
Case Study 3: Using non-GDP measures to embed health in all policies
New Zealand’s Wellbeing Budget
In 2019, the New Zealand government published its first Wellbeing Budget, in which priorities are explicitly structured around intergenerational wellbeing. This is part of a strategy to put current and future generations’ wellbeing at the heart of government decision-making.
‘We’re starting from a position where the received wisdom – that creating economic wealth makes everyone better off by creating bigger and better businesses, higher employment, more savings and spending, an increased tax take and a greater ability for government to support those who are vulnerable or in poverty, ill health or deprivation – is no longer seen as a guaranteed ticket to a better place.’
David Lovatt, 2018
The budget has five priority areas: taking mental health seriously; improving child wellbeing; supporting Maori and Pasifika aspirations; building a productive nation; and transforming the economy. These priorities were selected using expert advice and data from New Zealand’s Living Standards Framework (LSF) Dashboard. The LSF Dashboard comprises a range of indicators and analysis for assessing the wellbeing impacts of policies and proposals across generations.
For the first time, government ministers were required to show how their bids would achieve the wellbeing priorities, which resulted in many innovative, cross-departmental programmes being developed. Budget allocations were based on a wellbeing analysis, taking into account the impact that initiatives would have on economic, social, environmental and cultural outcomes for current and future generations.
This is thought to be the first attempt by any country to integrate wellbeing formally into its national budget-setting processes. This has the potential to fundamentally change the way government decisions are made, opening the door for health and wellbeing to be considered a key measure of national success and a contributor to other forms of development.
6.2 Embed long-term health considerations in legislation and policy for the whole of government
A long-term, cross-government approach is critical to improving health and reducing health inequalities nationally. However, short-term political cycles act against this. As outlined in the Health Foundation’s report, Shaping Health Futures, governments in the UK have often found it difficult to plan and prepare for the future – for health and social care as well as on infrastructure, tax and other policy areas. Legislative frameworks are increasingly being used in other parts of the UK to help public bodies break out of short-term decision-making cycles and take a long-term approach to improving health and wellbeing. For example, in 2015 the Welsh government enacted the Well-being of Future Generations (Wales) Act, which placed a duty on public bodies to work towards improving the health and wellbeing of both current and future generations. Case Study 4 illustrates how public bodies in Wales are working differently since the introduction of the Act, and what can be learned from their experiences.
A legislative framework of this kind would need to consider health and wellbeing in the widest sense, including the social, environmental, commercial and economic conditions people live in. It could be designed to ensure that government investments are evaluated in a way that recognises the long-term value of health and wellbeing to society as a whole. While more could be done to ensure that existing legislation – such as the Public Services (Social Value) Act 2012 – is used to its full effect, more wide-ranging legislation could be a powerful tool to drive change.
Case Study 4: Long-term planning for future generations
The Well-being of Future Generations (Wales) Act 2015
In 2015, Wales passed the Well-being of Future Generations (Wales) Act, enshrining in legislation a vision to create a Wales that people want to live in now and in the future through improving its social, economic, environmental and cultural wellbeing.
While a legal duty to promote sustainable development had existed since devolution in 1999, the Act strengthened the responsibilities of Welsh government and public bodies to work together to make it a reality. The Welsh people provided a strong mandate for change, demonstrating in ‘The Wales We Want’ national conversation their support for improving wellbeing and planning for the future.
Working jointly and differently
Public Services Boards were set up in each local authority area to deliver the Act’s wellbeing goals. The Boards have fostered cross-sector collaboration and developed plans for how they will work together to achieve the goals in their local areas. For example, the Carmarthenshire Board is reforming local procurement systems to drive the procurement of locally grown food. By supporting local producers, supply chains and businesses, this work will contribute to wellbeing in a range of ways, including promoting a low-carbon economy and creating local growth.
Organisations have embraced the principles in the Act and have led by example. Public Health Wales demonstrated its commitment when it moved to new, sustainable offices equipped with recycled furniture, employing a local social enterprise to fit recycled carpets and working with accessibility experts to ensure that the building is fully accessible. This highlighted how every person and organisation across Wales can play a role in sustainability.
National leadership
The Future Generations Commissioner has raised the profile of the Act and promoted action across Wales. Through maintaining a focus on the wellbeing of current and future generations, the Commissioner has shifted the debate on issues such as air pollution, housing and adverse childhood experiences. For example, the Commissioner is influencing the Welsh government Housing Innovation Grant to ensure that the Act’s wellbeing goals are embedded in its programmes.
With the third sector and Welsh government, the Commissioner is also agreeing a definition of ‘prevention’ to be used in budget setting.
Developing future generations
The Act has provided a stimulus for equipping young people in Wales with the skills they will need for the future. For example, the award-winning Rethinking Business for a Changing World initiative at University of Wales Trinity Saint David is offering students the knowledge and skills to lead sustainable, ethical and responsible businesses aligned with the Act’s wellbeing goals.
Unlike policy approaches that had gone before, the Act has been a powerful way of embedding long-term prioritisation of economic, social, environmental and cultural wellbeing across the public sector and beyond.
Legislation on its own, however, is unlikely to be sufficient unless structures are put in place to support its implementation. For example, it would be helpful to establish a high-level cross-government working group or committee, ideally with Cabinet-level accountability, with responsibility for overseeing the implementation of a whole-government approach to keeping people healthy and reducing health inequalities.
Similarly, embedding long-term decision-making at the heart of government could be aided by an independent public body, which is able to scrutinise government policy and provide independent, expert analysis. Examples of such bodies include the Future Generations Commissioner in Wales, the Children’s Commissioner for England and the Office for Budget Responsibility for the UK. Case Study 5 gives further analysis of what can be learned for existing bodies of this kind. Establishing a commissioner to provide independent analysis of trends in the nation’s health and advise on the actions required to address health inequalities could be an important way of embedding health creation across the whole of government.
Case Study 5: Providing expert analysis and advocacy through an independent public body or commissioner
A number of independent and semi-independent public bodies and commissioner roles have been established within the UK to support a longer term approach to analysis and policy decision-making that is unconstrained by more immediate short-term needs and opportunities. Examples include the creation of the Children’s Commissioner for England role in 2004, the establishment of an Office for Budget Responsibility in 2011, the Low Pay Commission set up in 1997, and the Social Mobility Commission established in 2010.
Example: Children’s Commissioner for England
The Children’s Commissioner for England has a statutory remit that includes understanding what children and young people think about the things that affect them, and encouraging decision-makers to take these views and interests into account when making decisions about children and young people. The Commissioner also has data-gathering powers and powers of entry to talk with children and gain evidence, with the aim of supporting ‘long-term change and improvements for children’, particularly those who are most vulnerable. The role is supported by an advisory group, an audit and risk committee and children’s groups, stakeholders and specialists. Crucially, the Commissioner is treated as the ‘eyes and ears’ of children in the system and the country as a whole, and is expected to carry out their duties ‘without fear or favour’ of government, children’s agencies or the voluntary and private sectors. The Commissioner submits evidence to relevant inquiries and produces regular reports with key recommendations for government.
Form, function and status of independent or semi-independent public bodies,
An audit of 16 different public bodies was undertaken in 2017 by Emma Norris of the Institute for Government to advise the House of Lords Select Committee on the Long-Term Sustainability of the NHS about implications for a new health and social care body.
Most independent or semi-independent bodies explored within the audit were found to perform an analytical and/or advisory function, either adding new expert insight or bringing together stakeholders and data to establish consensus positions on controversial issues. Some bodies, such as the Social Mobility Commission, also play a more active advocacy role around a particular cause, with a mandate to promote that particular cause among a range of different organisations.
The importance of a clearly articulated and widely understood scope and purpose to be agreed for public bodies was identified by the audit, with a need for the remit of any new body to be carefully considered – including with regards to the functions it would perform and the permanence of the body or commissioner role. Effective leadership is also vital, with a need for the requisite expertise and credibility to establish the body, build strong stakeholder relationships and ensure independence. Such bodies should also have a sufficiently well-resourced analytical capability in order to inform decision-making, and attention should be paid to reporting arrangements with respect to the frequency, initiation, time horizon and purpose of reports.
Certain forms of organisation and the status of the independent body can also guard against political interference. While it does not entirely remove the risk of political interference, giving independent bodies statutory powers means that ministers must pass primary legislation to abolish or substantially change a body.
6.3 Invest in people’s health as one of the nation’s primary assets
Government should explicitly acknowledge good health as one of the country’s greatest assets and prioritise long-term investment in health across the whole of the public sector. Investment across government needs to be rebalanced towards health-creating areas of spending such as children’s services, housing and social security. In order to counteract past and (planned) future trends away from spending that keeps people healthy (outlined in Section 5), mechanisms are needed to review the balance of health-promoting versus reactive spending across and within different areas of government. One specific area of investment that should be addressed is the public health grant (see Section 5.3).
However, changing the circumstances in which people live is not simply a question of government spending. Other levers, such as social protection through regulation and taxation, can be used to promote a general shift towards creating health, with particular attention given to those strategies that most effectively support communities experiencing the greatest deprivation. Specific areas of focus could include:
- action to improve the quality of housing by enforcing health-informed minimum housing standards and addressing the quality of homes built outside of the usual planning system through ‘permitted development’
- extending ‘polluter pays’ regulation and taxation of health-harming commercial products. This could include extending the Soft Drinks Industry Levy to other products with negative impacts on people’s health
- supporting early years development including through measures to address child poverty and re-invest in local early years services, which have seen major funding cuts in recent years
- proposing amendments to the UK Corporate Governance Code to require businesses to report on their impact on the health and wellbeing of employees, customers and communities.
6.4 Enable the NHS to take a stronger role in prevention
A whole-government approach to creating health also needs to include the NHS. The role of the NHS is explored in detail in Section 4.4, but key principles for ensuring that health creation (as opposed to health care) is embedded in the way the NHS works include:
- ensuring that prevention and population health are at the centre of moves towards greater integration of health and social care
- encouraging or requiring NHS organisations to work in collaboration with local government and the wider public sector to support a place-based approach to prevention
- supporting the development and use of linked data that could be integrated into local planning systems, to enable better monitoring of people’s health and enhanced understanding of the relationship between health outcomes and wider determinants
- systematically implementing preventative interventions that are known to be cost-effective but are not currently used consistently across the NHS (for example, smoking cessation services)
- promoting the role of the NHS as an anchor in communities. NHS organisations should act as a role model and advocate for the improved health and wellbeing of their staff and communities, working alongside other anchor institutions including local authorities, universities and housing associations.
6.5 Enable coordinated, place-based approaches to improving health and reducing health inequalities
While there is a great deal that can be done by central government, locally-led approaches are also vital. Central government has a role to play in creating the conditions that can allow genuinely locally-led approaches to improving health and reducing health inequalities. The devolution of power and budgets to the Greater Manchester region is a leading example of this approach (see Case Study 6).
Central government needs to create the conditions for locally-led, place-based approaches to improving wellbeing and health by giving local governments the responsibility, powers and funding needed to create healthy living conditions. As outlined in Section 4.3, it is vital that communities are empowered to be part of the decision-making process and that the value of community infrastructure is recognised and given appropriate investment. This may require significant changes in the relationship between local government and residents.
The Wigan Deal is an example of an approach that has successfully engaged local people in working with the local authority through taking an asset-based approach to community engagement. The Deal is credited with boosting rates of volunteering and recycling in the borough as well as helping to ease the pressure of adult social care services. Although the council faced severe budget cuts, as part of the deal £10m was invested in the community sector to empower hundreds of community groups.
This report shows that the government’s recent short-term spending decisions over the past 8 years are already widening inequalities in health outcomes and storing up problems for the future. This position is not sustainable. It will take bold political decisions at national government level and commitment over the long term to create the conditions for good health. This is the time to set the direction for a healthier, more prosperous future.
Case Study 6: Joining up public services
The Greater Manchester Model: Unified Public Services in Greater Manchester
Greater Manchester is reforming its public services to prioritise wellbeing, prevention and early intervention. In 2019, the Greater Manchester Combined Authority set out plans to embed prevention in practice through the Greater Manchester Model, which joins up public services in neighbourhoods, streamlines commissioning and information sharing, and looks at resources and leadership across Greater Manchester.
We spoke to people working in Greater Manchester to find out what’s happening on the ground and what they’ve learned along the way.
Joint working
Each neighbourhood will have an Integrated Neighbourhood Function made up of front-line practitioners from a wide range of local services. These teams will develop new ways of supporting residents in more holistic and proactive ways. For example, in Wigan, police officers, housing staff, health and social workers, JobCentre staff and local community groups work closely together, sharing resources and information to support residents and communities. This involves working across and beyond traditional boundaries and coordinating services and key working to ensure that people can access the right support at the right time.
Cross-sector partnerships are also being established over larger geographical footprints. For example, in partnership with the Department for Work and Pensions, Greater Manchester’s Work and Health Programme supports people to find and stay in work. Through their GPs, people who are unemployed and have a health condition or disability can access a specialised package of support to find work, including talking therapies for people with mental health needs and an employment skills service to equip people with valuable skills for securing work and progressing.
Flexible funding
To overcome siloed budgets hampering cross-sector working, Greater Manchester is working to create a more flexible approach to funding to enable greater integration of services. For example, localities are moving towards single commissioning functions. Since 2016/17, Tameside and Glossop has pooled their local authority, clinical commissioning group and NHS Foundation Trust budgets in an Integrated Commissioning Fund. This enables the locality to use their resources more strategically and efficiently for working towards a shared goal of improving residents’ health and wellbeing.
Greater Manchester has pooled various budgets in a Reform Investment Fund, which is designed to be used flexibly to foster local innovation. Neighbourhoods can use funding to invest resources in activities that will help them reform services to address local needs. This may include service development, workforce training, funding new roles or creating information-sharing systems.
Information sharing
To support system-wide working, the Greater Manchester Information Board is developing governance and processes for sharing information. For example, as part of NHS England and the Local Government Association’s Health and Care Record Exemplars programme, Greater Manchester is piloting technologies that combine people’s multiple care records into a single one. This information can be accessed securely by a range of professionals, giving them a richer understanding of the person’s needs and ability to provide a more joined-up service. The pilot will initially link health and social care information, but the ambition is to expand this to a wider range of services, such as housing, employment and policing.
References
- Davidson N, Townsend P, Whitehead M. Inequalities in Health. London: Penguin; 1990.
- Acheson D. Independent Inquiry into Inequalities in Health. Department of Health and Social Care; 1998.
- Marmot M, Wilkinson R. Social Determinants of Health. Oxford: Oxford University Press; 2006.
- Barr B, Higgerson J, Whitehead M. “Investigating the impact of the English health inequalities strategy: time trend analysis”. BMJ. 2017;358(8116):j3310.
- The Health Foundation. Healthy lives for people in the UK: Introducing the Health Foundation’s healthy lives strategy [Internet]. 2017. (www.health.org.uk/publications/healthy-lives-for-people-in-the-uk)
- HM Government, Advancing our health: prevention in the 2020s, July 2019. (www.gov.uk/government/consultations/advancing-our-health-prevention-in-the-2020s/advancing-our-health-prevention-in-the-2020s-consultation-document)
- Marshall L, Finch D, Cairncross L, Bibby J. The nation’s health as an asset: Building the evidence on the social and economic value of health [Internet]. The Health Foundation; 2018. (www.health.org.uk/publications/the-nations-health-as-an-asset)
- Marmot M, Allen J, Goldblatt P, Boyce T, McNeish D, Grady M et al. Fair Society, Healthy Lives: The Marmot Review [Internet]. Institute of Health Equity; 2010. (www.instituteofhealthequity.org/resources-reports/fair-society-healthy-lives-the-marmot-review)
- Jones N, Conklin A, Suhrcke M, Monsivais P. “The Growing Price Gap between More and Less Healthy Foods: Analysis of a Novel Longitudinal UK Dataset”. PLoS ONE. 2014;9(10):e109343.
- Scott C, Sutherland J, Taylor A. Affordability of the UK’s Eatwell Guide [Internet]. The Food Foundation; 2018. (foodfoundation.org.uk/publication/affordability-eatwell-guide)
- Elwell-Sutton T, Marshall L, Bibby J, Volmert A. Briefing: Reframing the conversation on the social determinants of health [Internet]. The Health Foundation; 2019. (www.health.org.uk/sites/default/files/upload/publications/2019/Reframing-the-conversation-on-social-determinants.pdf)
- Kane M, Bibby J. A place to grow: Exploring the future health of young people in five sites across the UK [Internet]. The Health Foundation; 2018. (www.health.org.uk/publications/a-place-to-grow)
- Public Health England. A review of recent trends in mortality in England [Internet]. Public Health England; 2018. (www.gov.uk/government/publications/recent-trends-in-mortality-in-england-review-and-data-packs)
- OECD Better Life Index: Health [Internet]. OECD. 2019 [cited 30 May 2019]. Available from:(www.oecdbetterlifeindex.org/topics/health)
- Steel N, Ford J, Newton J, Davis A, Vos T, Naghavi M et al. “Changes in health in the countries of the UK and 150 English Local Authority areas 1990–2016: a systematic analysis for the Global Burden of Disease Study 2016”. The Lancet. 2018;392(10158):1647–1661.
- Stafford M, Steventon A, Thorlby R, Fisher R, Turton C, Deeny S. Briefing: Understanding the health care needs of people with multiple health conditions [Internet]. The Health Foundation; 2018. (www.health.org.uk/publications/understanding-the-health-care-needs-of-people-with-multiple-health-conditions)
- The Health Foundation. Too many cancers are still being diagnosed too late: Health Foundation response to ONS cancer survival statistics [Internet]. 2019. (www.health.org.uk/news-and-comment/news/too-many-cancers-are-still-being-diagnosed-too-late)
- Morris J. Public health [Internet]. Nuffield Trust. 2019 [cited 30 May 2019]. (www.nuffieldtrust.org.uk/news-item/indicator-update-public-health)
- Wang Y, McPherson K, Marsh T, Gortmaker S, Brown M. “Health and economic burden of the projected obesity trends in the USA and the UK”. The Lancet. 2011;378(9793):815–825.
- Age UK. All the Lonely People: Loneliness in Later Life [Internet]. 2018. (www.ageuk.org.uk/latest-press/articles/2018/october/all-the-lonely-people-report)
- The Health Foundation. Older people living alone are 50% more likely to visit A&E than those who live with others [Internet]. 2018. (www.health.org.uk/news-and-comment/news/older-people-living-alone-are-50-more-likely-to-visit-ae-than-those-who-live-with)
- NHS Digital. Mental Health of Children and Young People in England, 2017: Summary of key findings [Internet]. 2019. (files.digital.nhs.uk/A6/EA7D58/MHCYP%202017%20Summary.pdf)
- Public Health England. Proposed changes to the Public Health Outcomes Framework from 2019/20: a consultation [Internet]. Public Health England; 2019. (www.gov.uk/government/consultations/public-health-outcomes-framework-proposed-changes-2019-to-2020)
- Imai K, Soneji S. “On the Estimation of Disability-Free Life Expectancy”. Journal of the American Statistical Association. 2007;102(480):1199–1211.
- Public Health England. Chapter 1: life expectancy and healthy life expectancy. Health profile for England: 2017 [Internet]. 2017 [cited 30 May 2019]. (www.gov.uk/government/publications/health-profile-for-england)
- Department for Digital, Culture, Media & Sport. Community Life Survey, England 2017 to 2018: Reference tables [Internet]. Department for Digital, Culture, Media & Sport; 2018. Tables B4 and A3, respectively. (www.gov.uk/government/statistics/community-life-survey-2017-18)
- Newton J, Briggs A, Murray C, Dicker D, Foreman K, Wang H et al. “Changes in health in England, with analysis by English regions and areas of deprivation, 1990–2013: a systematic analysis for the Global Burden of Disease Study 2013”. The Lancet. 2015;386(10010):2257–2274.
- Dolan P, Peasgood T, White M. “Do we really know what makes us happy? A review of the economic literature on the factors associated with subjective well-being”. Journal of Economic Psychology. 2008;29(1):94–122.
- Ngamaba K. “Determinants of subjective well-being in representative samples of nations”. The European Journal of Public Health. 2017;27(2):377–382.
- Kanesarajah J, Waller M, Whitty J, Mishra G. “Multimorbidity and quality of life at mid-life: A systematic review of general population studies”. Maturitas. 2018;109:53–62.
- Williams J, Egede L. “The Association Between Multimorbidity and Quality of Life, Health Status and Functional Disability”. The American Journal of the Medical Sciences. 2016;352(1):45–52.
- Woodward A, Kawachi I. “Why reduce health inequalities?” Journal of Epidemiology & Community Health. 2000;54(12):923–929.
- Statistics – Working days lost in Great Britain [Internet]. Health and Safety Executive. [cited 30 May 2019]. (www.hse.gov.uk/Statistics/dayslost.htm)
- Garrow V. Presenteeism: A review of current thinking [Internet]. Institute for Employment Studies; 2016. (www.employment-studies.co.uk/resource/presenteeism-review-current-thinking)
- European Working Conditions Survey – Data visualisation [Internet]. Eurofound. 2019 [cited 30 May 2019]. (www.eurofound.europa.eu/data/european-working-conditions-survey)
- Frontier Economics Limited. An empirical analysis of the effect of health on aggregate income and individual labour market outcomes in the UK [Internet]. The Health and Safety Executive; 2008. (www.hse.gov.uk/research/rrhtm/rr639.htm)
- Disney R, Emmerson C, Wakefield M. “Ill health and retirement in Britain: A panel data-based analysis”. Journal of Health Economics. 2006;25(4):621–649.
- The Social and Economic Value of Health [Internet]. The Health Foundation. [cited 30 May 2019]. (www.health.org.uk/funding-and-partnerships/programmes/the-social-and-economic-value-of-health)
- Davies S. Annual Report of the Chief Medical Officer, 2018: Health 2040 – Better Health Within Reach [Internet]. Department of Health and Social Care; 2018. (www.gov.uk/government/publications/chief-medical-officer-annual-report-2018-better-health-within-reach)
- Public Health Profiles [Internet]. Public Health England. [cited 30 May 2019]. (fingertips.phe.org.uk/search/employment)
- Faber T, Kumar A, Mackenbach J, Millett C, Basu S, Sheikh A et al. “Effect of tobacco control policies on perinatal and child health: a systematic review and meta-analysis”. The Lancet Public Health. 2017;2(9):e420–e437.
- Martineau F, Tyner E, Lorenc T, Petticrew M, Lock K. “Population-level interventions to reduce alcohol-related harm: An overview of systematic reviews”. Preventive Medicine. 2013;57(4):278–296.
- Greszczuk C. Implementing health in all policies: lessons from around the world. [Internet]. The Health Foundation; 2019. (www.health.org.uk/publications/reports/implementing-health-in-all-policies)
- Action on Smoking and Health. Key dates in the history of anti-tobacco campaigning [Internet]. Action on Smoking and Health; 2017. (ash.org.uk/information-and-resources/briefings/key-dates-in-the-history-of-anti-tobacco-campaigning)
- Office for National Statistics; 2018. Adult smoking habits in the UK: 2017 [Internet]. (www.ons.gov.uk/people populationandcommunity/healthandsocialcare/healthandlifeexpectancies/bulletins/adultsmokinghabitsin greatbritain/2017)
- Smoking [Internet]. The King’s Fund; 2019. (www.kingsfund.org.uk/projects/time-think-differently/trends-healthy-behaviours-smoking)
- Centre for Public Impact. Smoking ban in England and Wales [Internet]. Centre for Public Impact; 2016. (www.centreforpublicimpact.org/case-study/smoking-ban-england-and-wales)
- Institute for Policy Research. The impact of smokefree legislation (‘the smoking ban’): evidence from research [Internet]. University of Bath. (www.bath.ac.uk/publications/the-impact-of-smokefree-legislation-the-smoking-ban-evidence-from-research)
- Settle K. Healthier and happier lives: how libraries deliver [Internet]. Libraries Taskforce. 2016 [cited 30 May 2019]. (librariestaskforce.blog.gov.uk/2016/09/26/healthier-and-happier-lives-how-libraries-deliver)
- Citizens Advice. How we make a difference: Our impact in 2017/18 [Internet]. Citizens Advice; 2018. (www.citizensadvice.org.uk/about-us/difference-we-make/impact-of-citizens-advice-service/all-our-impact)
- Local Government Association. Nobody left behind: maximising the health benefits of an inclusive local economy [Internet]. Local Government Association; 2019. (www.local.gov.uk/nobody-left-behind-maximising-health-benefits-inclusive-local-economy)
- Newby L, Denison N. Harnessing the power of anchor institutions – a Progressive Framework [Internet]. Joseph Rowntree Foundation; 2019. (democracy.leeds.gov.uk/documents/s181576/4%20Anchor%20 Institution%20Progression%20Framework%20Toolkit.pdf)
- Devins D, Gold J, Boak G, Garvey R, Willis P. Maximising the local impact of anchor institutions: a Case Study of Leeds City Region [Internet]. Joseph Rowntree Foundation; 2017. (www.jrf.org.uk/report/maximising-local-impact-anchor-institutions-case-study-leeds-city-region)
- Dreyer K, Steventon A, Fisher R, Deeny S. “The association between living alone and health care utilisation in older adults: a retrospective cohort study of electronic health records from a London general practice”. BMC Geriatrics [Internet]. 2018 [cited 30 May 2019];18(269). (bmcgeriatr.biomedcentral.com/articles/10.1186/s12877-018-0939-4)
- Rocco L, Suhrcke M. Is social capital good for health?: A European perspective [Internet]. World Health Organization; 2019. (www.euro.who.int/en/publications/abstracts/is-social-capital-good-for-health-a-european-perspective)
- Bagnall A, South J, Di Martino S, Southby K, Pilkington G, Mitchell B et al. “What works to boost social relations and community wellbeing? A scoping review of the evidence”. European Journal of Public Health. Vol 27. 2017/11/01. 2018. (www.researchgate.net/publication/320534027_What_works_to_boost_social_relations_and_community_wellbeing_A_scoping_review_of_the_evidence)
- Ryan-Collins J, Stephens L. Co-production: A Manifesto for growing the core economy [Internet]. New Economics Foundation; 2019. (neweconomics.org/2008/07/co-production)
- NHS Digital. Appointments in General Practice, June 2019. 2019 (digital.nhs.uk/data-and-information/publications/statistical/appointments-in-general-practice/oct-2018)
- NHS Digital. Hospital Outpatient Activity 2017–18. 2018 (files.digital.nhs.uk/97/20440A/hosp-epis-stat-outp-summ-rep-2017-18-rep.pdf)
- NHS England. A&E Attendances and Emergency Admissions 2018–2019. 2019. (www.england.nhs.uk/statistics/statistical-work-areas/ae-waiting-times-and-activity)
- ONS. Public sector employment, UK: June 2018, statistical bulletin; 2018 (bit.ly/2zO1hn9).
- The Health Foundation. Three projects aimed at preventing ill health [Internet]. The Health Foundation; 2018. (www.health.org.uk/newsletter-feature/three-projects-aimed-at-preventing-ill-health-%C2%A0)
- Shafique A. Four ways we can build a more inclusive economy [Internet]. RSA; 2019. (www.thersa.org/discover/publications-and-articles/rsa-blogs/2019/03/4-ways-inclusive)
- Corlett A. The Living Standards Outlook 2019 [Internet]. Resolution Foundation; 2019. (www.resolutionfoundation.org/publications/the-living-standards-outlook-2019)
- The Resolution Foundation. Super, smashing, great? Spring Statement 2019 response [Internet]. The Resolution Foundation; 2019. (www.resolutionfoundation.org/publications/super-smashing-great-spring-statement-2019-response)
- Department for Work and Pensions. Households below average income (HBAI) statistics [Internet]. Department for Work and Pensions; 2019. (www.gov.uk/government/collections/households-below-average-income-hbai--2)
- Tinson A, Ayrton C, Petrie I. A Quiet Crisis: Local government spending on disadvantage in England [Internet]. New Policy Institute; 2018. (www.npi.org.uk/publications/local-government/quiet-crisis)
- Viner R, Taylor B. “Adult Health and Social Outcomes of Children Who Have Been in Public Care: Population-Based Study”. Pediatrics. 2005;115(4):894–899.
- Department for Education. Children looked after in England (including adoption), year ending 31 March 2018 [Internet]. Department for Education; 2018. (assets.publishing.service.gov.uk/government/uploads/system/uploads/attachment_data/file/757922/Children_looked_after_in_England_2018_Text_revised.pdf)
- Cattan S, Conti G, Farquharson C, Ginja R. The health effects of Sure Start [Internet]. Institute for Fiscal Studies, Economic & Social Research Council, Nuffield Foundation; 2019. (www.ifs.org.uk/publications/14139)
- Brodie C, Carter S, Perera G. Rough sleepers: health and healthcare [Internet]. North West London NHS; 2013. (www.jsna.info/document/rough-sleepers)
- Department of Health. Healthcare for Single Homeless People [Internet]. Department of Health; 2010. (webarchive.nationalarchives.gov.uk/20130123201505/http://www.dh.gov.uk/en/Publicationsandstatistics/ Publications/PublicationsPolicyAndGuidance/DH_114250)
- Loopstra R, Reeves A, Barr B, Taylor-Robinson D, McKee M, Stuckler D. “The impact of economic downturns and budget cuts on homelessness claim rates across 323 local authorities in England, 2004–12”. Journal of Public Health. 2017;38(3):417–425.
- Valuing Nature Programme. The cost-effectiveness of addressing public health priorities through improved access to the natural outdoors [Internet]. Valuing Nature Programme; 2017. (valuing-nature.net/naturally-healthy)
- Charlesworth A, Gershlick B, Firth Z, Kraindler J, Watt T. Investing in The NHS long term plan. The Health Foundation; 2019. (www.health.org.uk/publications/reports/investing-in-the-nhs-long-term-plan)
- The Health Foundation. Invest in public health now, or store up problems for the future [Internet]. The Health Foundation; 2019. (www.health.org.uk/news-and-comment/blogs/invest-in-public-health-now-or-store-upproblems-for-the-future)
- Masters R, Anwar E, Collins B, Cookson R, Capewell S. “Return on investment of public health interventions: a systematic review”. Journal of Epidemiology and Community Health. 2017;71(8):827–834.
- Davies S. Annual Report of the Chief Medical Officer, 2018: Health 2040 – Better Health Within Reach. Department of Health and Social Care; 2018. (assets.publishing.service.gov.uk/government/uploads/system/uploads/attachment_data/file/767549/Annual_report_of_the_Chief_Medical_Officer_2018_-_health_2040_-_better_health_within_reach.pdf)
- Martin S, Lomas J, Claxton K, “Is an Ounce of Prevention Worth a Pound of Cure? Estimates of the Impact of English Public Health Grant on Mortality and Morbidity”, CHE research paper 166, 2019 (www.york.ac.uk/media/che/documents/papers/researchpapers/CHERP166_Impact_Public_Health_Mortality_Morbidity.pdf)
- New Zealand Government. The Wellbeing Budget [Internet]. 2019. (treasury.govt.nz/publications/wellbeing-budget/wellbeing-budget-2019)
- Cameron, G., Alderwick, H., Bowers, A., Dixon, J., Shaping Health Futures: Preparing for tomorrow’s possibilities today [Internet]. Health Foundation, 2019. (www.health.org.uk/sites/default/files/upload/publications/2019/Shaping-Health-Futures-report-June-2019.pdf)
- The Children’s Commissioner for England [Internet]. About us. The Children’s Commissioner for England. 2019 [cited 30 May 2019]. (www.childrenscommissioner.gov.uk/about-us/the-childrens-commissioner-for-england)
- Select Committee on the Long-term Sustainability of the NHS. The Long-term Sustainability of the NHS and Adult Social Care [Internet]. House of Lords; 2017. (publications.parliament.uk/pa/ld201617/ldselect/ldnhssus/151/151.pdf)
- Select Committee on the Long-term Sustainability of the NHS. Audit of Sixteen Public Bodies [Internet]. House of Lords. (www.parliament.uk/documents/lords-committees/NHS-Sustainability/Audit-of-Sixteen-Public-Bodies.pdf)
- Folan A, Laidler J, Holden T, Naylor C, Walsh R. “Council of the Year: The Wigan Deal is our social movement” [Internet]. Local Government Chronicle. 2019 [cited 30 May 2019]. (www.lgcplus.com/idea-exchange/council-of-the-year-the-wigan-deal-is-our-social-movement/7028545.article)
- Tameside Council, NHS Tameside and Glossop Clinical Commissioning Group, and NHS Tameside and Glossop Integrated Care Foundation Trust. Report to Strategic Commissioning Board [Internet]. 2018. (tameside.modern gov.co.uk/documents/s38886/ITEM%204a%20-%20Tameside%20Glossop%20Revenue%20 Monitoring%20Statement%20at%2031%20July%202018.pdf)
- Farenden J, Singh I. Local Health and Care Record Exemplars: A summary [Internet]. Local Government Association; 2019. (www.england.nhs.uk/publication/local-health-and-care-record-exemplars)