Executive summary: Next steps for social care funding reform
This paper pulls together new financial modelling, public perceptions work and policy analysis to identify the problems with adult social care in England and outline options for its reform. It does not aim to make firm proposals or recommendations but rather to identify and make explicit the advantages and disadvantages, impact and consequences of adopting one option over another. It concludes that reforming the current system will be expensive, but that if reform is chosen, England is now at a clear 'fork in the road' between a better means-tested system and one that is more like the NHS; free at the point of use for those who need it.
Current funding pressures
There has been concern about the system of publicly funded social care in England for more than 20 years. The report finds that additional revenue will need to be raised for adult social care services even without a major change in the model of delivery. Social care is facing high growth in demand, which is projected to rise by around £12bn by 2030/31, growing at an average rate of 3.7% a year. At the same time, we project growth in spending on social care of just 2.1% a year. This would leave a funding gap of £1.5bn in 2020/21 and £6bn by 2030/31, at current prices.
Alternative models
The paper models the costs of a number of options: maintaining the current system (at 2015/16 levels) and keeping pace with projected demand pressures until 2030/31; restoring the system to the level of quality and access that existed in 2009/10; introducing a ‘cap and floor’ model, similar to the Conservative Party proposals at the 2017 general election; and introducing free personal care (FPC), similar to the model in Scotland. The costs of these models are summarised in Table 1.
Table 1: Costs of alternative models for social care funding in England
|
Current system |
Reforms |
||||
|
Maintaining at 2015/16 levels |
Restoring to 2009/10 levels |
Cap and floor |
Free personal care |
||
|
2020/21 |
Projected cost pressures |
£21bn |
£27bn |
£25bn |
£26bn |
|
Increase from 2015/16 spend of £17.1bn |
£4bn |
£10bn |
£8bn |
£9bn |
|
|
Additional cost above maintaining 2015/16 |
N/A |
£6bn |
£4bn |
£6bn |
|
|
Projected funding available |
£19bn |
||||
|
Extra funding required |
£1.5bn |
£8bn |
£5bn |
£7bn |
|
|
2030/31 |
Projected cost pressures |
£29bn |
£39bn |
£35bn |
£37bn |
|
Increase from 2015/16 spend of £17.1bn |
£12bn |
£22bn |
£18bn |
£20bn |
|
|
Additional cost above maintaining 2015/16 |
N/A |
£9bn |
£6bn |
£8bn |
|
|
Projected funding available |
£23bn |
||||
|
Extra funding required |
£6bn |
£15bn |
£12bn |
£14bn |
|
Note: Cap and floor is a cap of £75,000 and a floor of £100,000. The actual level of the cap has not been specified and costs will depend greatly on this.
Retaining the current system would involve minimal disruption to the administrative system, compared with implementing a new model, and no transition costs. However, it would require additional funding. Simply maintaining 2015/16 levels would require an extra £1.5bn in 2020/21, rising to £6bn by 2030/31. However, this – or even more substantial levels of additional funding – would not fix problems including issues around complexity and fairness, nor would it protect people against catastrophic costs.
Major improvement under the current system, that is, returning to the level of quality and access observed in 2009/10, while meeting demand pressures since then, would require much greater levels of investment. Compared with our estimated budget rising by 2.1% a year, this option would increase the funding gap to £8bn in 2020/21, and £15bn in 2030/31.
The cap and floor offer prioritises protecting people from having to sell all their assets or facing catastrophic lifetime care costs. We estimate this would increase the estimated funding gap to £5bn in 2020/21 and £12bn in 2030/31. While being more generous as a whole, this option creates ‘winners and losers’ – more people would receive state-funded residential care but fewer would receive funding for domiciliary care.
Introducing free personal care for all older people with eligible needs would increase access to free care, and with it, remove one of the systematic barriers to integration with health. This would increase the estimated funding gap to £7bn in 2020/21 and £14bn in 2030/31. Though this is the more expensive of the two reform options, it is not more expensive than investing to restore access to levels seen in 2009/10.
Funding options
The additional funding required for all these models could be raised in various ways. For example, adding 1p to all rates of National Insurance (NI) by 2030/31 would raise enough to fund introducing the cap and floor model. Combined with the (problematic) option of means-testing winter fuel payments, this could be enough to introduce free personal care. Alternatively, adding 2p to all rates of income tax, or 3p to VAT, would be enough to improve access and quality close to the levels observed in 2009/10.
A rise in general taxation could be delivered through a hypothecated tax for social care. Our research into public attitudes indicated support for its perceived transparency but a key weakness is that any 'take' would rise and fall with the economy, rather than being aligned to changes in need or demand. Implementation would also be a major challenge.
A key question for government is whether, given the need for additional tax revenue will be required to protect the range and quality of care services, it is better to aim for a larger increase in taxation to be able to provide a superior model of care to those facing the burden of the cost. Then, if additional funding is raised, would this be more effectively used to increase access under the current system, or to change the system to address fundamental concerns over equity, complexity and/or protection from catastrophic costs?
Public perceptions and attitudes
The public has little understanding of how social care operates and even less understanding of how it is funded. Although some people have direct or indirect experience of arranging social care, this does not give them insight into the system as a whole.
Many people think the current funding system is more generous than it actually is, with many assuming social care will be free when they need it. Any proposed solution that is not free will be viewed negatively while this remains the case. When people are given more detailed information about how social care works, they recognise that there is a significant problem and believe the current system is not fit for purpose.
Most people in our deliberative events favoured the idea of the state having most responsibility for funding social care. The National Centre for Social Research's British Social Attitudes survey found that most people (55%) favoured options where responsibility was shared, namely ‘means tested’ (30%) and ‘means tested and capped’ (25%), whereas 41% favoured ‘the government (paid for by taxes)’.
To find and implement a solution to social care funding, public understanding needs to improve and awareness-raising measures must be part of any implementation. Mistrust of government, however, means a traditional education campaign is unlikely to be enough. Instead, a real social movement for social care is needed.
Policy implications
Sustaining the current system will be expensive. Wider reform might cost even more but may be better value.
‘Doing nothing’ is not a safe option and is no longer the easiest one. Demographic pressures, growing public concern and a system at ‘tipping point’ all mean action is politically essential.
To support reform, people need a better understanding of the problems, but politicians are not best placed to provide it. A coalition of organisations, with cross-party support where possible, is required.
* Numbers have been rounded to the nearest £1bn.
Section 1 – Introduction: What’s the problem with social care?
There has been concern about the system of publicly funded social care for more than 20 years. Then, as now, some people faced huge care costs. In 1997 the newly elected prime minister, Tony Blair, told the Labour Party conference: ‘I don’t want [our children] brought up in a country where the only way pensioners can get long-term care is by selling their home’. The incoming Labour government set up the Sutherland Commission, which reported two years later that ‘doing nothing’ was ‘not an option’ and recommended, among other measures, introducing free personal care. However, its recommendations were not unanimous (two commissioners issued a note of dissent) and in England the government decided the increased expenditure required would be too great. Scotland, by contrast, chose to use their newly acquired powers of devolution to introduce FPC for those with eligible need.
The current system in England provides public funding only to those with the greatest need and the lowest means. A person will not qualify for any level of public funding until their assets are below £23,250 and will not receive full funding until their assets are below £14,250. If someone requires care in a residential or nursing home, their assets are likely to include the value of their home (see the interim report, Approaches to social care funding, for more detail).
For those who do not receive fully funded care, private contributions to social care costs can take different forms. Most commonly, people (‘self-funders’) make payments to social care providers directly for the full costs of their care. There are few private insurance products available to people who might want to insure themselves against future care costs. The Dilnot Commission argued that a cap on costs was a necessary precondition for an insurance market to develop, but this has not been implemented despite being enacted in the 2014 Care Act. Social care remains one of the few uninsurable risks in our society.
Since 1998 there have been further green papers, white papers and other consultations, as well as five independent commissions, including one by Dame Judith Barker in 2014, commissioned by The King’s Fund. This called for reforms including free personal care at the highest levels of need, starting with critical needs, a single budget for health and care, and the end of the distinction between NHS continuing health care and social care. It proposed a range of measures to pay for this, including better targeting of universal benefits and new wealth taxes.
Even as these commissions have been reporting, long-term demographic trends that make them more and more urgent have continued to roll out. There are two complementary trends at work:
- the demographic ‘bulge’ of people – the baby boomer generation – born in the 20 or so years after the Second World War, who are now reaching retirement in the first decades of the 21st century;
- the increased longevity of that population, with life expectancy at birth now 79.5 years for men and 83.1 years for women.
As a consequence, the population aged 75 and over is projected to double in the next 30 years and the number of people aged over 85 in the UK is predicted to more than double in the next 23 years to over 3.4 million.
As the population ages, it is predicted that by 2030 there will be:
- 45% more people living with diabetes
- 50% more people living with arthritis, coronary heart disease or stroke
- 80% more people (nearly 2 million in total) living with dementia.
These population trends have important, well-reported, impacts on health and care demand. They have been exacerbated by related trends in working-age disability, with more disabled people surviving longer and the costs of their support increasing. As a result, social care for people of working age now costs local authorities about as much as that for older people.
But these trends have played out at a time of public spending austerity, with falling real-terms public spending on social care in particular. Between 2009/10 and 2015/16, spending by councils on social care per adult resident fell by 11% in real terms, and the number of people receiving publicly funded social care services fell by 400,000. These cuts compounded restrictions councils had already placed on publicly funded social care: in 2006, 53% of councils supported people with ‘moderate’ levels of need but by 2010 only 25% said they planned to do so in future.
Spending reductions have affected providers of social care services, with an increasing number of local authorities reporting suppliers handing back contracts. A recent report by the Competitions and Markets Authority said that ‘Many care homes, particularly those that are most reliant on local authority funded residents, are not currently in a sustainable position’. The workforce is also under pressure, with high vacancy and turnover rates in the social care sector. The Care Quality Commission, which regulates care providers, said in 2016 that the system was at ‘tipping point’ and in 2017 that it ‘remained precarious’.
Public concern is also increasing, at least in part because of several high-profile scandals involving abuse or neglect in the care of older people. The collapse of care home provider Southern Cross Healthcare in 2011 and the withdrawal from the publicly funded home care market of several major suppliers has also focused concern on the sustainability of the market for providing social care.
However, the ageing society is of concern not just because of current and expected demand for services, but also because it implies fewer working-age people paying tax to fund public services generally. The baby boomer generation is now retiring and there will be more of them and fewer people to support them in that retirement. In 2016, there were an estimated 308 people of pensionable age for every 1,000 working-age people. By 2037, this is projected to increase to 365 people.
Combined, these two trends – increasing demand for services and the increasing ‘dependency ratio’ – have focused attention not just on how we can develop a better, fairer social care funding system but also on how we can pay for it.
Attempts to resolve the issue have created controversy. During the 2010 election campaign, there was a heated debate over the Labour Party's consideration of a tax on people’s estates – a so-called ‘death tax’ – to pay for social care. The issue was then addressed by the 2011 Commission on Funding of Care and Support (Dilnot Commission), which proposed a reformed means test and a cap on the lifetime cost of care that a person might face. However, implentation of the legislation for this was first delayed and then postponed indefinitely. During the 2017 general election there was a negative response to Conservative Party proposals that would have made the system more generous for many people (including, as a late addition, by introducing a cap on costs) but recouped some of the public expense by requiring some people to pay more for care in their own home.
Pressures were recognised with new funding announced in the 2015 comprehensive spending review. This included a new ‘precept’ which allowed councils to add 2% onto council tax to pay for social care services, later raised to 3% for certain years. Additional funding from central government was also provided through the Improved Better Care Fund (IBCF). With later increases announced, this meant over £2bn of additional funding could be available in 2017/18, rising to £3.6bn by 2019/20, above what would have been spent (2018/19 prices). As a result, public spending on adult social care is expected to rise by an average of 2.5% a year between 2015/16 and 2019/20. However, this continues to lag behind growth in pressures, which are rising by at least 3.7% a year in real terms. Relying on the precept – and the move towards greater retention of business rates – also creates concerns about the level and equity of funding available for social care between different local authorities.
What the public thinks about social care
Previous research has found that public understanding of social care is often limited and there is a lack of clarity around the current offer. Those who have experience of using social care services, either for themselves or through friends and relatives, have more knowledge, but these services are not well understood. The deliberative work conducted by Ipsos MORI in 2008 to inform the green paper on care and support, Shaping the future of care together showed that many people often struggled to distinguish between social care and the health services provided by the NHS.
Recent polling conducted on behalf of Deloitte LLP showed that 63% of people think the NHS provides social care services for older people.
The lack of knowledge around social care is more pronounced when it comes to how social care is currently funded, coupled with a perceived lack of information available to people who want to start planning for future needs., Just under half (47%) of the public think social care is free at the point of need.
When it comes to planning for social care, few people have started saving for the care and support they may need in the future. Polling conducted on behalf of the Alzheimer’s Society showed that a quarter of people reported that they had started saving for the care and support they might need, but that nearly half of the population (47%) had not.
The literature review conducted on behalf of the Dilnot Commission points to a tension over people’s views of what they are responsible for when it comes to planning for old age. Most previous studies have found that people think responsibility for social care funding should either sit with the government through taxation, or should take the form of a partnership, with very few people thinking it should be solely the individual’s responsibility. When questions are framed in terms of ‘costs of retirement’, most people think it is their responsibility to plan for retirement, but this does not necessarily include social care. A recent report by Demos showed that more than half (57%) of the public agree that is their responsibility to save towards the costs they will face in retirement, but one in four still expect that social care costs will be met by the state.
The Ipsos MORI deliberative work in 2008 established that people were willing to see social care as a responsibility shared between themselves (and their families) and the state, but there has been persistent hostility towards using housing assets to pay for care.
Since the public has a limited understanding of social care, findings from survey research that examines their views needs to be interpreted carefully. However, it is clear that people’s perceptions of social care are broadly negative, which provides an important context for funding reform. Polling conducted on behalf of the Health Foundation in May 2017 found that only 8% of people thought the general standard of social care had improved over the previous year. Moreover, one in two people thought it would get worse over the next year. Overall, satisfaction with social care services was 23% in the British Social Attitudes survey in 2017, the lowest level recorded since the question was first asked in 2005, while dissatisfaction was 41%.
What next?
Despite previous controversy, the current minority Conservative government has pressed ahead with proposals for a green paper on social care funding before summer 2018. The momentum for action is being maintained by a wide-ranging group of providers, commissioners and users of social care services, along with journalists, opinion-formers and politicians from across the political spectrum. There is now even wider agreement than in 1999 that ‘doing nothing is not an option’.
What, though, is the best alternative to ‘doing nothing’? This report is structured around three linked pieces of work by the Health Foundation and The King’s Fund that looked at different aspects of that debate.
- The first, Approaches to social care funding, considered five approaches which were chosen in consultation with stakeholders to reflect the solutions most commonly raised in the debate (rather than being a comprehensive list of all possible models).
- The second, Social care funding options: How much and where from?, focused on funding and explored through financial modelling:
- the current and predicted future gap between spending and demand for social care
- the costs of restoring 2009/10 levels of access and quality, or introducing two of the five options (the ‘cap and floor’ model and free personal care)
- four options for raising money (taxing income across the general population, taxing higher earners, taxing or redirecting existing spend on older people and taxing wealth).
- The third looked at public attitudes to social care funding reform through a series of deliberative workshops and questions in the National Centre for Social Research's British Social Attitudes survey around perceptions of the current social care system and the priorities, principles and options for its reform.
In the next section of this overview report, we will revisit the analysis of the original funding options, drawing on the added financial analysis from the modelling paper. We then look at the results of the public attitudes work in greater depth. Finally, we draw out some of the key lessons and conclusions from all the relevant research.
As with each of the component parts, this overview report does not aim to make firm proposals or recommendations, but rather, to identify and make explicit the advantages and disadvantages, impact and consequences of adopting one option over another.
† Social care is the personal care and support required by some people because of needs arising from their age, illness, disability or other circumstances. Support is provided in residential and nursing homes, people’s own homes and in other community settings. See our interim report, Approaches to Social Care Funding, for more information. [Wenzel L, Bennett L, Bottery S, Murray R, Sahib B. Approaches to social care funding. London: The Health Foundation and The King’s Fund; 2018. Available from: www.health.org.uk/publication/approaches-social-carefunding (accessed 9 May 2018).]
Section 2 – Options for reform, their costs and considerations
All our policy, economic and public engagement work on this project has linked to exploring five approaches to funding social care for older people in England, which are discussed more fully in our interim report, Approaches to social care funding. They were chosen to reflect solutions commonly raised in the debate around social care funding:
- improving the current system
- introducing free personal care
- introducing a cap on costs and a revised ‘floor’ to the means test
- introducing a hypothecated tax for social care
- introducing a single budget for health and social care.
We are clear that these options are neither directly equivalent nor mutually exclusive, and that they tackle very different aspects of the social care funding challenge. They are also not an exhaustive list of the possible models that policymakers could consider.
So in this overview report, we review them by way of developing the discussion of some of the wider issues each raises, such as:
- the costs of improvement (or inaction) in the current system
- the nature of the ‘offer’ itself and issues of expanding access more widely
- social protection and fairness
- how funding could be raised for specific options.
While a joint health and social care budget might support progress towards more integrated care, it will not alone generate additional revenue for either health or social care, nor change eligibility for care. Therefore, we do not explore this option in detail in the costing analysis but do consider the issue of further integration between health and social care in the context of reform and public attitudes (see Approaches to social care funding for more on this option).
These options focus on changes to public provision of social care for older people. This reflects, among other factors, the reality that in general, working-age people who use social care services have very different financial characteristics to users aged 65 and older. For instance, there is far greater scope for funding older people’s social care by drawing on personal and property wealth than there is for funding working-age adults’ social care, where a fully tax-funded solution is likely to be the only appropriate approach.
This does not mean that services for working-age adults do not require attention, and indeed additional funding. In fact, the opposite is clearly true. However, as described in our interim report, we see no alternative to continuing a largely tax-funded option for providing care for younger adults, so have not explored alternatives. It remains vital that the social care system works for all adults with social care needs, and so our projection of the associated demand and costs for the future include spending on all adults, which changes when alternative approaches are applied to services for those aged 65 and older.
The pros and cons of the models are adapted from Approaches to social care funding.
All the financial figures in this section are drawn from the paper, Social care funding options: How much will they cost? and are based on data from the Personal Social Services Research Unit (PSSRU). The PSSRU projects that on current trends, social care spending pressures will rise at an average of 3.7% a year until 2030/31, compared with our projections that local authority spending would rise by just 2.1%. Unless stated otherwise, all figures in this section are expressed in 2018/19 prices, relate to England only and are rounded to whole billions of pounds where uncertainty makes a higher degree of accuracy spurious.
‘Improving’ the current system – and maintaining or restoring access
This option, as defined in Approaches to social care funding, would mean retaining the existing social care system but seeking incremental improvements over time.
There are several areas in which the government could make incremental improvements to the current system without changing legislation or large-scale reform. These could include financial support short of a new tax, perhaps directly increasing the amount of funding available through the improved Better Care Fund or the adult social care support grant, by allowing councils the freedom to raise additional income, or incentivising private funding. Other improvements might include expanding the eligibility for publicly funded care, improving integration with other services through sustainability and transformation partnerships and integrated care systems, and spreading innovation and best practice. The nature of the offer and who receives support could be addressed by revising either the means or needs tests. Options for improving the current system are discussed further in the interim report Approaches to social care funding.
We have not attempted to model a version of incremental change, as described in the interim report. Instead we have modelled two options at different ends of a scale to set out the funding that would be needed, from no change to the current system and keeping pace with pressures, to more widespread improvements to the system by returning to levels observed in 2009/10. By doing so we provide a range of costs that may occur for different levels of improvement.
Advantages/disadvantages
This approach would recognise the great difficulty successive governments have faced in achieving major reform. Compared with implementing a new model, it would also involve minimal disruption and minimal transition costs – though the existing funding gap and growing pressures will still need to be met. Making small improvements would not address many of the fundamental problems with the current system, including the downward trend in the number of people receiving care. Even substantial levels of new money would not fix the issues of the system’s complexity. Nor would it protect people against catastrophic care costs.
- Through its eligibility criteria, the current system aims to focus public resources for social care on those with the greatest needs and the lowest means. Yet the number of people receiving publicly funded care is declining, and there is evidence that the number of people with unmet care needs is growing. In addition, due to financial pressures on care providers, the rate paid by those who self-fund their care is likely to be higher than it is for those funded by their local council.
- Arguably, the current system has proved resilient to both growing and shrinking budgets due to the range of ‘levers’ (such as the means test thresholds), which enable local or national government to adjust the level of demand for funding.
- However, without reform, and even with significant investment, issues will remain over the system’s complexity, equity and failure to protect individuals against catastrophic costs without reform, even with significant investment. There is also a question as to whether recent (often short-term) efforts to address the shortfall in funding have been sufficient. In the case of the social care precept, for example, some councils’ reluctance to apply this, and the variation in the level raised between local authorities, means that many consider it unsustainable as a funding source. Councils’ other options for raising revenue locally are limited and many of the possible mechanisms, such as council tax increases, run the risk of exacerbating local variation.
- Issues around sustainability of funding also affect the stability of the social care provider market: this has been evident in councils reporting the handing back of contracts by both home and residential care providers.
To explore some of the costs inherent in any attempts to improve access to the system while not seeking to wholeheartedly reform it, two scenarios were modelled in the paper Social care funding options: How much will they cost?
- Maintaining the system at 2015/16 levels and keeping pace with pressures would require additional investment of £4bn more by 2020/21 than was spent in 2015/16. This is £1.5bn higher than our projection of additional spending by local authorities based on current trends. By 2030/31, an extra £12bn would need to be spent, £6bn higher than projected spending plans.
- Restoring the system to 2009/10 levels and restoring the level of eligibility that existed at that time (perhaps through changes in the eligibility criteria) would require an additional £8bn in 2020/21 above estimated plans. Projecting forward to 2030/31, the funding gap grows to £15bn.
These two modelled levels of funding, without change to the current system, provide estimates for a potential funding gap of between £1.5bn and £8bn in 2020/21 and between £6bn and £15bn in 2030/31, depending on various factors, but crucially, the level of quality and access desired.
The lower cost option, maintaining funding at 2015/16 levels, is simply in line with PSSRU projections of current provision. As such, it is not enough to lead to real improvement. This just stops the system declining any further, but does not address issues such as fewer people receiving care or market instability (although some level of improvement is possible through efficiency savings).
On the other hand, restoring funding to 2009/10 levels represents an upper estimate of the investment needed to restore services to the levels of access previously observed. This level of investment could indeed improve access and quality without primary legislation, but the major concerns over the design of the system even at that time, would go unresolved if this option was taken.
It is true that genuine efficiency gains will have been made since 2009/10, so the actual cost could be lower if these have been sustained.
Free personal care – broadening the offer
Free personal care has been offered in Scotland since 2002. Under this model in Scotland, personal care is provided to anyone aged over 65 based solely on need and not their ability to pay. Personal care includes personal hygiene, continence, diet, mobility, counselling, simple treatments and personal assistance. Those at critical or substantial risk to their independence or health and wellbeing are expected to be provided with social care services within a short period of time.
The approach is different depending on whether the individual receives personal care in their own home (domiciliary care) or in a care home:
- People receiving domiciliary care are not charged for any personal care services. The package offered varies on a case-by-case basis. According to free personal care data, net spending on domiciliary care services for older people in 2015/16 was £196 per week per user in 2018/19 terms: of this £161 was spent on free personal care.
- For people who receive care in a residential home, the local authority contributes to the cost of their personal care (at a flat rate) directly to the care provider. As of April 2015, this contribution is £171 for personal care, plus an additional £78 per week for nursing care services if needed. This payment does not cover accommodation costs, which are subject to a means test. This is currently mandated by the Scottish government, so cannot vary across different local authorities.
This system relates to the nature and scope of the government’s offer on entitlement for social care, but is not a means of generating funding.
Advantages/disadvantages
Free personal care would mean extending the government’s ‘offer’ on social care to more people. By aligning eligibility with health, free personal care would also remove one of the biggest national obstacles to integration of health and social care. However, given that this would require an increase in public spending, there is a question – as with all models – as to whether this would be the best use of additional funding for social care.
At current levels of eligibility, free personal care could require around an extra £6bn in 2020/21 and £8bn by 2030/31, compared with continuing levels of access and quality under the current system. This would increase the estimated funding gap to £7bn in 2020/21 and £14bn in 2030/31.
However, this funding would be used only to expand the number of people who could access publicly funded personal care by removing the means test from these services. It would not allow for any improvement in the needs threshold to expand access beyond those with severe need to include more people with high or moderate need, as would be possible in the scenario of returning to 2009/10 levels. If improving the needs threshold were also to be included, this would add considerably more to the total cost.
It is likely that, initially at least, the costs could be higher due to behavioural effects. In Scotland, introducing free personal care created unexpected levels of increased demand for domiciliary care which we might also expect to occur in England.
Table 2: Estimated number of people aged 65 and older receiving fully publicly funded care in 2015/16
|
Current system |
Free personal care |
|
|
Domiciliary care |
248,000 |
480,000 |
|
Residential care |
157,000 |
157,000 |
|
Total |
405,000 |
637,000 |
Note that the table uses ‘snapshot’ (on-a-given-day) data and numbers are accordingly lower than some ‘in-year’ figures reported elsewhere.
Indeed, local authorities in Scotland experienced a loss of income and an increase in costs when free personal care was introduced, and the system has become increasingly expensive over time. However, by supporting older people to live at home, helping to prevent costly hospital admissions, and delaying the need for residential care, the system may have resulted in lower total government expenditure as compared with no policy being in place.
The model has proved popular and durable in Scotland and is now being expanded to adults of working age. The number of people in receipt of personal care grew significantly once the policy was introduced, suggesting that the system is providing care for people whose needs were previously unmet.
The system also supports the longer-term vision for social care (and health) more broadly, by supporting older people to stay in their own homes. However, introducing free personal care also appears to have reduced the provision of care services which do not meet the narrow definition of personal care in fixed budgets, and charges have increased.
The ‘cap and floor’ option – protecting people from catastrophic costs
In the run-up to the 2017 general election, the Conservative Party proposed the following (in its election manifesto and through subsequent clarifications):
- Two changes to the means test for social care:
- replacing the existing upper and lower thresholds with a single threshold, set at £100,000, much higher than the current upper threshold (of £23,250), thereby abolishing tariff income and ensuring that users always retained at least £100,000 in assets
- including property assets in the means test for both residential and domiciliary care, rather than for residential care only, as is the case currently.
- A cap on the lifetime costs of care, meaning that no one would need to pay above a certain level. The level of the cap was not specified.
Advantages/disadvantages
The inclusion of a cap on care costs and the proposed changes to the means test are likely to mean a more generous system for some, offering protection against catastrophic care costs. This option constitutes a policy that has previously received some support from across the political spectrum. However, there is a question as to whether this alone is the best use of increased spending on social care, given the complex pattern of ‘winners’ and ‘losers’ (some of whom will make big gains).
In principle, a cap on care costs would protect people from very high costs of care. However, the extent of this protection (and naturally, the cost to the Treasury) would depend entirely on where the cap was set. Even with the introduction of a cap and a floor, many people would still be liable for relatively high costs – including all care which falls outside of needs eligibility.
There is a risk that including property in the means test for domiciliary care would reduce the incentive for people to remain in their homes (although it is difficult to predict how behaviours would change in practice). This may be seen by many as unhelpful, given that current health and care policy is aimed at supporting people to live independently, and avoiding the need for long-term care as far as possible.
Implementation of this system would be aided by the fact that some of the principles set out by the Dilnot Commission, such as a cap on costs, are already provided for through the 2014 Care Act. However, communicating this system – which has added complexity – to the public is likely to be difficult, given the limited understanding of the current system. It will, in practice, also be a very different system, with vast numbers of deferred payments perhaps becoming the norm.
Our analysis in Social care funding options: How much will they cost? shows that the ‘cap and floor’ model, with an assumed cap of £75,000, would cost an additional £4bn in 2020/21 and an extra £6bn in 2030/31 above the costs of maintaining the current model. Introducing this model could therefore increase the total projected funding gap against our estimated budget from £1.5bn to £5bn in 2020/21, and from £6bn to £12bn in 2030/31.
Our modelling shows that such a new system would make a saving on the public funding of domiciliary care (ie be less generous to users) because it includes individuals’ housing assets in the means test. However, it would cost considerably more (ie be more generous to users) for people needing residential care, as can be seen in Table 3.
Domiciliary care under this proposal will cost around £270m less than it does currently but costs for publicly funding residential care would double, from £3.4bn to £6.8bn. Note that, in our modelling, the costs of assessment are held constant, although system change will likely incur some implementation costs.
Table 3: Estimated number of people aged 65 and older receiving fully publicly funded care in 2015/16
|
Current system |
Cap and floor |
|
|
Domiciliary care |
248,000 |
166,000 |
|
Residential care |
157,000 |
280,000 |
|
Total |
405,000 |
446,000 |
Note that the table uses ‘snapshot’ (on-a-given-day) data and numbers are accordingly lower than some ‘in-year’ figures reported elsewhere.
As this offer is more generous to potential residential care users, there is a risk that it could create additional demand for residential care versus domiciliary care, running contrary to the long-term strategic direction of most local authorities.
Summary of costs
The costs of all options are summarised in Table 4.
Table 4: Summary of costs for the cap and floor model and free personal care alongside additional costs for maintaining and improving access and/or quality of current system
|
Current system |
Reforms |
||||
|
Maintaining at 2015/16 levels |
Restoring to 2009/10 levels |
Cap and Floor |
Free personal care |
||
|
2020/21 |
Projected cost pressures |
£21bn |
£27bn |
£25bn |
£26bn |
|
Increase from 2015/16 spend of £17.1bn |
£4bn |
£10bn |
£8bn |
£9bn |
|
|
Additional cost above maintaining 2015/16 |
N/A |
£6bn |
£4bn |
£6bn |
|
|
Projected funding available |
£19bn |
||||
|
Extra funding required |
£1.5bn |
£8bn |
£5bn |
£7bn |
|
|
2030/31 |
Projected cost pressures |
£29bn |
£39bn |
£35bn |
£37bn |
|
Increase from 2015/16 spend of £17.1bn |
£12bn |
£21bn |
£18bn |
£20bn |
|
|
Additional cost above maintaining 2015/16 |
N/A |
£9bn |
£6bn |
£8bn |
|
|
Projected funding available |
£23bn |
||||
|
Extra funding required |
£6bn |
£15bn |
£12bn |
£14bn |
|
Figure 1: Costs for the cap and floor model and free personal care alongside additional costs for maintaining and improving access to and/or quality of current system
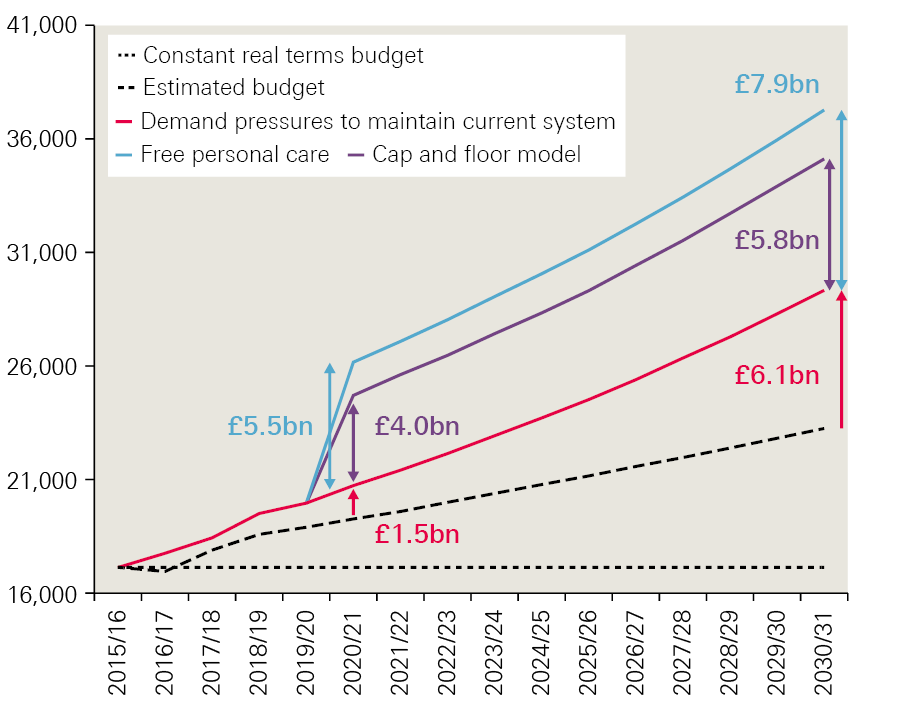
How to raise the funding needed
In the previous section, we showed that any option that avoids further decline in access and quality will require additional investment, which in turn will require additional taxation or change to current benefits. By 2030/31, even maintaining the current system would require an additional £6bn above estimated spending. Improving access to similar levels achieved previously under the current system (ie 2009/10 levels) would be the most expensive option, requiring an extra £15bn by 2030/31. Improving access by introducing free personal care would need an extra £14bn, while protecting against catastrophic costs would need an extra £12bn.
How these sums are funded depends on several trade-offs regarding the amount required and how it is to be raised, including:
- the balance between protecting those with the lowest personal resources and protecting people from catastrophic costs
- the relative contributions of working-age and older people towards paying for care
- whether funding is raised against people’s income or their wealth.
The analysis in the paper Social care funding options: How much and where from? sets these out in detail (summarised here), including the amount that can be raised through current taxation (Table 4).
At least some of the additional funding required could theoretically be found from other areas of public spending or additional borrowing. But with other services already facing further cuts, and the government's commitment to reducing the national budget deficit, the scope for additional social care spending without the government raising additional tax revenue is very limited.
Increasing general taxation (including taxing the wealthy)
Adding 1p to the main rate, higher rate and employers’ contribution to NI by 2030/31 could raise enough to fund the introduction of the cap and floor model. If, at the same time, means testing was introduced for winter fuel payments, this could be enough to introduce free personal care.
Alternatively, adding 2p to the basic, higher and top levels of income tax, or 3p to VAT, would provide more than enough to fund either the cap and floor or free personal care, and would be sufficient to improve access and quality close to the levels observed in 2009/10.
A different approach favoured by some is to limit tax increases to those earning the highest incomes, by increasing only the top and higher rate of income tax. This approach would be progressive in nature but would require substantial increases in the rate. For example, just funding the current projected pressures would require a 3p increase in the higher rate of income tax, or 6p in the top rate in 2030/31.
Improving access back to levels observed in 2009/10 would require a 9p increase in the higher rate of income tax, or 17p in the top rate in 2030/31. Introducing the cap and floor model would require an extra 8p or 16p in the pound respectively, and for free personal care an extra 7p or 16p. It should also be noted that there is a significant risk that a rise of this magnitude would not in fact generate the expected level of income as the fnanical behaviour of the highest earners might well change in response to the planned tax increases.
This would also increase the burden placed on a very small portion of the population. Currently the top 1% of earners pay around 28% of total income tax, and households earning the top 10% of incomes pay around 27% of total taxes.
Taxing or redirecting spending on older people
These approaches raise concerns about intergenerational fairness – taxing (via NI) lower income families to provide free services to wealthy older people looks regressive. A common argument for how to raise funding for social care is that as older people are the greater benefactors of an improved care system, they should contribute towards funding any improvement to the model.
For example, linking the winter fuel payment to Pension Credit could make an additional £1.8bn available for social care services but is potentially a regressive option, given the high rate of eligible poorer pensioners who do not claim Pension Credit.
Table 5: Estimated revenue raised from a 1 percentage point increase to key tax rates (England's share of additional tax revenue)
|
Policies |
2020/21 (£bn) England |
2030/31 (£bn) England |
||
|
Tax type |
Detail |
Source |
(2018/19 terms) |
(2018/19 terms) |
|
Income tax |
Basic |
IPPR model |
3.8 |
5.1 |
|
Higher |
IPPR model |
1.3 |
1.8 |
|
|
Top rate |
IPPR model |
0.4 |
0.9 |
|
|
Fiscal drag (no uprating) |
IPPR model |
6.8 |
N/A |
|
|
NI contributions |
All rates (employee and employers) |
IPPR model |
9.1 |
12 |
|
Extend beyond retirement age |
IPPR model |
1 |
1 |
|
|
VAT |
Main rate |
HMT |
5 |
5.2 |
Note: IPPR: Institute for Public Policy Research.
Another option is extending NI contributions beyond retirement age, given the large growth in the number of people working beyond retirement age. At current levels this could raise a further £1bn. However, care should be taken with this option; the Mirrlees Review of the tax system argued that we should be looking to strengthen work incentives at older ages, not weaken them, as older people are particularly responsive to incentives. Therefore, one option would be to introduce a lower rate of NI contributions for this group, for example the 6% rate recommended by the Barker Commission.
A move to a ‘double-lock’ pension was initially proposed in the Conservative Party manifesto but the amount released would also depend on the outlook for wages growth. In reality, it is rare for both average earnings and inflation to be below 2.5%, so this might do little to change the projected long-run generosity of the state pension.
This approach might close the funding gap under the current system but on its own would not provide enough additional funding for either of the alternative models of reform explored. It would therefore need to be part of a wider solution.
Taxing wealth
There is mounting interest in moving the balance of the UK tax burden away from income towards accumulated personal household wealth, the estimated scale of which, at £12tn, makes it an option which is impossible to ignore. Inheritance tax receipts have been rising in recent years (and were identified in the 2015 Spending Review as a potential source of funds for Dilnot reforms).
A reform along these lines was proposed by the then Health Secretary Andy Burnham in 2010: this ‘care duty’ could raise something in the order of £6.5bn. This would make a significant contribution towards funding improved care in the short term, but implications for long-term funding will depend on factors such as changes in the property market.
Other proposals include changes to council tax beyond the social care precept such as an additional council tax band. The Resolution Foundation proposed that a 1% tax on the value of properties above £100,000 could potentially raise £9bn in revenue. This would therefore cover the cost of each of the options modelled in 2020/21.
Wealth taxes such as these are generally seen as progressive options (or at worst proportional). Clearly, options exist that could fund at least part of an improved social care system. However, they can prove controversial, as many people’s homes have risen dramatically in value while their incomes have not. Equally, introducing the value of property into the means test for domiciliary care in the cap and floor proposal could also be argued to be a form of tax on property.
Introducing a hypothecated social care tax
A hypothecated tax has been often suggested in the context of health and social care. However, this would only raise funding if it were set at a level that would increase the total national tax revenue in the manner illustrated above for general tax rises. As such, it is a method for raising revenue rather than a new source of funding in itself. Ensuring that tax raised is used for a specific purpose helps clarify the link between taxation and government spending, and can increase a sense of accountability – although in practice, this would depend on the form of hypothecation (full, partial or ‘soft’):
- full hypothecation, where spending is linked directly to revenue raised – all funding for social care would come from a clearly identified source and could be used only for social care (countries such as Germany fund social care in a similar way through social insurance schemes, but in England, which has no history of social insurance models, this is more likely to be a specific tax)
- partial or incremental hypothecation, where revenue from tax increases is used to raise spending, but most funding for social care comes from other sources and is not hypothecated
- soft hypothecation: a rise in tax is symbolically linked to a purpose, but in practice the take is not ring-fenced for that purpose (for example, the Labour government’s 2002 increase in NI to ‘pay’ for extra NHS spending).
Advantages/disadvantages
The potential revenue raised would depend on the form of tax increase. In any case, it would be likely to require very substantial tax increases to bring about improvements (and to be worth the upheaval).
Implementation would be a major issue. A hypothecated tax for social care would be a major change from the current system of public finance in the UK. Many of the countries that have introduced social insurance have been able to build on established insurance schemes, often in health.
Public acceptability is often considered the primary strength of hypothecation, as raising public awareness of debates around available funding and trade-offs in service delivery may offer the best chance of building public support for raising additional funding. This is discussed further in Section 3 on public attitudes.
A key weakness of a hypothecated tax is that any ‘take’ will rise and fall with the economy, rather than being aligned to changes in need or demand. In practice, social insurance systems have often required a ‘stabilisation fund’, which is paid into when the economy is stronger, to provide additional support in a downturn. While this can smooth over the impact of economic boom and bust, it also weakens the short-term link between taxation and spending.
Introducing a hypothecated tax for social care alone would risk exacerbating the separation between the health and social care systems. Conversely, a social care and health hypothecated tax would be a huge undertaking which risks leaving social care as the poor neighbour.
‡ This is based on current spending plans for adult social care to 2017/18, expected local authority spending power to 2019/20, and then assuming spending would rise in line with GDP beyond 2019/20 in line with Office for Budget Responsibility methodology. In reality it will depend heavily on the shift among local authorities towards greater retention of business rates, which we do not attempt to model here.
§ These updated projections for pressures are lower than previously reported (see: www.pssru.ac.uk/pub/DP2900.pdf) and those used in our previous reports (see: www.health.org.uk/publication/autumn-budget). This reflects a number of changes, including fewer people currently receiving services, lower estimates of population growth, and lower projected growth in national wealth (measured using GDP). See accompanying report Social care funding options: How much will they cost? for more information.
¶ The Scottish government calls this ‘free personal and nursing care’.
** Excluding client contribution included in gross spending.
†† Under the current system, people contribute a percentage of the costs of their care if they have assets between the upper and lower thresholds.
‡‡ Figures do not sum due to rounding, specifically when comparing free personal care and cap and floor models. Figures are rounded for ease of reading and to reflect uncertainty in the estimate.
§§ The estimates provided here do not include any behavioural effects due to changes in taxes, so represent the upper bounds for the revenue that would be raised. For example, increases in income tax may discourage some people from working, reducing the overall revenue raised.
Section 3 – Public attitudes to social care funding reform
This section reflects on the findings from research into public attitudes that ran alongside our joint Health Foundation and King’s Fund analysis of funding options for social care. The research aimed to explore the public’s knowledge and experience of social care in general, but also how people responded to the options we put forward, and what values and beliefs were brought into play as they reacted.
The section draws on two sources of primary research: qualitative work with the public and questions asked in the most recent British Social Attitudes Survey.
Qualitative element
Ipsos MORI was commissioned to conduct the qualitative element. The study used reconvened deliberative workshops and in-depth interviews to explore experiences and priorities among the public and users of social care. We wanted to explore current levels of understanding and reactions to the current funding model before testing possible future funding options. Deliberative events are a method well suited to moving people through a process of information-giving, allowing the time and space for participants to digest and reflect on stimulus materials. This provides an opportunity to reflect on complex issues like social care funding, though efforts should be made to draw conclusions for the wider population who have not been through such a process.
Two day-long workshops were held in three different locations in England: London, Leeds and King’s Lynn between January and February 2018, attended by 116 people. The workshops in each location were held three weeks apart, and the same groups attended on both days. The groups were mixed in terms of age, gender, social background and ethnicity.
Quantitative element
We also commissioned four questions on social care in the 2017 British Social Attitudes Survey. Since 1983, NatCen’s Social Research British Social Attitudes Survey has asked members of the public about their views and feelings on a range of issues and policy areas, including the NHS and social care.
The latest survey was carried out between July and October 2017 and asked a nationally representative sample of 3,004 adults in England, Scotland and Wales their views on social care funding. In the analysis that follows, the differences highlighted are statistically significant at the 95% level unless otherwise stated.
What we learnt from this work
1. The public has limited knowledge of what social care is
It is clear from the 2018 deliberative events that public understanding of social care remains limited, although there are signs that awareness has increased since 2008. Participants in the deliberative events were able to categorise in very general terms what sorts of services would be provided by social care and what were more likely to be health, but there were still many grey areas. People were much less clear on how to access social care and how services are managed. Many participants assumed their GP was the entry point to the system. Local authorities were rarely mentioned spontaneously as having a role in providing social care.
It might be expected that direct experience of social care would lead to greater knowledge. To some extent this was the case. However, even those people who had experience of social care, either personally or through friends and family, were not confident about their understanding of the wider system. Rather, the experiences cited were very individual accounts of seeking care and support. People described how hard it was to navigate the system and the frustration faced in getting through the bureaucracy involved in accessing care.
The biggest thing I found is no one seems to know where to get help. Not knowing where to go, or who to get advice from, to get everything started. There doesn’t seem to be any one place.
Leeds, Workshop 2
What does seem to have filtered through to public awareness is negative media coverage of social care services. People mentioned reports of abuse and neglect in care homes, which were often attributed to perceptions that the workforce were both low-skilled and low-paid. Participants also referred to media stories about the underfunding of the social care system.
A system under stress. Money isn’t being made available by the government, so less people have got to do more work.
King’s Lynn, Workshop 1
You only hear negative things, like people abused in care.
Leeds, Workshop 2
2. The public has even less knowledge of how social care is funded.
While there was some, albeit limited, understanding of what social care is, there was very low awareness of how social care is currently funded. Most people, particularly those who had little or no personal experience of social care, thought it was funded in a similar way to the NHS (ie through tax revenues, and free at the point of need) or that they would be able to draw on an entitlement based on NI contributions. They also assume that state-funded care would be provided to most people, with government paying for at least some, or even all, of the care people need.
Personal experience of accessing social care, either directly or on behalf of a family member, brings more knowledge of funding, but within limits. In the deliberative events, people with experience were well informed in relation to their own circumstances, but were often unsure of, for example, what the financial threshold for eligibility was. Although some had experience of their assets, including housing, being used for payment, people’s accounts were often more dominated by the pressures of arranging care, often at moments of crisis, and relief when care was put in place. They were less able to provide an overview of how the system is funded.
The British Social Attitudes Survey asked people who they think currently pays for social care (defined as needing regular help looking after oneself because of illness, disability or old age. This can include help with getting washed, dressed, preparing meals, or care in a nursing home.) The findings reflect what people told us in the deliberative events: there is no clear understanding of how social care is currently funded. A third (34%) say the government currently pays for care, while 12% say the individual pays. Just over half (51%) gave answers that reflect a belief that costs are shared between the government and the individual.
Figure 2: Perceptions of who currently pays for care, from the British Social Attitudes Survey
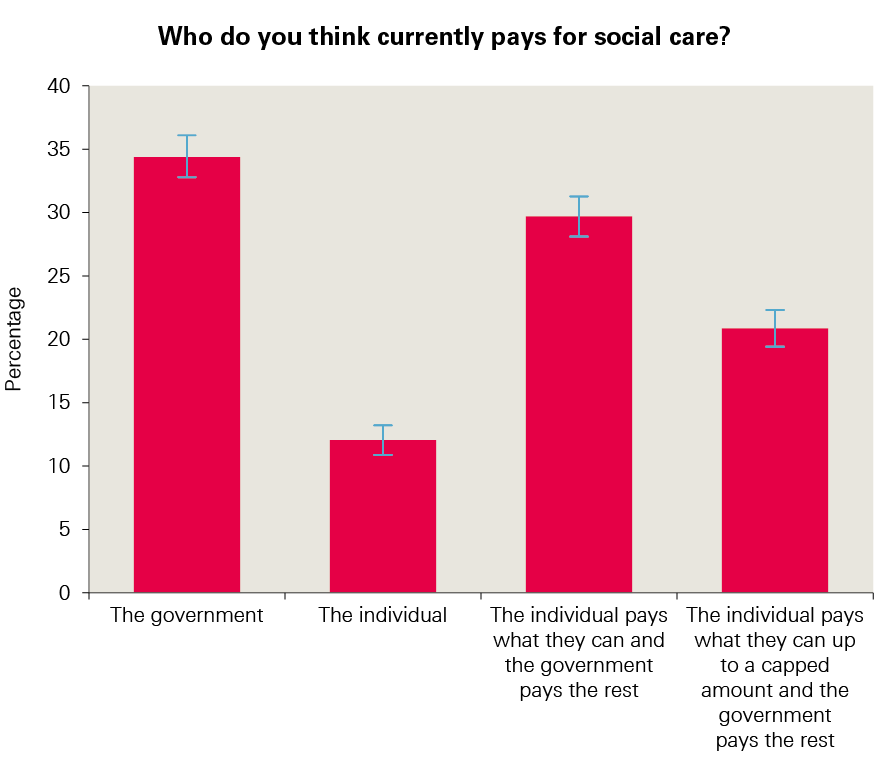
Source: National Centre for Social Research’s British Social Attitudes survey, 2017
As noted, when reviewing quantitative survey questions asking about social care, we should take into account the lack of understanding in this area. Quantitative views held about the current system need to be interpreted through our qualitative understanding of public attitudes.
Box 2: Analysis: overall perceptions of social care
It is easy to see why efforts to reform social care have repeatedly hit a stumbling block when it comes to communicating with the public. For people to show support for a solution to a problem, they first need to see it as a problem, and at the moment this is happening only in a limited way.
Although some people have direct or indirect experience of arranging social care, we found that their experience does not give them insight into the system as a whole. Furthermore, the realities of navigating a complex and bureaucratic structure at a time of personal crisis are overwhelming.
That being said, the results of the British Social Attitudes survey in 2017 showed the lowest level of satisfaction with social care (23%) since the question was first asked in 2005. The deliberative events demonstrated that while knowledge of social care was low, there was an emerging sense that there are mounting problems with social care around funding, workforce and the level of care provided.
3. When informed, people think the current funding model needs to change
The reaction to the current funding model was unanimously negative. People were often shocked when the details of the means test were explained to them. The financial threshold was seen as very low and many people were unfamiliar with the idea that housing assets might be included in the assessment. The suggestion that housing would be taken into account provoked particularly strong negative emotions.
When people were taken through the system as it exists today, there was sometimes a sense of anger as people realised their assumptions that their care would be paid for by lifelong tax and NI contributions were clearly wrong.
There was a strong feeling that what is currently in place is not fit for purpose and needs to change. The reaction led many to feel concerned for how they or their loved ones would be provided for in later life.
Exposure to details of the current model led many to question why so little was understood about social care, why existing information on the system is hard to access and, where it does exist, why it is confusing and unclear.
Box 3: Analysis: perceptions of the problem and potential solutions
The deliberative events demonstrated that when people are given further information about social care, they recognise there is a significant problem and believe the current funding system is not fit for purpose.
However, currently a large proportion of the public assume social care will be free at the point of need, paid for by government through taxes and NI. It is unsurprising, then, that new proposals that may involve increased contributions from individuals are seen in a negative light, even if objectively they are more generous than the actual current model.
This is important and in part explains the reaction to the proposals outlined in the Conservative Party manifesto of 2017. While the manifesto pledges were in fact more generous than the current system, it could be argued they would not be seen as such if people think social care is currently free or at least heavily subsidised.
Any potential solution has to be seen as an improvement, but this will only be possible if people understand what is already in place, rather than thinking that the system will be free at the point of need or at least subsidised more significantly than it currently is.
This raises a significant question about how wider knowledge and awareness can be raised and, perhaps more importantly, who should be leading any wider public engagement. It was clear from the deliberative events that trust in government was at a low ebb, not least on this issue. At the same time, participants struggled to identify who they would trust to lead engagement on social care.
4. Underlying public beliefs about the role of government and fairness need to be recognised
Two areas of people’s underlying values and beliefs strongly shaped attitudes towards alternative funding models, namely beliefs about the role of government and how the concept of fairness was understood.
Views on the role of government as a vehicle for resolving the failures of the current system revealed a paradox. On the one hand, there was agreement that the system was not working and government needed to take a leading role in fixing it. On the other hand, some people were not convinced that government was capable of providing a lasting solution to the problem and did not trust them to do so.
As can be seen from Figure 3, most people favoured the idea of the state having most responsibility for funding social care, placing themselves on the ‘state pays’ and ‘state pays with some contribution’ end of a spectrum that has individual responsibility at the other end.
The findings of the deliberative work reflect the findings of the British Social Attitudes Survey. The state paying for everything was also favoured by a significant proportion of respondents to the British Social Attitudes Survey: 41% opted for ‘the government, paid for by taxes’ and 2% chose ‘the individual’ (Figure 4).
Figure 3: Perceptions on the balance of responsibility, from the IpsosMORI workshops
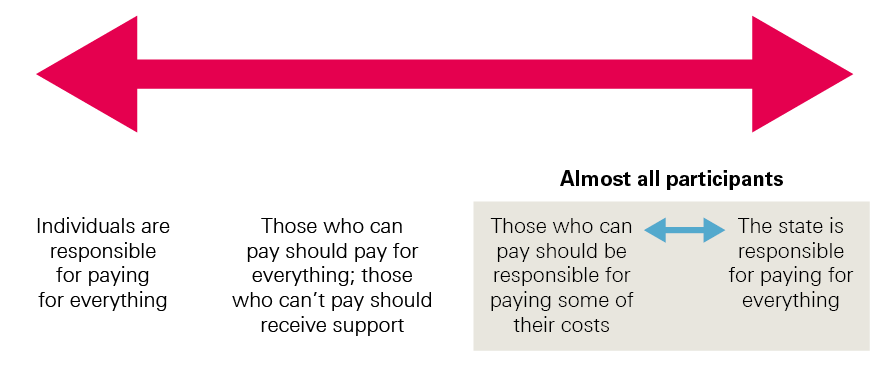
Figure 4: Perceptions of who respondents think should pay for social care, from the British Social Attitudes Survey
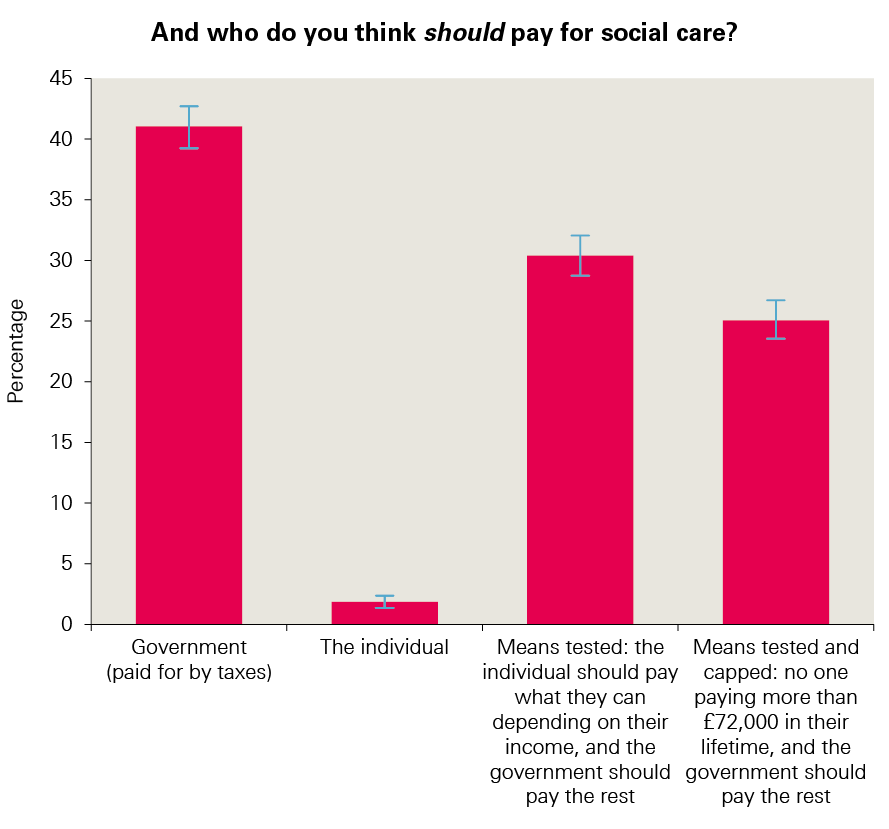
Source: National Centre for Social Research’s British Social Attitudes survey, 2017
Most people (55%) favoured options where responsibility was shared, namely ‘means tested’ (30%) and ‘means tested and capped’ (25%).
But these views about the important role of government in both fixing and funding social care often coexisted with doubt about government’s capacity and trustworthiness to do so. People were concerned that any funding solution needed to endure for decades to come and should be protected from the pursuit of short-term political goals.
Throughout the deliberative events, people often spoke about setting up an independent body, either in relation to deciding on the right funding levels or to actually administer social care spending. Allied to this was a preference for a dedicated tax, which emerged repeatedly, even before being discussed as one of the options (see below). Such a tax was seen as transparent and would allow people to see where their money was going. There was also a sense that a dedicated tax would stop the money being diverted to areas of government spending that were seen by some as less important, for example foreign aid.
Housing wealth
A major factor that powerfully shaped attitudes was people’s attachment to their homes as a dominant dimension of fairness. This included the idea of home ownership and the hard, lifelong work that homes represented for most people, so that even those who did not own a home wanted to protect those who did. People felt that it was very unfair for government to take into account the value of their homes under the existing model. Even after being exposed to the scale of the future funding pressures, most were still hostile to the idea.
Just forget about touching people’s houses. That should be a principle. Just get rid of that rule. Take peoples’ houses out of it. You work for that. It’s for generations to come. It’s yours. You can find other ways of raising money, and leave people’s houses out of it.
Leeds, Workshop 2
Behind this view was a conviction that people had worked hard for their homes and had the right to dispose of them as they saw fit. Moreover, there was a view that home ownership had been actively encouraged by government and that any move to include houses in the assessment of assets went against what people had been advised to do.
We’ve all had to sacrifice something to get something. I sacrificed a lot to get a house, so why should I now, as an older woman, lose my home?
Leeds, Workshop 2
There was also a question mark over how regional differences in house prices might be taken into account, as can be seen below in reactions to the cap and floor model.
There were mixed views on whether or not wealthier people should be responsible for paying for their own care. There was broad agreement that ‘very wealthy’ individuals should be, but less consensus on who these people are and how a means-tested system should be set up.
While the use of people’s housing assets dominated concepts of fairness, a few other dimensions were explored. Views included the idea of a basic package for all (with the freedom to top up for those with the means), to accepting that means testing is inevitable, but with much more generous thresholds than at present.
On the question of fairness between generations, most people understood that social care reform might disproportionately benefit older generations. However, they saw this as a consequence of being fair to older generations in a different way – recognising they had already ‘paid in’ to the system – and because they wanted to protect housing assets. These two latter types of fairness overrode the notion of fairness to younger generations, partly because they were seen to have more time to adjust to the idea and partly because ‘we have to start somewhere’.
Although people recognised that younger generations faced financial challenges, this was balanced by a strong sense that it is important to be fair to older generations.
How else can you do it? Older people will have paid for somebody else? It’s like with your children. It’s rolling over. They work, contribute, pay taxes. It’s how we evolve as a society. My children will pay for other people.
London, Workshop 2
That’s how society works. For the greater good and all. When young people get older, they are going to be in the same position as the older people. It just goes around and around.
London, Workshop 2
We have done our share. Now it’s down to the next generation.
King’s Lynn, Workshop 2
Box 4: Analysis: perceptions around funding
The strength of people’s attachment to their homes seems to trump any attempts to solve social care problems by an appeal to intergenerational fairness by including housing wealth – wealth that is largely held by older generations. It was striking that the public, in these deliberative events, did not buy arguments that a solution that spared the use of housing assets among the current older generation would be unfair to the younger generations. Or if they did, they thought that it was more important to be fair to people who had ’paid in‘ all their lives and worked hard to buy their houses.
However clear the potential intergenerational unfairness may seem to those working in policy circles – for example, the growing disparity in home-owning status between generations – it would seem that solutions that try to mitigate the divide in intergenerational wealth might have limited traction with the public, at least at the moment.
What did seem apparent from this work, even among younger people, was a sense that it was important to be fair to older generations who have paid in all their lives and thought their social care needs would be met through their tax and NI contributions over many years. It is likely that people’s experience of living in families that span generations is a more constructive frame on which to build.
5. Public responses to the alternative funding options
Continuing with the current system
The sample of the public in our deliberative work fairly quickly reached the view that the current system needed to change for the reasons outlined here, including hostility to the use of housing assets to pay for care and unrealistically low thresholds for state help. The perception that the current system failed to deliver quality care was also a concern for some participants, and was seen as another reason it needed to change. These views were influenced by media stories reporting abusive care homes, or personal experiences of friends and relatives receiving care that was perceived as low quality, including short visits from carers.
The current system doesn’t work. It’s going to continue to get worse. The funding is not enough for the level of care that’s needed. I often wonder how seriously the government is thinking properly about this.
King’s Lynn, Workshop 2
Changes to the cap and floor system
People found these changes complicated and difficult to understand, even after considerable discussion of how they might work. They were seen, nevertheless, as an improvement on the current model, offering greater certainty about costs, and a guarantee of some assets to pass on to family. However, it is important to note that while perceived as improvements, they were not viewed positively, and the difficulty in understanding how the changes might work should not be underestimated.
It is confusing. I understand it, but we’ve probably got different interpretations.
King’s Lynn, Workshop 2
I disagree with the fundamentals, but I think if you’re going to have a system with a cap, it does lead to some certainty, compared to where things are at the moment.
London, Workshop 2
As before, many participants were reluctant to consider using housing assets, or suggested alternative ways of calculating the cap based on region. This was because there was concern that this option did not take into account differences in house prices across the country and could more negatively impact some groups of people.
You can’t even get help in your own house without that property being included. If you have an expensive property, you could forever be having to pay for it yourself. You have to sell the house.
King’s Lynn, Workshop 2
I think it should be a percentage rather than an absolute number. If you have a house of a million pounds you’d lose an awful lot of money.
Leeds, Workshop 2
It depends where you live. My friends have sold their house in Leeds to go to Huddersfield and pay it off, because the standard of property in Leeds is higher. It’s not a national system – you’re subject to the variations of the housing market. In Burnley and Bolton it’s £45,000 for an average house.Leeds, Workshop 2
Linked to this, people were also concerned about regional differences in the cost of care. People worried that those living in areas where care was more expensive might reach the cap sooner than in other areas. Again, participants felt that the model should be proportionate to the value of the home, rather than a single capped amount.
We talked about how different regions have different assets. What if the cap was in correlation to where you are living?
London, Workshop 2
I think you’re going to have to do it on a percentage of the value of the property, not the set value of £100,000.
King’s Lynn, Workshop 2
Free personal care
This option was relatively well received, although there was wariness about how much it might cost. People liked it because it did not discriminate against those who had saved, while offering some level of security to everyone. Some also felt it would enable older people to be independent and stay in their own homes for longer. In addition to worries about how much this might cost (and whether it would be at the expense of other areas of government spending), participants were also aware that setting the needs threshold might not be straightforward, and that some people just below the threshold might lose out.
In principle I like it because you don’t discriminate against people who have saved.
London, Workshop 2
I think it’s an improvement. It’s simple, and it’s for everybody, and it’s a basic level.
Leeds, Worksop 2
If everyone qualifies for it, the assessment will be stricter. There will be a grey area of knowing you need it, but they say you don’t because they can only afford a certain amount.
London, Workshop 2
A dedicated social care tax
This option also struck a chord with many participants, and the idea of raising taxes was referred to throughout the workshops. Many people decided early on in the deliberative process that increased taxes would be necessary and some even suggested an approach that had features of a dedicated tax.
A dedicated tax was seen as a way of ensuring that government would be accountable for the money going to social care rather than other areas of government spending. This option was favoured because it fitted in with people’s concerns around fairness and also mitigated the lack of trust in government.
The only reason we’re looking at ring-fencing is because the government’s got a bad track record. So, we don’t trust them to put so much into social care. It needs to be outlined from the start.
King’s Lynn, Workshop 2
Reducing flexibility of how government spend the money is an advantage.
Leeds, Workshop 2
I like the idea because you are paying straight out your wage and you know that you are covered.
London, Workshop 2
Over the course of the workshops, discussions around taxation frequently focused on the benefits and value of knowing how much and where money was being spent. A key concern for participants was how the money raised through one tax (eg road tax) was being spent to fund other services (eg education). They wanted the new system of social care funding to provide a guarantee that the money raised for social care would be spent on social care. Participants also felt that a dedicated tax would provide greater security that social care provision would be there for people who need it. It was also preferred because it was a solution that did not target housing assets.
If you asked people whether they would pay two extra pence on income tax rather than take away assets later on they would choose the former. But I have no confidence the government will use the money appropriately.
Leeds, Workshop 2
Overall, participants argued that ring-fencing money specifically for social care would also make increasing tax more palatable to the public, if announcement of the new tax was combined with a campaign to raise awareness about the challenges facing social care. The discussion also opened broader questions about whether other areas of government spending should adopt this model.
I think [a dedicated tax] is an opportunity to look at in the NHS.
King’s Lynn, Workshop 2
Nevertheless, others were sceptical that such an approach would be resilient and sustainable, particularly if there was a recession and revenue from taxes fell. There was also a concern that a dedicated tax might not raise the money that is needed to improve social care services.
It says dedicated tax. No money could be spent elsewhere. Does that mean no money could be coming in from elsewhere? What if there were mass unemployment?
Leeds, Workshop 2
Of course, I disagree with it. It’s crazy. Say, you’ve got your income, in your home. You ring fence this amount for this, and you’ve got ‘X’ amount left for your car. Then your car breaks down and you can’t get it repaired, because you’ve got this money ring-fenced.
Leeds, Workshop 2
If there are fewer younger workers, there won’t be enough to cover the costs, or do they raise the tax even more?
London, Workshop 2
A joint social care and NHS budget
This was also an appealing option to many people, because they saw the two services as closely linked or overlapping in some instances. There was a sense that this solution might reduce some of the pressures that both sectors face and improve services for patients or care users because it might lead to improved coordination. An example raised was that individuals might receive social care earlier preventing them from needing to go into hospital.
So many beds are taken up by people who need to be taken care of by social care because there’s nowhere else for them to go. If it was overseen by one organisation who looked at the bigger picture, it might help.
London, Workshop 2
I somehow see that social care is part of the NHS. It is part of the nation’s health. Why does it have to be two separate units?
King’s Lynn, Workshop 2
There needs to be better integration between the two. If you’ve got a pensioner who’s in bed in hospital but is well enough to go to a nursing home, if the problem is in-between then that can be worked out.
London, Workshop 2
But there were also those who were worried about this option. People argued that as the NHS was also under financial pressure, there would be tension between the two services and a risk that health would win out over social care.
If it comes down to saving a sick child or an elderly person who might not last another couple of years, where will the money go?
London, Workshop 2
The NHS is a waste of money. I don’t like this model. People are too dependent on the NHS. Mixing the two together, NHS would end up spending the money.
Leeds, Workshop 2
Features of a better system?
At the end of the deliberative events, participants were divided into small groups and tasked with developing their ideal system, based on the key features that were important to them.
Any new system should be built on the following key principles:
- Standards: good and consistent quality care
- Transparency: clear information about costs and where funding goes
- Sustainability: a system built to last over the long term
- Choice: control over care options
- Accessibility: easy-to-navigate services
- Fairness: everyone contributing to social care funding.
On the funding side, most people mentioned a dedicated social care tax because this was perceived as the fairest and most transparent way to raise additional money. Some people added a cap on costs, to protect individuals’ assets. There were many who liked the idea of a basic level of care available to everyone, regardless of their income or assets. But others also warmed to the idea that those who could contribute to their costs should do so, via some sort of means test.
On the management side, a joint budget between health and social care was popular (although additional money was seen to be needed for the NHS, too), as was an independent body to oversee the funding, to guarantee quality and fairness of provision across the country.
Participants also felt strongly that any new funding model should be clearly communicated (the sense of anger generated by not knowing about the current system lingered throughout the workshops). It should be sustainable and last over decades, care provided should be of good quality everywhere, and it should be transparent and simple to access.
Box 5: Analysis: perceptions of costs
It is important to remember that throughout the deliberative events and in the surveys, the public were not confronted with any calculations of the potential global costs of the various options.
FPC and a joint social care and NHS budget were attractive options to people. But our research also sounds some alarm bells about the implications of going down this route: a minority of people are far from convinced that the NHS is as waste-free and well managed as it could be, and the lack of a clear public service identity for social care made people worry that older people’s care would lose out in the battle for resources.
However, when it comes to a means-tested option, it was instructive to see during the deliberative events how difficult people found it to understand the complexities of the idea of a cap and floor for care. Even after ample time for discussion, this approach was deeply confusing, and only reluctantly seen as preferable to the existing arrangements. Even then, only a minority of people were willing to concede that there might be an acceptable trade-off between allowing their housing assets to be used and a system that would potentially protect more people with a basic level of care.
Section 4 – Pulling it all together: policy implications for social care reform
The combined strands of this work represent some of the most comprehensive recent work to identify, analyse and quantify options to reform social care funding, and to understand the wide range of public attitudes to them.
Together, they confirm a widely held belief in public policy circles: while the case for change is overwhelming, reforming social care will not be easy. Our key lessons for policymaking are set out below.
Revision or full reform? There is a need for more consensus on the problem(s) we most need to solve to decide on the type and scale of response required
The case for major action on public funding of social care is strong and widely accepted in policy circles. However, the scale of the challenge is so large that there is less consensus on which ‘burning platform’ needs the greatest attention. If additional funding is available, it could be used to improve access and quality for people under the current system, to address the declines in both since 2010. Alternatively, extra funding could be used to address fundamental issues associated with the current model, including equity, protection against catastrophic costs, and public concerns about people having to sell their homes to fund their care.
The views of policymakers are reflected by those sections of the public who are aware of the problems surrounding social care. Some people are concerned about the potential risk of personal catastrophic costs, of having to sell their homes to pay for care. Others are worried less about funding and more about the quality of the current system or reports of abuse and neglect in care homes. For many people, however, social care remains a confusing and often peripheral issue, one that relatively few have experienced directly.
Providers, meanwhile, may worry about finding a workforce (90,000 social care jobs are vacant at any one time) and delivering services on low fees, while commissioners worry about sustaining a fragile care market with declining income. Policymakers may worry about workforce and market sustainability, too, but also about the wider economic challenges of providing care to an increasing number of people in need, at a time when there will be fewer people paying tax to fund it. From this viewpoint, reducing or at least managing the demand on public finances from social care may well be the priority. The approaches taken to these issues, and the potential solutions, differ and may pose contradictions: capping care costs may prevent catastrophic costs but only at an additional cost for public spending which people may be unwilling to bear.
A key issue for policymakers, then, is this: which problem(s) do we most want to resolve? If the main problem is seen as catastrophic cost, then a cap on costs is an appropriate – and (relatively) low-cost – approach. If equity and complexity are more pressing, then free personal care may be a more attractive option. Yet if improving access and quality for those most in need is more pressing, then arguably providing more funding for the current model may be preferable.
Agreeing the most important issue to address will be fundamental. This is the key question that ultimately split the Sutherland Commission in 1999. Without consensus on this key question, it is unlikely a solution will ever be found.
Sustaining the current social care system will be expensive. While wider reform would cost even more, it may be better value than continuing with a flawed approach
Demographic and workforce pressures on adult social care mean that, under the current system, public spending on social care would need to increase by more than 70% by 2030/31. This would do no more than protect current levels of access and quality, about which the public already has concerns.
However, if funding rises only in line with current trends, there will be a funding gap of £6bn by 2030/31. This is likely to mean even fewer people accessing state-funded services, with further implications for the quality of those services.
Moreover, these may be underestimates since they use as their baseline a social care system which is already, as we have seen, at ‘tipping point’. Eligibility for services has already been cut since 2005 and there are serious questions about the sustainability of providers in the publicly funded social care market. As one example, the Competition and Markets Authority estimated that if local authorities paid the full cost of care for residents of care homes, the additional cost to them would be around £1bn a year.¶¶ Similarly, it is reasonable to wonder whether the up to 700,000 care workers that the sector needs can be found at current levels of pay. Against this should be set any further cost-saving potential in the social care sector from technology or other efficiencies.
So significant additional funding is needed simply to maintain the quality and capacity of the current flawed system. ‘Resetting’ the current system to the levels of access seen in 2009/10 is expensive – we estimate a total cost of £39bn by 2030/31 and a funding gap of £15bn, at current prices. Yet this was not seen as satisfactory at the time, so although it would be an improvement, fundamental issues concerning equity and access would remain.
It may, then, make sense to consider whether reform would be better value. Our modelling estimates that introducing a cap and floor model as proposed by the Conservatives at the 2017 general election would cost £35bn (a funding gap of £12bn on current trends) by 2030/31. Providing free personal care similar to the model in Scotland would require total public spending of £37bn, a funding gap of £14bn.
These two options would take reform in different directions. The cap and floor model provides a more generous means-tested system with more people entitled to ‘free’ care and a protection against catastrophic costs for those who are required to pay. It does, however, move away from the direction of previous policy on ‘ageing in place’, by removing the personal financial incentive to use home care rather than move to a care home. Its administration would remain fundamentally different to the NHS and the cap would require a wholly separate finance system.
Free personal care offers a simpler system, already popular in Scotland, which would allow for closer integration with the NHS – a key direction of travel for this and other governments. But it is the more expensive of the two options.
However, all the potential options for social care funding will require additional investment. The most basic of these is the cheapest but does no more than return the current system to the levels of access and quality it had in 2015, by which time local authorities had already made substantial cuts. Nor does it address the substantive issues raised by the public around quality and costs or by providers and commissioners around sustainability.
To that extent, returning funding levels to those experienced in 2009/10 would be an improvement, especially since local authorities will have made efficiency gains during that period and these savings could be reinvested in quality and market sustainability. Funding would be available to address the increases in population need since 2009/10, as well as to improve payments to providers to address cost pressures. However, this is also the most expensive option and – without specific measures such as introducing a cap – it would not offer any protection against the catastrophic costs that concern the public. The options of real reform – the cap and floor or free personal care – may therefore be far better value for money.
While most people favour a balance of funding between the state and individual, many believe social care should be wholly tax-funded
Since even carrying on with the current model requires additional funding, there is a critical issue around who bears responsibility for the costs of social care: the individual or the state, or some combination of the two. A consensus has developed during previous attempts at reform that a ‘partnership’ approach, in which the individual takes some responsibility and the government the rest, is the correct way forward.
Our research found that in principle, most people (55%) favoured such an approach, with 30% supporting a means-tested system and a further 25% supporting a means test and cap. However, 41% of people believed that the government should be solely responsible, as it is for the NHS. Only 2% believed sole responsibility should lie with the individual.
In the deliberative events, similar feelings were expressed with most people favouring more, rather than less, government responsibility.
Moreover, many older people we spoke to believed strongly that they had already paid for their care through previous income tax and NI and were reluctant to accept they should pay more.
What is the NI for if it isn’t to pay for social care…? Government are washing their hands of us.
Leeds, Workshop 1
And a red line for many was the use of housing wealth to pay for care costs:
Just forget about touching people’s houses. That should be a principle. Just get rid of that rule. Take people’s houses out of it.
Leeds, Workshop 2
If a significant proportion of the public assume social care will be free at the point of need, paid for by government through taxes and NI then it is unsurprising that new proposals that involve contributions from individuals are seen in a negative light, even if objectively they might be seen as more generous than the current model. This is important and in part explains the reaction to the proposals outlined by the Labour Party in 2010, and again in the 2017 Conservative Party manifesto in 2017. It could be argued that the manifesto pledges were more generous than the current system but would not be seen as such if people think social care is currently free or at least heavily subsidised.
The reality facing a government that wants to secure reform involving use of people’s housing assets is particularly stark and creates a double bind. The public will first have to be informed that the situation facing social care is bad, and that in many cases, their houses are already at risk depending on the care they might need. They will also have to persuade the public that taxation cannot be raised (or will not be enough), and that alternative sources of existing public spending cannot be diverted. While this does not preclude an approach that uses housing wealth in some way, any government would need to understand the strength of opposition and explore further whether approaches that pool revenues, for example though a tax on estates, could find greater acceptance.
Identifying the best source of any additional money will be a major challenge, whether for the individual or government
The need to raise more money, whether from the individual and/or the government, generates difficult questions. For the individual, because no long-term insurance products exist there remains no simple way of insuring against care costs, and worldwide there is little evidence that many people will do so voluntarily even where products exist.
It also seems highly unlikely that many would save towards the costs of future possible care costs – this has been compared to saving up in case your house burns down. This suggests the need for government intervention, as other countries have acknowledged with the introduction of social insurance schemes.
Revenue-raising questions for government are equally if not more profound. We found some people hoping that the extra costs of social care could be paid for by reductions in other government spending, such as foreign aid, by cutting waste or by eliminating the profit motive of providers:
People feel it’s unfair to pay for care homes because the cost is extortionate. If the government and local councils opened care homes, it would be more reasonable.
But in reality, the potential size of the funds needed means that, if the current model of funding social care largely through general taxation remains, it is likely that a wide basket of tax increases and/or new taxes would be needed to fill the gap. The social care precept would raise relatively low amounts – nearly £2bn a year by 2019/20 – but our modelling suggests that a 1 percentage point rise in the basic rate of income tax could raise £3.7bn for England. Local sources also have fundamental problems in that the areas of the country requiring the greatest spend on social care are least able to raise it.
A package of additional funding, which could include taxes on assets such as housing, has the advantage of spreading responsibility for generating a very significant sum across a wide range of sources. However, it risks creating as complicated a funding package for social care as currently exists around eligibility and potentially raises public concerns about transparency:
We need to just speak in layman’s terms… It’s going to be transparent in the way we’re going to do it and this is how you’re going to benefit.
London, Workshop 2
If a government continued down this route, it would be important for it to set out some underlying principles behind the funding package, for example around the split between local and national funding, the balance between income versus wealth and/or the contribution between different cohorts/generations. On this last point, our research found little, if any, evidence of intergenerational tension. While there was a recognition that some younger people were struggling financially, there was also a sense that it is important to be fair to older generations.
An alternative strategy to a funding package would be to accept that there is a profound, long-term requirement for significant additional funds for social care and to consider a single source of funding; for example, a hypothecated tax or social insurance model. This could be a full replacement for other methods or, more realistically, an additional one. Since, along with social care, there is widespread acceptance that funding of the NHS will need to rise in line with additional need, it would be logical to consider both the NHS and social care together in such a funding mechanism. However, it would be important to recognise public concern that such a move might ultimately mean social care for older people losing out to the NHS.
The public wants to be able to ‘follow the money’. While hypothecation is problematic in policy terms, its popularity might be an enabler of reform
Our research found a strong public view about the need to link any increased revenue-raising with clarity about where the money will be spent. Since many already believe that they have paid for their health and care through previous ‘hypothecated’ NI payments, this accounts for some of the public anger over having to pay social care costs in older age. ‘Soft’ hypothecation is a fundamentally short-term lever which cannot answer the long-term challenge of funding social care reform. And there are significant issues around full hypothecation, for which there is little precedent in the UK, and which limits government flexibility and might see spending on social care actually fall if tax receipts fall, for example during a recession. There is also a concern that an unpopular tax directly linked to social care – as happened with the ‘death tax’ controversy in 2010 – might put at risk the wider reform it aims to fund.
However, there is no ignoring the momentum building behind the concept as a way to end the more than 20-year logjam over social care funding reform.
There is now a clear fork in the road for policy reform
There is no consensus on the balance of responsibility between the state and the individual on social care funding, with many people still believing the state should take responsibility, but others accepting more personal responsibility. This suggests we are at an important fork in the road on social care policy between targeting funding at those with the lowest means, as in the current system, or providing some level of service to everyone.
One route of reform therefore points towards retaining the current means-tested system but making it fairer and probably more generous. This has the advantage of being cheaper, too:
What’s going to happen is a means test. It’s inevitable. There’s no way there’s enough money in the pot.
London, Workshop 2
It could be modified by introducing a cap on care costs, which would limit the liability of those who need most care.
Even a system with a cap, however, takes us further away from the funding principle underlying the NHS, with which increasingly we want to integrate social care services. The other route, therefore, points towards social care that is – to some degree – free at the point of use.
Free is good. Simple. Treating everyone the same.
King's Lynn, Workshop 2
While this route is a departure from the recent focus on a cap and floor approach, it is nonetheless a move in the direction of the Sutherland Commission, the 2010 Labour government and the route Scotland has already taken. Nor is it significantly more expensive than the cap and floor model that has already been proposed by the Conservative government.
‘Doing nothing’ or ‘doing as little as possible’ is not safe, and is no longer an easy option
In reforming social care, a critical question is which attributes of a reformed system a government should seek to prioritise: equity/fairness, economic efficiency/value for money, sustainability and resilience, acceptability and accountability, clarity/ease of use or costs of implementation? In practice, successful reform will need to balance each of these attributes. There is therefore no ideal solution:
There’s not a fair way. You’ll never please everyone. It will suit some people more than others. A shame, but that’s how it is.
King's Lynn, Workshop 2
Any reform will include trade-offs, in both the offer and how it is funded. Any reform will also require more money. The case for additional investment in a public service is always challenging, but more so in the current climate with the government looking to reduce the national public deficit. Yet avoiding reform may also be risky. The public has an emerging sense the problems with social care around funding, workforce and the level of care provided. When they have the system explained to them, they dislike it:
It’s not working. For me personally, I don’t think you can continue with this.
Leeds, Workshop 2
And when people encounter the current system in real life – which, as the population ages, more are now doing – they find it complex and are shocked at the extent of personal responsibility.
Choosing between these trade-offs and finding the money will require leadership, not just among politicians but also other stakeholders. The difficulties of achieving change should not – and, given the history of the issue, will not – be underestimated.
It remains too optimistic, then, to say that doing nothing is ‘not an option’. But for policymakers, the pressures of demographics and growing public concern about the state of social care mean it is no longer politically the least risky option. Inaction is surely not a safe option when public satisfaction with social care services is at its lowest level since the question was first asked in 2005. The Care Quality Commission warns of social care at ‘tipping point’ and the risk of another ‘Southern Cross’ collapse remains.
Under those circumstances it may be tempting for government to ‘do as little as possible’, to provide only enough money to prevent the system from falling over and pass the buck of reform to a future government. Yet not only would this be the wrong option in policy terms, it might not be a good investment in political terms. It might in practice mean no more than stabilising the provider market while doing little or nothing about quality, eligibility and the risk of catastrophic costs – the issues about which voters are most concerned.
More fundamental reform, whether improving the means-tested system or a move towards free personal care, would undoubtedly be difficult to fund and implement but – because it would improve the issues that most matter to voters – might also be the right move politically.
To support solutions, people need much better understanding of the problems and solutions. But politicians are not the best people to provide it
Our public attitude findings will not make easy reading for policymakers and politicians looking to present solutions to a problem that is neither widely recognised nor understood. At the heart of what we have learnt from our work on public attitudes is an unpalatable truth: if genuine public support is needed for a systematic and sustainable reform of social care funding, then there will need to be a painful process of revealing to the public just how broken the current system is.
There needs to be a clearer articulation to the public of where we are now, breaking down the misconceptions and presenting an unvarnished picture of the challenges faced. This must be seen as a communications challenge as much as anything else.
One key challenge is language. There is a question mark over whether the term ‘social care’ has had its time and whether there needs to be more thought about how to talk about the services that fall under its umbrella. Public advertising around the implementation of the 2014 Care Act used the term ‘care and support’ rather than ‘social care’.
A second key challenge is the scope of the debate. In the run-up to the 2010 election, Labour started to talk about a ‘National Care Service’, attempting to leverage some of the public’s affection for the NHS and apply its strong branding to social care.
As well as the strategic logic of joining up health and care services, there are good pragmatic arguments for debating the funding challenges for health and social care together. Given the disparity in political clout between the sectors – the combined forces of social care providers and local authorities cannot come close to the emotional and political lobbying power of the hospital sector and medical professions – there may well be gains from linking the two issues together. Rather than setting up a separate discussion, it brings social care into a national institution that comes with significant goodwill on the part of the public. There was already some awareness of the impact on the NHS of an inadequate social care system (the experiences of hospitals in winter 2017/18 covered in the media seem to have reached the public), alongside a more general awareness of funding problems in the NHS.
However, joining the two together also brings problems. While integration may be the generally agreed policy direction, the two systems have very different cultures: social care in particular is very sensitive to being ‘taken over’ by the NHS. And then there is means testing: while situating the debate about social care alongside that regarding the NHS may make sense if the preferred solution is free personal care, it may bring more confusion if the preference is for a model that retains a means test, such as the cap and floor. There should also be concerns that combining the funding challenges of the NHS and social care would create such a large financial requirement that it might appear impossible to some people. And while the public is supportive of the NHS, that support is by no means unconditional, with many believing that the service is inefficient and wasteful.
Nonetheless, nurses and doctors also regularly top the list when it comes to professions trusted by the public to tell the truth (Figure 6). Even if the public understood that social care was the responsibility of local authorities, councillors are not highly trusted, while the current lack of trust in national government that was so apparent in our public attitudes work would suggest that its involvement would have limited value. Independent bodies might have more potential impact.
All this suggests that there has to be a coalition approach, bringing charities, system leaders, the NHS, user groups, academic institutions, think tanks and, where possible, cross-party support. Lessons must be learnt from other campaigns that have been run to draw public attention to particular issues. What can be learnt from mental health and the increasing public debate taking place in that arena? That debate has been led by many different parts of society, such as patient leaders and high-profile spokespeople, including celebrities and the royal family as well as the sector itself. Although a major challenge, it is not impossible to change public attitudes. Optimism and learning should be taken from the success of the Turner Commission on pension reform between 2002 and 2006.
Figure 6: Results from the Veracity Index 2017 on professions respondents trust to tell the truth
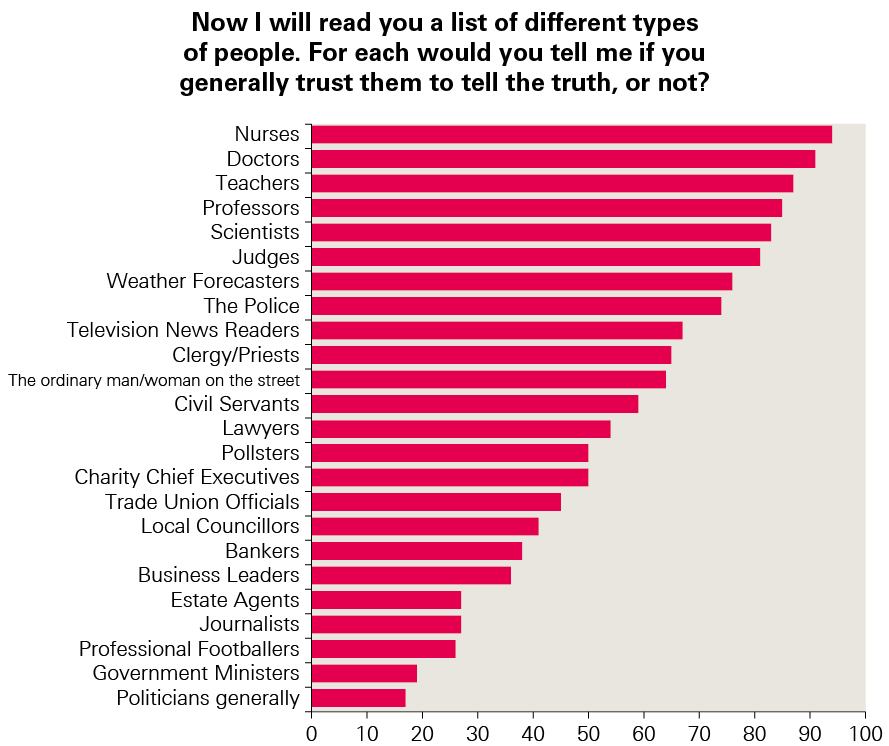
Any potential solution has to be seen as an improvement but this will only happen if people understand what is currently in place, rather than thinking social care will be free at the point of need or at least subsidised more significantly than it currently is.
¶¶ Note this is a UK figure.
Conclusion
The case for change that we have set out in this programme of work is not new, having been debated for well over 20 years. Despite this, public awareness remains low, and while political consensus on the need for action exists, the lack of agreement on what should be done has meant a worrying lack of real change for far too long.
While we have not set out to suggest the answer in this work, it does help lay out the groundwork for a solution. We have set out viable options for change, to aid those in government to make the progress that is so desperately needed. Consensus must be quickly sought about whether to address concerns on current access and quality, equity and complexity, or protection against major costs and encouraging an insurance market. It is unlikely that all these issues can be addressed immediately, so prioritising them is the essential first step to producing a lasting solution.
The ongoing green paper process must lead to major improvement. Without it, real people will suffer and public anger will rise at continuing inaction in the face of ever more serious warnings.
References
- Blair T. Leader’s speech, Labour Party conference. Brighton: Labour Party; 30 September 1997. Available from: /www.britishpoliticalspeech.org/speech-archive.htm?speech=203 (accessed 9 May 2018).
- Wenzel L, Bennett L, Bottery S, Murray R, Sahib B. Approaches to social care funding. London: The Health Foundation and The King’s Fund; 2018. Available from: www.health.org.uk/publication/approaches-social-carefunding (accessed 9 May 2018).
- Dilnot A. Fairer care funding. London: Commission on Funding of Care and Support (the Dilnot Commission);2011. Available from: webarchive.nationalarchives.gov.uk/ 20130221130239/www.dilnotcommission.dh.gov.uk (accessed 9 May 2018).
- Office for National Statistics. National life tables, UK: 2014 to 2016. London: ONS; 2017. Available from: www.ons.gov.uk/peoplepopulationandcommunity/birthsdeathsandmarriages/lifeexpectancies/bulletins/nationallifetablesunitedkingdom/2014to2016 (accessed 9 May 2018).
- Office for National Statistics. National population projections: 2014-based statistical bulletin. London: ONS; 2017. Available from: www.ons.gov.uk/peoplepopulationandcommunity/populationandmigration/populationprojections/bulletins/nationalpopulationprojections/2015-10-29 (accessed 9 May 2018).
- Age UK. Later Life in the United Kingdom. London: Age UK; 2018. Available from: https://www.ageuk.org.uk/globalassets/age-uk/documents/reports-and-publications/later_life_uk_factsheet.pdf (accessed 9 May 2018).
- House of Lords Select Committee on Public Service and Demographic Change. Ready for ageing? London; 2013. Available from: publications.parliament.uk/pa/ld201213/ldselect/ldpublic/140/14003.htm (accessed 9 May 2018).
- NHS Digital. Adult Social Care Activity and Finance Report, England 2016–17. London: NHS Digital; 2017. Available from: digital.nhs.uk/catalogue/ PUB30121 (accessed 9 May 2018).
- Phillips D, Simpson P. National standards, local risks: the geography of local authority funded social care, 2009–10 to 2015–16. London: Institute for Fiscal Studies; 2017. Available from: www.ifs.org.uk/publications/9122 (accessed 9 May 2018).
- Nuffield Trust, The Health Foundation, The King’s Fund. The Autumn Budget: joint statement on health and social care. London; November 2017. Available from: www.health.org.uk/publication/autumn-budget (accessed 9 May 2018).
- Dunning J. Councils to deny social care support to all but most needy. London: Community Care; 2010. Available from: www.communitycare.co.uk/ 2010/09/14/councils-to-deny-social-care-support-to-all-but-most-needy/ (accessed 9 May 2018).
- Competition & Markets Authority (UK Government). Care homes market study: summary of final report. London: CMA; 2017. Available from: www.gov.uk/government/publications/care-homes-market-study-summary-of-final-report/care-homes-market-study-summary-of-final-report (accessed 9 May 2018).
- Care Quality Commission. The state of health care and adult social care in England 2016/17. London: CQC; 2017. Available from: www.cqc.org.uk/publications/major-report/state-care (accessed 9 May 2018).
- Office for National Statistics. Overview of the UK population: March 2017. London: ONS; 2017. Available from: www.ons.gov.uk/peoplepopulationandcommunity/ populationandmigration/populationestimates/articles/overviewoftheukpopulation/mar2017 (accessed 9 May 2018).
- UK Government. Spending review and autumn statement 2015. London; 2015. Available from: www.gov.uk/government/topical-events/autumn-statement-and-spending-review-2015 (accessed 9 May 2018).
- UK Government. Spending Review and Autumn Statement 2015: key announcements. Available from: www.gov.uk/government/ news/spending-review-and-autumn-statement-2015-key-announcements (accessed 9 May 2018).
- Same as note 10: www.health.org.uk/publication/autumn-budget
- Amin Smith N, Phillips D, Simpson P. Adult social care funding: a local or national responsibility? (Briefing note BN 227). London: Institute for Fiscal Studies; 2018. Available from: www.ifs.org.uk/publications/12857 (accessed 9 May 2018).
- Dilnot, A. Fairer care funding: volume III, supporting documents. London: Commission on Funding of Care and Support (the Dilnot Commission); 2010. Available at: webarchive.nationalarchives.gov.uk/20130221121534/http://www.dilnotcommission.dh.gov.uk/our-report/ (accessed 12 April 2018).
- Shrimpton H, Cameron D, Skinner G. State of the State 2017-18: austerity, government spending, social care and data. London: Ipsos MORI on behalf of Deloitte LLP; 2017. Available from: www.ipsos.com/ipsos-mori/en-uk/public-perceptions-austerity-social-care-and-personal-data (accessed 9 May 2018).
- Carter D, Rigby A. Turning up the volume: unheard voices of people with dementia. London: Alzheimer’s Society; 2017. Available from: https://www.alzheimers.org.uk/sites/default/files/migrate/downloads/turning_up_the_volume_unheard_voices_of_people_with_dementia.pdf (accessed 9 May 2018).
- Dilnot, A. Fairer care funding: volume III, supporting documents. London: Commission on Funding of Care and Support (the Dilnot Commission); 2010. Available at: webarchive.nationalarchives.gov.uk/20130221121534/http://www.dilnotcommission.dh.gov.uk/our-report/ (accessed 12 April 2018). NB: As this is a repeat of reference #19, it will have to be deleted here and #22 replaced by #19 in the body of the text (this is HF style). This will affect the subsequent numbering of references.
- Wood C, Vibert S. A Good Retirement: public attitudes to the role of the state and the individual in achieving financial security in later life. London: Demos; 2017. Available at: www.demos.co.uk/wp-content/uploads/2017/12/A-Good-Retirement.pdf (accessed 9 May 2018).
- Scottish Government. Free personal and nursing care, Scotland, 2015. Edinburgh: A National Statistics Publication for Scotland; 2017. Available from: www.gov.scot/Topics/Statistics/Browse/Health/Data/FPNC (accessed 9 May 2018).
- The Health Foundation 2018. Social care funding options: how much and where from? www.health.org.uk/social-care-funding-options
- Office for National Statistics. Five facts about… older people at work. London: ONS; 2016. Available from: visual.ons.gov.uk/five-facts-about-older-people-at-work/ (accessed 9 May 2018).
- Barker K. A new settlement for health and social care: final report. London: The King’s Fund; 2014. Available from: www.kingsfund.org.uk/projects/commission-future-health-and-social-care-england (accessed 9 May 2018).
- Office for National Statistics. Wealth in Great Britain Wave 5: 2014 to 2016 (Wealth and Assets Survey). London: ONS; 2018. Available from: www.ons.gov.uk/peoplepopulationandcommunity/personalandhouseholdfinances/incomeandwealth/bulletins/wealthingreatbritainwave5/2014to2016 (accessed 9 May 2018).
- Lloyd J. Inheritance tax: could it be used to fund long-term care? London: The Strategic Society Centre; 2011. Available from: strategicsociety.org.uk/wp-content/uploads/2013/01/Inheritance-Tax-Could-it-be-used-to-fund-long-term-care.pdf (accessed 9 May 2018).
- Griffiths D, Fenton W, Davison S, Polzin G, Price R, Jess A et al. The state of the adult social care sector and workforce in England. London: Skills for Care; 2017. Available from: www.skillsforcare.org.uk/Documents/NMDS-SC-and-intelligence/NMDS-SC/Analysis-pages/State-of-17/State-of-the-adult-social-care-sector-and-workforce-2017.pdf (accessed 9 May 2018).