Introduction
The UK has become a world leader in pessimism about the future quality of its health care. A 2016 Ipsos MORI poll of 18,000 people in 23 countries found that British people were the least optimistic when asked about the quality of health care that they or their family would have access to over the next few years. Only 8% of people in the UK thought it would get better; 47% thought it would get worse, making people in the UK more pessimistic than those in 22 other countries, including Spain, Italy, France and Germany.
This worry is understandable. Public perceptions are likely to have been shaped by the intense media coverage of the human and financial pressures on the NHS in recent months and years. Paradoxically, a large majority of patients using care tend to be very satisfied, so how justified is this anxiety about the quality of NHS care in the future?
To help inform the debate ahead of the June 2017 general election, the Health Foundation is publishing three briefings on NHS and social care finances, the quality of care provided by the NHS, and the NHS and social care workforce. In the first briefing, we showed that funding in England since 2010 has not risen as quickly as the pressures on the NHS, which have been caused by having to meet the health care needs of a growing population, and the rising costs of staff, drugs and other essentials.
So what has happened to the quality of services over this period? Has it started to falter under the weight of the gap between static funding and rising pressures? In this second briefing, we give a very high level snapshot of how the quality of some NHS services has changed over the past few years in England.
A word about quality
- Quality in health care is a broad concept and not easy to measure. It includes the compassion shown by staff to patients, whether the right tests and treatments were given for a specific illness, whether the treatment was given quickly enough and was safe, and whether the treatment did what it was expected to do in terms of improving a condition or curing an illness.
- Health care is high quality if it is safe, effective, person-centred, timely, efficient and equitable. With millions of people using NHS services for thousands of different treatments and conditions, it is not possible to give a comprehensive picture of quality in England across all these dimensions.
- National data mask variation in the quality of care between different parts of England: the Care Quality Commission (CQC), national clinical audits, NHS RightCare, My NHS, National General Practice Profiles and others all highlight large unwarranted variations within and between organisations, services and teams.
- The Organisation for Economic Co-operation and Development (OECD) has also highlighted differences in aspects of quality between the four countries of the UK. In this briefing, we focus on England because health has been a devolved matter since the late 1990s, but some national clinical audits include the other countries of the UK, and we make international comparisons on a UK basis due to limits in the available information.
What this briefing does and doesn’t cover
This briefing examines some aspects of the quality of care for a small selection of major conditions where we could find enough reliable data to tell the story of change over time. It is largely limited to England but includes UK comparisons with the performance of health systems in other countries. Where possible, we have used metrics from national clinical audits, themselves based on guidance by the National Institute for Health and Care Excellence (NICE), together with international comparisons published by the OECD.
The four aspects of quality covered in this briefing are all either leading causes of ill health or high profile dimensions of NHS performance.
- Waiting times for hospital treatment: we have included urgent and emergency care, and other more routine hospital treatment and procedures.
- Care for patients with diabetes: this is a complex lifelong condition that can cause a range of complications and is estimated to affect around 3.8 million people over 16 years of age in England.
- Psychological therapy for common mental health conditions: we have included data on access to evidence-based psychological therapies for conditions such as depression and anxiety, which affect around 6.1 million people in England at any one time.
- Speed and use of the most effective best-practice treatments: we have looked at indicators for two cardiovascular diseases and two common cancers. In 2015/16, around 194,000 hospital visits were caused by heart attacks in the UK and around 240,000 visits were caused by stroke. 46,083 new diagnoses of breast cancer and 34,729 new diagnoses of bowel cancer were registered in England in 2015 which, together with prostate and lung cancer, accounted for just over half of all new cancers diagnosed in 2015.
Waiting times for hospital treatment
The NHS in England collects and publishes a large amount of information about how quickly patients can access treatment within a range of targets set by government. There are no directly comparable data for other countries outside the UK. The NHS in England is not currently meeting a number of key waiting time targets for urgent and emergency care, cancer services and routine hospital treatment. But rising numbers of people using these services mean that the NHS is responding to more people within target times than ever before.
Ambulances
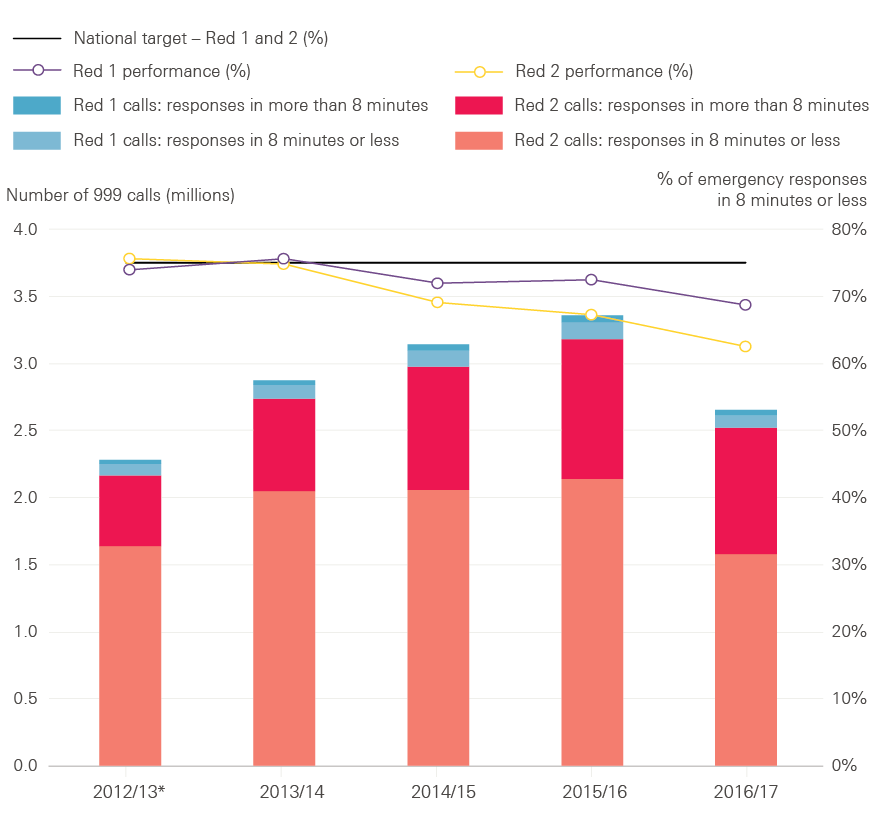
The NHS did not meet either target for ambulance response times for 999 calls where there is an immediate threat to life in 2016/17. Figure 1 shows that in 2016/17 an emergency response arrived within eight minutes in 68.7% of Red 1 calls and 62.5% of Red 2 calls, both below the expected standard of 75.0%.
Red 1 calls are the most time critical, covering patients with cardiac arrest who are not breathing and do not have a pulse, and other severe conditions such as airway obstruction. This target was met in 2013/14 (75.6%), but performance began to fall in 2014/15 and 75% has only been achieved in three out of the past 36 months.
Red 2 calls are also serious, but less immediately time critical and cover conditions such as stroke and fits. The Red 2 target was achieved in 2012/13 (75.6%), but performance dropped to 74.8% in 2013/14 and has remained below the target throughout the past three years.
A further target is that a fully-equipped ambulance should arrive within 19 minutes where there is an immediate threat to life and an ambulance is needed to transport someone to hospital. The target is to meet this standard in 95.0% of calls, but only 90.4% of calls met this standard in 2016/17. The target was met between 2011/12 and 2013/14, but performance has since deteriorated and the target has not been met for the past three years.
Figure 1: Ambulance response times to Red 1 and 2 calls, England, 2012/13* to 2016/17**
* Data are not available for April or May 2012, so only 10 months of data are included for 2012/13.
**Full 2016/17 data are not available for South Western, Yorkshire and West Midlands ambulances services, so numbers of calls are not directly comparable with previous years.
Source: NHS England, 2017
Figure 1 shows that the total number of ambulance calls where there is an immediate threat to life has grown over time, and the total number of calls that receive an emergency response within eight minutes has increased every year since the Red 1 and 2 targets were first set in 2012/13. The number of calls for 2016/17 excludes calls to the three ambulance services in England not reporting directly comparable data due to participation in trials to improve response times, but data reported by the other eight ambulance services suggest the number of calls continued to grow in 2016/17. The number of 999 calls made to the ambulance service has also grown: 9.8 million calls were made in 2016/17, up by over 1.6 million from 8.2 million in 2011/12. Despite this, the ambulance service has made considerable progress: more people have received help over the phone, fewer have been taken to accident and emergency (A&E) departments and more received an appropriate response first time.
A&E departments
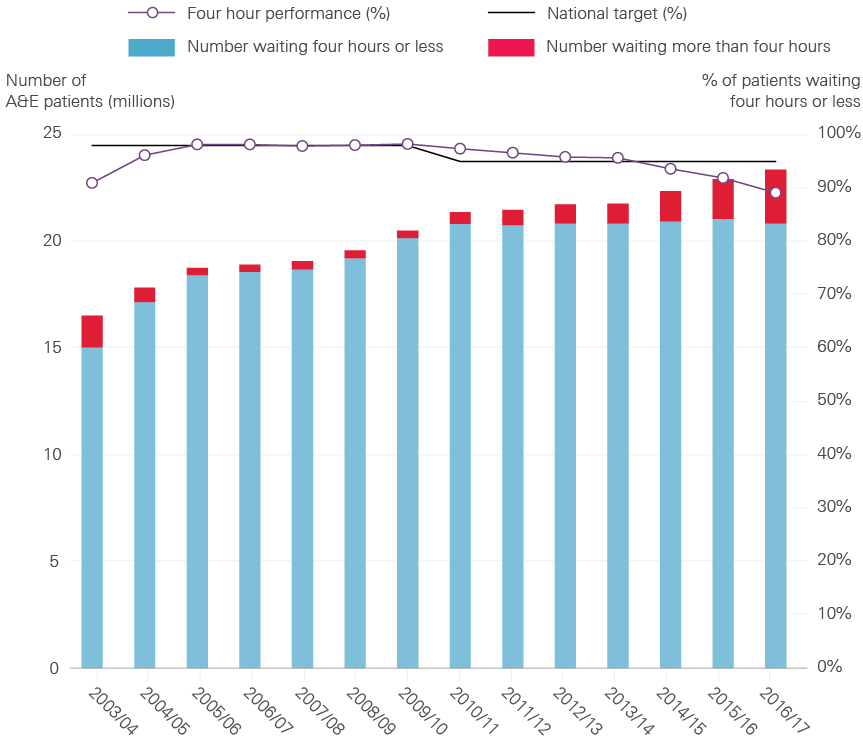
Once in an A&E department, 95.0% of patients should be admitted to a hospital bed, discharged home or transferred to another hospital within four hours of their arrival. The NHS did not achieve the A&E waiting times target in 2016/17: 89.1% of patients who needed emergency treatment waited four hours or less. The most recent year in which the A&E target was met was 2013/14; Figure 2 shows that the percentage of patients waiting four hours or less has fallen in every year since.
Figure 2: A&E waiting times in England, 2003/04 to 2016/17
Source: NHS England, 2017
However, the number of patients visiting A&E departments has grown over time and more were treated in 2016/17 than ever before. Figure 2 shows that 23.4 million people visited A&E departments in England in 2016/17. There has been an average annual increase in the number of people visiting A&E departments of 2.4% over the past decade. And the number of patients treated within target times has remained broadly stable since 2010/11, despite the NHS experiencing considerable pressure from continuing increases in demand for emergency care.
As well as a continued increase in the number of visits to A&E departments and patients needing emergency admission to hospital, there have also been more problems with discharging patients who no longer need a hospital bed (known as delayed discharge). 77,782 patients experienced a delayed discharge in 2016/17, an increase of 29,081 from 48,701 in 2011/12. Nearly 2.3 million hospital bed days (when those beds could have been used by other patients) were lost to delays in 2016/17, up from 1.4 million in 2011/12. A lack of suitable social care capacity has become the fastest growing cause of delays, accounting for over a third of the total in 2016/17.
High levels of bed occupancy have contributed to delays in admitting patients to hospital from A&E departments. More patients experienced excessive delays in A&E departments waiting for a hospital bed (known as trolley waits) in 2016/17 than in any other year since comparable records began in 2004/05. 560,398 patients experienced a trolley wait of more than four hours in 2016/17, up from 108,314 in 2011/12 and from 57,841 in 2006/07. 3,503 experienced a trolley wait of more than 12 hours in 2016/17, up from 123 in 2011/12.
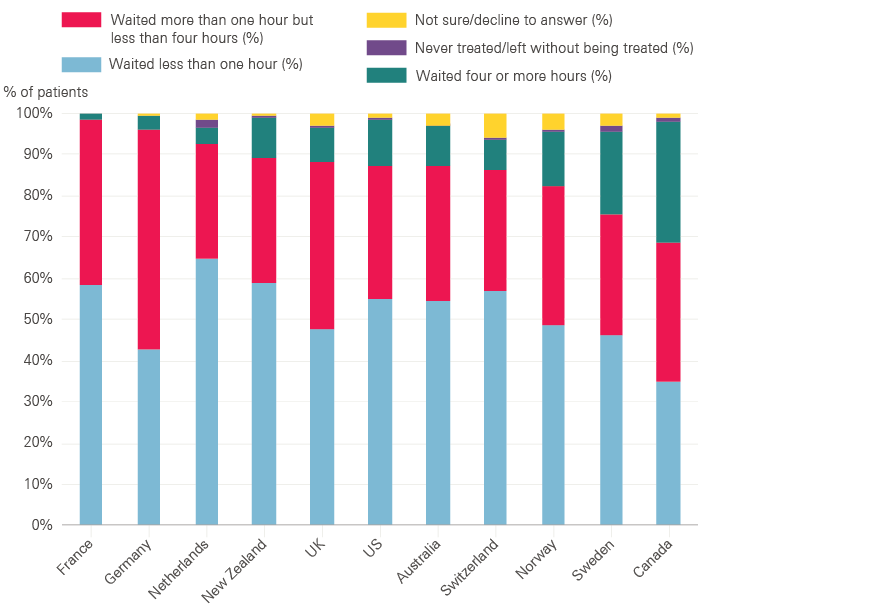
Comparing A&E waiting times with other countries is difficult, with very little reliable information available, but the UK does not appear to be an outlier in this respect. In a recent international survey (see Figure 3), 88.5% of patients from the UK reported waiting less than four hours: a higher percentage than reported by patients in Australia, Canada, Norway, Sweden, Switzerland and the USA, but lower than reported by patients in France, Germany, the Netherlands and New Zealand. The survey was based on small samples and the results should be treated with caution.
Figure 3: The last time you went to the A&E department, how long did you wait before being treated?
Source: Commonwealth Fund, International Health Policy Survey of Adults, 2016
Non-emergency and elective hospital treatment
Patients needing consultant-led treatment are expected to start treatment within 18 weeks of referral by their GP. These are non-urgent cases but can be serious, and the target was designed to make sure that patients got all the tests and investigations they needed in good time.
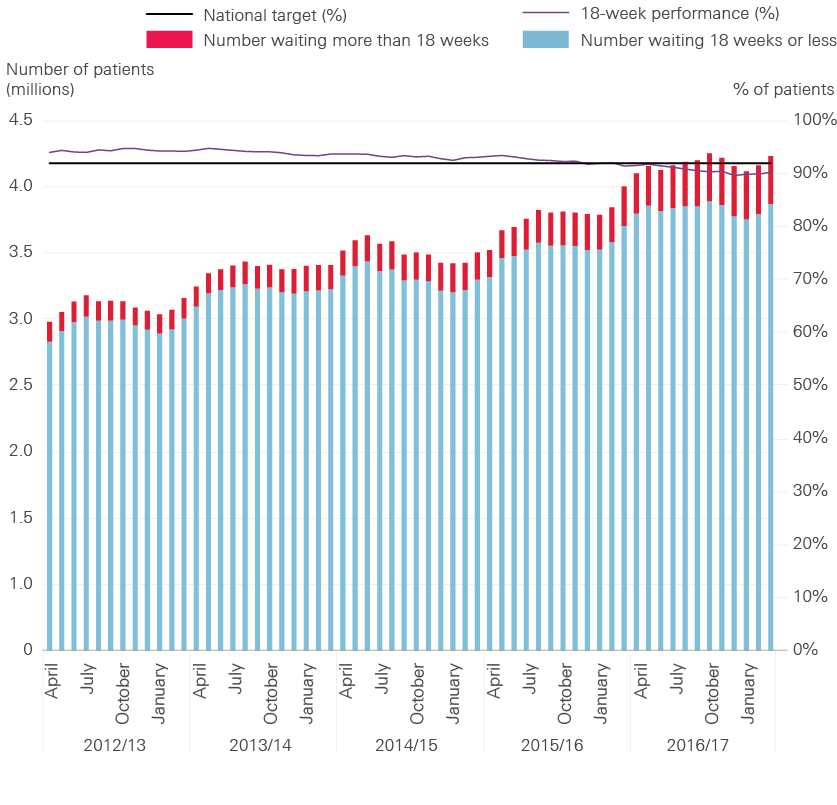
The NHS did not achieve the 18-week waiting time target for consultant-led treatment in 2016/17. 90.7% of patients who needed routine specialist treatment waited less than 18 weeks from being referred by a GP, slightly lower than the expected standard of 92.0%.
Figure 4: Referral to treatment waiting times for non-emergency and elective care in England, 2012/13 to 2016/17
Source: NHS England, 2017
Figure 4 shows that the current target of 92.0% was achieved from its introduction in 2012/13 to 2014/15, but performance began to fall in 2015/16. There are many reasons for this, but it is likely that increasing demand for emergency care has made it harder for hospitals to keep up with routine treatment, such as planned operations. The amount of routine treatment being carried out by the NHS has grown and is planned to continue growing, but the NHS has acknowledged that this is unlikely to keep pace with demand and the 18-week target is unlikely to be achieved until 2019.
Despite this, most patients continue to wait far less than 18 weeks to start treatment. The median time that patients had waited to start treatment was 6.2 weeks at the end of 2016/17, an increase of around five days from 5.2 weeks at the end of 2011/12. The number of patients waiting more than 52 weeks to start treatment has also increased in recent years, but remains small relative to the total number of patients. At the end of 2016/17, 3.7 million patients were on a waiting list to start treatment – an increase of 1.3 million from 2.4 million in 2011/12 – of which 1,529 (0.04%) had been waiting more than 52 weeks. This remains substantially lower than in the early 2000s when the original 18-week target was first set.
In terms of waiting times for patients referred with suspected cancer, the NHS achieved seven of the eight targets for cancer waiting times from 2011/12 to 2016/17.
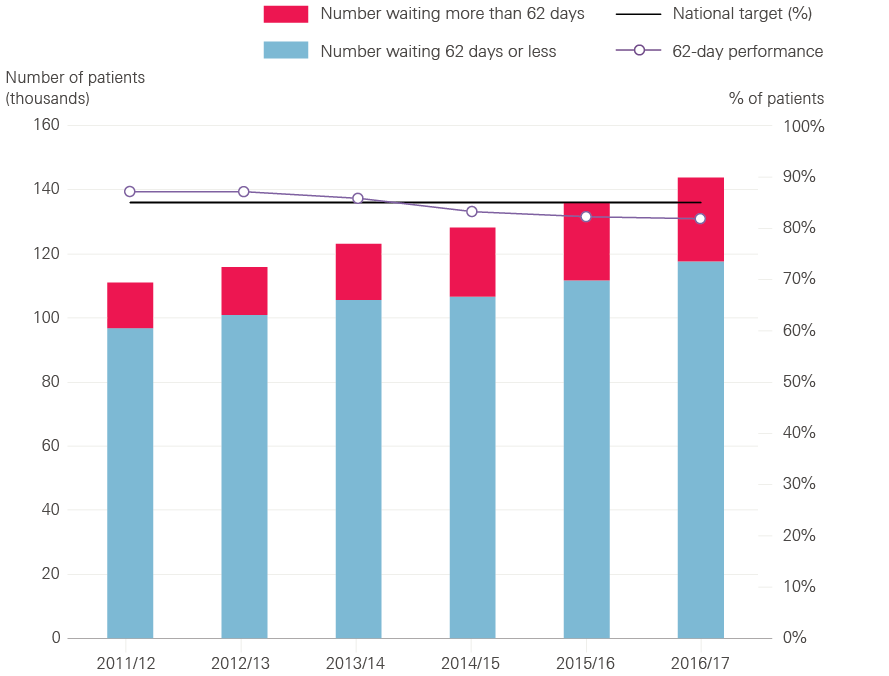
Figure 5: Patients starting treatment within 62 days of GP referral for suspected cancer, 2011/12 to 2016/17
Source: NHS England, 2017
However, Figure 5 shows that in 2016/17 the NHS did not achieve the target for the percentage of patients waiting less than 62 days to start treatment after referral by their GP for suspected cancer. 81.8% of patients began treatment within 62 days, compared with an expected standard of 85.0%. This is arguably the most important of the eight targets for cancer waiting times because it covers more patients from referral through diagnosis to the beginning of treatment than the other targets. This target was achieved from 2011/12 to 2013/14, but performance deteriorated in 2014/15 and the target has not been met for the past three years. Figure 5 also shows that the number of patients treated on the 62-day pathway has grown substantially over time.
International comparisons of waiting times are challenging because countries often take different approaches to what and how waits are measured. An analysis of OECD data by Siciliani et al (2013) highlighted that the UK has made considerable progress in reducing waiting times, from having relatively long waits in 1999 to being one of the better performing countries by 2012.
Care for leading causes of ill health
The data on waiting times tell a clear story of rising pressure: NHS staff have worked hard to treat more patients within target times, but demand has grown more quickly than supply and hospitals have struggled to meet their targets. Although there are limited data on waiting times beyond the ambulance service and acute hospitals, the situation is equally challenging elsewhere in the health system. General practice is under increasing pressure linked to increased workload, for example, and more patients report difficulty making an appointment.
But what happens once patients are through the door of a service, with a diagnosis of a particular condition? This and the next section look at six leading causes of ill health in England where we could find data that allow for comparison across time. We cover longer term illnesses primarily managed through general practice and other NHS services based in the community (diabetes and common mental health conditions), and sudden or life-threatening illnesses that need high quality care from the ambulance service and acute hospitals (stroke, heart attack, and breast and bowel cancer).
Care for patients with diabetes
NICE recommends eight care processes for people living with diabetes, including tests for blood pressure, cholesterol, blood sugar and kidney function. The NHS has made substantial improvements in diabetes care, but still has a long way to go: only 36.7% of patients received all of the recommended care processes in 2007 compared with 52.6% in 2016. This represents a reduction from 60.6% in 2010, although participation in the National Diabetes Audit, which measures the effectiveness of diabetes care against NICE guidelines in England and Wales, has increased and the total number of patients who received all care processes in 2016 was nearly as high as it was in 2010.
The NHS has also made progress in achieving all three NICE-recommended treatment goals for people with diabetes – controlling blood sugar levels, and reducing blood pressure and cholesterol – to avoid complications such as heart attack, kidney failure and damage to eyesight. In 2016, all three goals were met for 18.1% of people with type 1 diabetes (up from 16.5% in 2011). 40.2% of people with type 2 diabetes met the treatment goals (up from 35.1% in 2011) in 2016, but this was a reduction from a peak of 41.4% in 2014. The greatest improvement has been observed in achieving the blood pressure goal, but progress has leveled off since 2014.
A 2014 study comparing 30 European countries ranked the UK fourth for the quality of diabetes care, behind only Sweden, the Netherlands and Denmark. Figure 6 also shows that the UK was better than the average for OECD countries in 2013, both in terms of hospital admissions for people with diabetes (though this may simply reflect differences in how care is delivered) and for rates of amputations due to complications.
Figure 6: Diabetes care, age-standardised rates per 100,000 population, OCED average vs UK, 2013

Source: OECD, 2015
The number of people developing type 2 diabetes has grown and the percentage of people in hospital who have diabetes increased from 15% in 2011 to 17% in 2016. Regardless of the reason for admission to hospital, people with diabetes need high levels of care. The need for more hospital staff who specialise in diabetes has consistently been highlighted as an issue for the past six years, with fewer than one in 10 patients under a diabetes consultant while in hospital and more than a quarter of sites with no diabetic specialist inpatient nurses.
Despite an increasing workload, there have still been improvements in care, but nearly two in five inpatients admitted with diabetes experienced medication errors (38% in 2016, 32.4% in 2009/10), from either an incorrect prescription or incorrect management of medicine. In 2016, around one in 25 people with type 1 diabetes developed in-hospital diabetic ketoacidosis due to under-treatment with insulin.
Psychological therapy for common mental health conditions
One in four adults in the UK experiences a mental health problem in any given year, at an estimated cost to the economy of £105 billion per year. But mental health services have often received lower funding relative to need, struggled to offer sufficient access to services and tended to focus on containment rather than recovery. Despite improvements, these issues remain – particularly for people with severe mental illness, and for children and young people with mental health conditions. (We will be publishing further analysis on mental health services separately.)
In this briefing, we focus on access to psychological therapies for people with common mental health conditions, including depression and anxiety, which affect up to 15% of the population at any one time. Medication remains an appropriate and effective option for treating these conditions: 61 million antidepressant drugs were prescribed and dispensed in England in 2015, more than double the number in 2005. But many people prefer psychological interventions and the Improving Access to Psychological Therapies (IAPT) programme, launched in 2008, aims to improve access to a range of evidence-based psychological therapies.
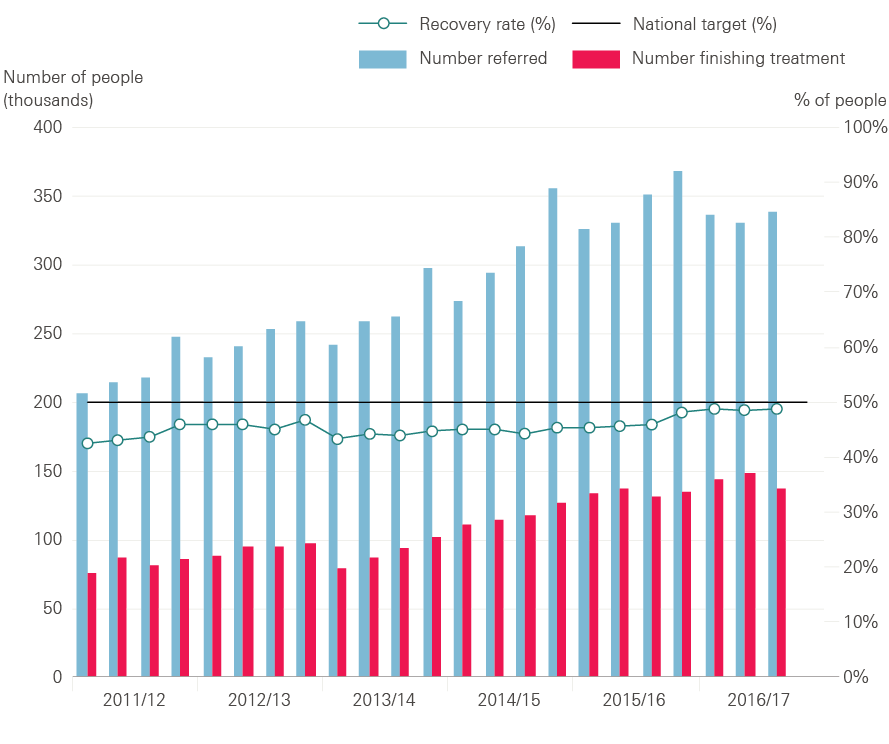
Figure 7: Numbers of people referred to IAPT services, finishing a course of treatment and recovery rate, 2011/12 to 2016/17
Source: NHS Digital, 2017
The NHS has consistently met its target of at least 75% of people starting psychological therapy within six weeks of referral to IAPT services, with at least 95% starting within 18 weeks. But these targets have been criticised for allowing people to wait months too long.
Figure 7 shows that the number of people being referred to IAPT services and the number of people completing treatment has increased over time. Over a million people were referred to IAPT services in the first nine months of 2016/17, an increase of nearly 400,000 from the same period five years ago. The number of people completing treatment has also increased substantially with nearly 430,000 people completing a course of therapy in the first nine months of 2016/17, almost double the number in the same period five years ago.
As well as increasing access to psychological therapies, the quality of IAPT services has also improved. The percentage of people who completed a course of treatment and were assessed as no longer being above the clinical threshold for anxiety and depression has increased over time, and early data suggest the 50% target for recovery rates was met for the first time in January 2017. There is still a long way to go: the NHS estimates that three in four people needing help get no support at all.
Speed and use of the most effective best-practice treatments
Stroke
Stroke – where a blockage cuts off the blood supply to the brain, or a blood vessel bursts within or on the surface of the brain – is a major cause of death and disability.
About 85% of patients leave hospital alive after a stroke, with about a third of those returning home. Close to 10% are discharged to a care home, of whom 65% are being sent to a home for the first time and about 80% are expected to become permanent residents. The proportion of people who become permanent residents in care homes is an important measure – at 7% in 2016, it has decreased from about 10–15% in 2013.
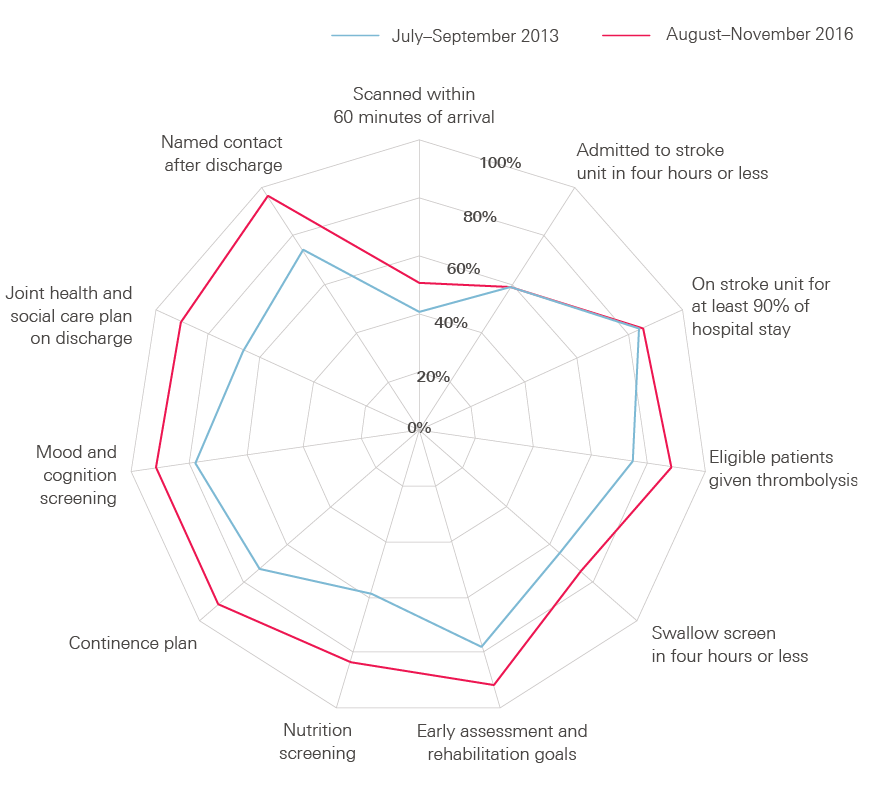
High quality care for people with stroke involves rapid diagnosis and specialist hospital treatment, as well as early assessment by therapists to provide essential care and begin rehabilitation. The Sentinel Stroke National Audit Programme grades NHS stroke services in England, Northern Ireland and Wales on how well they perform on delivering all these different aspects of care. Figure 8 shows that in England, Northern Ireland and Wales, the NHS made substantial progress in improving care from 2013 to 2016, with more clinical teams achieving a grade of ‘first-class’ or ‘good or excellent in many respects’, and a decrease in services where substantial improvement is needed.
Figure 8: Percentage of patients receiving stroke services that meet quality standards in England, Northern Ireland and Wales, July–September 2013 and August–November 2016
Source: Sentinel Stroke National Audit Programme, 2017
The latest data, from August to November 2016, suggest that 93.7% of patients who have had a stroke have a brain scan within 12 hours of arrival at hospital and 50.7% within 60 minutes. Over 88% of patients who have had a stroke and can be treated with ‘clot-busting’ drugs receive this treatment, two-thirds within one hour of arrival at hospital. 58.5% of patients are admitted to a specialist stroke unit within four hours of arrival at hospital, with over 80% seen by a stroke specialist within 24 hours.
Approximately 90% of patients see stroke specialist nurses, occupational therapists, physiotherapists and speech and language therapists within 72 hours, who provide essential care and help improve outcomes – for example, they reduce the chances of patients becoming ill with pneumonia by making early swallow assessments.
However, many patients are not receiving the amount of therapy they need – particularly speech and language therapy, which is rarely available seven days a week. Fewer than a third of patients received a six-month follow-up assessment and, in a 2016 survey by the Stroke Association, over 45% of stroke survivors reported feeling abandoned after leaving hospital.
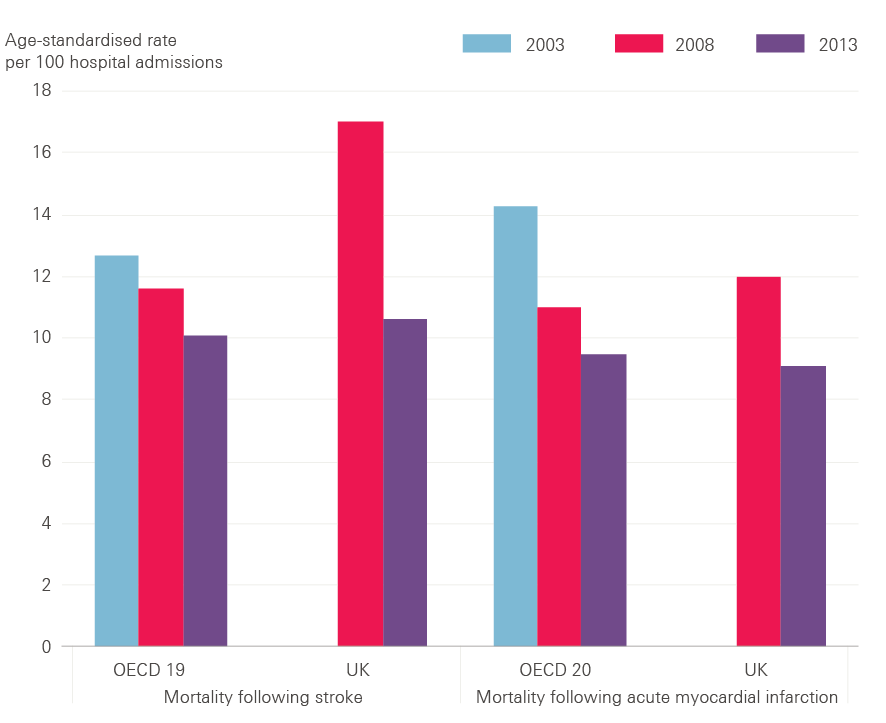
Figure 9 shows that the UK lagged behind OECD countries for stroke mortality in 2008: 17 per 100 people died within 30 days of hospital admission for ischaemic stroke in the UK, compared with an average of 12 per 100 people in OECD countries. But advances in the treatment of stroke have led to a substantial reduction in deaths, and Figure 9 shows that the UK had made rapid improvement to virtually close the gap by 2013.
Figure 9: Mortality following admission to hospital for stroke and acute myocardial infarction, OECD average vs UK
Source: OECD, 2015
Heart attack
Heart attack, also a major cause of death, is caused by the blood supply to the heart being suddenly interrupted.
For the most serious form of heart attack, primary percutaneous coronary intervention (PCI) has been established as the best treatment to re-open blocked heart vessels that cause heart attack. In 2015, 99% of patients in England who could benefit were treated with PCI.
In 2015, 88.6% of all patients in England and Wales were treated with PCI within 90 minutes of arriving at hospital, up from 52% in 2005. This was a slight deterioration from 92% in 2014, but it is unclear if this is normal variation or the start of a downturn in quality. The time from the 999 call to treatment gives an indication of the quality of care provided by the ambulance service and in hospital, as well as the transition between the two. 77% of patients were treated within 150 minutes of a 999 call in 2015, a decrease since 2014 (82%). 90% of patients were discharged from hospital with the appropriate medication.
Heart attack mortality in 2008 was worse in the UK than in OECD countries: 12.0 per 100 people died within 30 days of hospital admission for heart attack in the UK, compared with an average of 11.0 per 100 people in OECD countries. Performance has improved and, although progress has since levelled off, Figure 9 shows that the UK overtook the OECD average by 2013, when 9.1 per 100 people died within 30 days compared with an average of 9.5 per 100 people in OECD countries.
Cancer
In the 2015 National Cancer Patient Experience Survey, participants were asked to rate the overall quality of their care on a scale from zero (very poor) to 10 (very good) and gave an average rating of 8.7, with 94% rating their care as seven or higher.
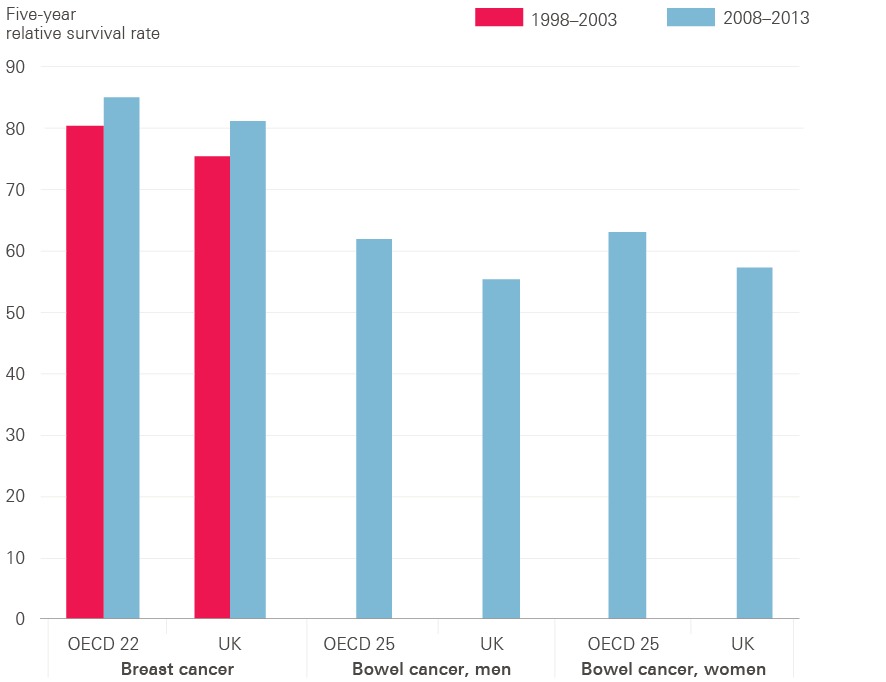
Breast cancer is the third most common cause of cancer death in the UK, with around 11,400 deaths in 2014. The UK performs very well on breast cancer screening, with an average of 75.9% of women aged 50–69 screened in 2013 compared with the OECD average of 60.3%. Survival for people with breast cancer in the UK is improving over time, as with most cancers. One-year survival rates improved by 14% between 1971 and 2010, from 82% to 96%, while five-year survival rates improved from 53% in 1971 to 87% in 2010. The latest available international comparisons of five-year survival rates suggest the UK remains worse than the average for OECD countries. But Figure 10 suggests the UK has gained some ground in the past decade, with a 7.6% improvement in rates between 1998–2003 and 2008–2013, compared with a 5.5% improvement in the average for OECD countries over the same period. Breast cancer mortality rates have decreased by 32% in women in the UK since the early 1970s, but despite this they are currently the 14th highest in Europe.
Figure 10: Breast and bowel cancer five-year relative survival rates, OECD average vs UK
Source: OECD, 2015
With around 40,000 new cases registered every year, bowel cancer is one of the most common cancers in the UK and the second most common cause of cancer death. Around half (57.9%) of people in England who are invited for bowel cancer screening are screened with a definitive usable result within six months of invitation, although uptake rates vary between different parts of the country. There have also been marked improvements in the quality of care delivered by the NHS for patients with bowel cancer. Shorter stays in hospital following major bowel surgery indicate improvements in terms of other treatments like chemotherapy, better decisions on who would benefit from surgery, and advances in care of people after operations. Median time in hospital following major surgery for bowel cancer has almost halved from 13 days in 2004 to seven days in 2015, although the ambition is to reduce this further to five days. It is difficult to compare bowel cancer mortality over time due to changes in how data have been collected, but there is a general trend of improvement, with 90-day mortality following major surgery declining steadily from 5.4% in 2010 to 3.8% in 2015.
Figure 10 shows that the UK’s five-year survival rate for bowel cancer remained below the average for OECD countries in 2008–13. While the UK was above the average for OECD countries for age-standardised mortality rates for bowel cancer in 2003–13, it remained behind France, Australia, Switzerland, Germany and Spain. The UK mortality rate for bowel cancer in 2012 was the tenth lowest in Europe, with five-year survival in men (51%) and women (52%) in England below the average rates for Europe (both 56%).
Conclusion
This briefing began by asking whether public anxiety about the quality of health care in the future was justified based on the experience of the past few years.
If quality was solely about getting speedy access to treatment, then there is reason to be concerned. We have shown in this briefing that the NHS in England has treated more people each year but struggled to meet key waiting time targets for a range of services in the past two years, including ambulance response times, treatment in hospital A&E departments, and the time from GP referral to consultant treatment for planned conditions, including suspected cancer.
This is concerning on two levels. For the person left in pain because their operation is delayed or they are waiting on a trolley, knowing that they are in a minority and that most other people are still treated quickly is cold comfort. But it is concerning on another level. If deteriorating waiting times are a symptom of a shortfall in funding colliding with rising needs, does it mean that other dimensions of quality are deteriorating too?
In this briefing we attempted to assess some of the other dimensions of quality in addition to waiting times. We chose to look at aspects of care for a selection of common acute and chronic serious illnesses, including heart attack, stroke and diabetes, where the data allowed for comparison across time. The picture here is more mixed. There have been real achievements. For example, in the past decade there have been strong improvements in the quality of care for heart attack and stroke, progress that has been recognised internationally. For breast and bowel cancer, and diabetes, there has also been improvement, but for these cancers the NHS is still lagging behind some comparable countries in terms of survival rates.
The one dimension of mental health we looked at, the IAPT programme, shows progress is possible, but it is still only a small step in bridging the gap between mental health needs and the services available.
It has proved difficult to know what has happened to quality more generally. This is partly a scale and complexity problem: we have looked at national averages, but there are persistent inequalities between areas and different groups. But it is also a time-period problem. Assessing whether the improvements we have seen have continued or tailed off, for even a limited set of quality indicators for a limited set of conditions, has proved to be like a book missing its last chapter. Many of the data reports have a time-lag, in some cases by two to three years.
In March 2017, the CQC found that there were examples of high quality care in many hospitals across England, but that all hospitals were facing ‘steadily increasing demand for their services at a time when they are also expected to make unprecedented efficiency savings’. It pointed out a correlation between hospital trust deficits and the ratings of the quality of care: trusts with larger deficits tended to have lower ratings.
The CQC is careful not to make a causal link between deficits and quality of care. But it is difficult to see how the intense financial pressures on all NHS and social care services will not threaten the quality of care in the near future if nothing changes. As OECD analyses have shown, the UK’s performance on quality is middling when compared with other OECD countries, but then so are our funding levels .
The improvements that we have described in the quality of care for conditions such as stroke, come from a combination of sources, including national guidance, resources to invest in infrastructure and data collection. But, above all, these improvements come from the capacity of clinicians and managers to re-design and improve care at the same time as delivering routine care. It’s important to note that such improvements have taken years of investment and effort.
The current plans developed by the NHS in England to improve care require this sort of effort on a much larger scale: for cancer and mental health services, and in general practice, as well as the models of care being implemented across the country.
What should the next government do?
Ensure the NHS has the time and resources to continually improve care, and that the health and social care system is adequately funded and staffed. To do this, the government needs to:
- Address the immediate social care funding gap – for the NHS in England, as a minimum, spending per person must not fall between now and 2020, and must increase in line with GDP growth beyond 2020.
- Develop a national workforce strategy to ensure that enough staff are trained, adequately rewarded and have the right skills to meet the needs of patients now and in the future.
Support the consensus forged by the NHS Five Year Forward View around the clinical strategies for cancer, mental health and primary care, but ensure the NHS:
- Goes further and faster in developing more comprehensive and transparent ways to track quality, at national, regional and local level, alongside the existing waiting time targets.
- Engages with patients, the public and staff to develop a fuller national strategy to maintain quality as the organising principle of the NHS. And as part of this, coordinate plans and policy initiatives to support the health service to maximise the quality of care within available resources.
- Addresses the substantial gaps in data about the quality of primary care, mental health and community services, and achieves a step change in linking data to help scrutinise quality and improve care across clinical pathways.