Foreword
This report looks back at what has changed in cancer care in England over the past 20 to 30 years. The aim is to consider what has worked well, or less well, and why. Importantly the purpose is to learn from the past, so that these lessons can be applied to cancer care and other conditions in the future.
To do this I have worked with colleagues at the Health Foundation to review the commitments made on cancer at a national level and the extent to which they have been achieved. I am also extremely grateful to nearly 70 colleagues who agreed to be interviewed for this project. All of them have been closely involved in the cancer agenda, but from very different angles. They include politicians, journalists, clinicians, NHS managers and those working for cancer charities. Several have had personal or family experience of cancer.
The report considers all aspects of cancer care, from prevention through diagnosis and treatment to living with and beyond cancer. This leaves one notable exception – end of life care – because I believe this merits an analysis of its own – and clearly doesn’t only apply to cancer.
For cancer management as a whole and for each step in the care pathway that a person experiences, we have considered the factors which enable and block improvement. Some clear messages emerge which I hope will be of value to ministers, national bodies and to those both lobbying for or driving change at national and local levels.
Cancer care was still in the dark ages at the start of my career, some 40 years ago. Some patients were still not being told their diagnosis, with relatives often being told rather than the patient. Even the word cancer was frequently avoided, with terms such as tumour, neoplasm, growth, a ‘little ulcer’ (always ‘little’) or other terms being used instead. As a medical student doing a locum week as a house officer, I was once asked by a consultant to tell a patient’s wife that her husband had acute leukaemia. I did my best, but that was far from good enough.
A few years later when I was considering a career in oncology, a very distinguished consultant asked me ‘why would you want to do that? Don’t they all die?’ Fatalism and nihilism among the medical profession was widespread.
Progress was undoubtedly made in the 1980s and early 1990s with evidence of the effectiveness of new treatments for some cancers, including childhood cancers, lymphomas and leukaemias, testicular cancer and breast cancer. However, the UK was slow to respond to these advances. Although cancer charities (the Imperial Cancer Research Fund and Cancer Research Campaign) provided funding for training of medical oncologists (myself included), the NHS failed to create sufficient consultant posts to employ these clinicians once fully trained. Many were forced to emigrate – to the benefit of countries like Canada, but at the expense of this country.
In the early 1990s, when I was a consultant specialising in breast cancer at Guy’s Hospital I remember being phoned by a colleague working in a district general hospital 50 miles away. He wanted advice on whether to give adjuvant chemotherapy to a 32-year-old woman with breast cancer. I asked whether the disease had spread to the axillary lymph nodes, only to be told that surgeons in that city didn’t remove any lymph nodes for analysis. Similarly, on asking about the pathological grade of the cancer, I was told that the pathologists didn’t assess the grade of a cancer. The size of the cancer had not been recorded. At Guy’s I was used to having all of this information on all patients who were referred to me. I was shocked at the difference in approach between hospitals.
This led me to work with the Thames Cancer Registry to look more widely at variations in the care given to women aged under 50 with breast cancer in south-east England. Wide variations were all too clearly apparent, despite consensus guidelines having been published in the late 1980s in the British Medical Journal.
The experts I have talked to in the development of this report agree that publication of the Calman–Hine report in 1995 was the first major wake-up call on cancer care in this country. Inspired by the Chief Medical Officers of England and Wales (Ken Calman and Deirdre Hine) an expert advisory group on cancer set out the principles underlying good cancer care and the broad structure of services needed to deliver such care. However, this report had no formal government backing, nor did it come with funding. It does, however, mark the starting point for this analysis of progress. I chose 2015 as its end point, as it represents the final year of the last cancer strategy for which I was responsible, (published in 2011).
It has been a privilege to come back to the world of cancer after 4 years as Chief Inspector of Hospitals at the Care Quality Commission. This has given me the opportunity to look with fresh eyes at the challenges of whole system change and to make recommendations for delivering improvements in the NHS, both for cancers and for other conditions.
Professor Sir Mike Richards
Former National Cancer Director, 1999–2013
Timeline
1995
Calman–Hine report
Report from the Chief Medical Officers (CMOs) of England and Wales setting out the principles underlying good cancer care and the broad structure of services needed to deliver such care. No formal government backing or funding.
1996
Publication of the first Improving Outcomes Guidance
The first in a series of reports summarising what processes of care were most likely to be associated with the best outcomes for individual cancers. Written by expert advisory groups, these were funded by central government money – £10 million for each cancer – from 1997.
1997
Election of the Labour Government
Action to improve the NHS was a key Labour manifesto commitment. This included specific pledges on cancer – £10 million for implementation of breast cancer guidance and commitments on waiting times for breast cancer.
1998
Smoking Kills white paper
The first ever tobacco control strategy set a target to reduce the prevalence of smoking from 28% to 24% by 2010. This was achieved.
1999
Cancer summit at 10 Downing Street (May)
A signifier of the level of political interest in cancer, Tony Blair, then Prime Minister, convened a cancer summit, and subsequently announced a review of cancer services, plus the creation of a National Cancer Action Team ‘to raise the standard of cancer care in all hospitals’.
Appointment of the first National Cancer Director (October)
The creation of this role, and appointment of Professor Mike Richards gave clear leadership on cancer in the NHS in England.
Foundation of the All-Party Parliamentary Group on Cancer
Set up to be the voice in parliament of cancer patients and their families. It campaigns on multiple issues including early diagnosis, cancer workforce and patient experience.
2000
NHS Plan (July)
Promised thousands of new beds, doctors, nurses and improved hospitals and GP premises. NHS organisations would be accountable for new waiting times targets and expected to deliver care to new national standards. Contained a promise of a comprehensive national cancer plan and £570 million over 3 years for improving cancer services.
NHS Cancer Plan (September)
Set out strategies for cancer prevention, screening, diagnosis, treatment and care. Contained detailed plans for implementation over the next 5 years, including milestones and deadlines with dates attached. Established cancer networks as a vehicle for delivering change. Significant funding attached, identified in NHS Plan.
2002
‘National survey: cancer patients’ – the first national survey of cancer patient experience
Pointed to the existence of major delays in accessing cancer treatment, and significant variation in waiting times and patient experience across the country.
2003
Extension of breast screening programme to seven rounds
Fulfilled an NHS Cancer Plan pledge to widen breast screening from age 50–65 to age 50–70 (an additional two rounds).
Introduction of liquid-based cytology for cervical screening
Fulfilled an NHS Cancer Plan pledge to improve and update the cervical screening programme.
2004
National Audit Office (NAO) report: Tackling Cancer in England, Saving more lives
Recognised that the pace of improvement in cancer services had quickened since The NHS Cancer Plan. Raised concerns about delayed diagnosis, highlighted workforce shortages, and called for more action on geographical and social inequality in access to high-quality care.
2005
NAO report: Tackling Cancer, Improving the patient journey (February)
Encouraging progress had been made since 2000 in most aspects of patient experience. However, still too much variation by geography and cancer type.
NAO report: The NHS Cancer Plan, A progress report (March)
Reported that the NHS Cancer Plan is well constructed, well regarded and delivering positive changes. Cancer networks are working well, but can be improved. Plans will be needed to update the NHS Cancer Plan.
2007
Cancer Reform Strategy
Updated the NHS Cancer Plan and acknowledged progress. Despite all this activity there has been a failure to reduce the gap in survival between comparator countries. Included four major new initiatives, on early diagnosis, survivorship, information and equalities. No additional dedicated funding.
2008
New initiatives established
Following the Cancer Reform Strategy, the National Awareness and Early Diagnosis Initiative, National Cancer Survivorship Initiative, National Cancer Intelligence Network and National Cancer Inequalities Initiative were established.
2010
Coalition government elected
Conservative party manifesto promised action on cancer, including a ‘Cancer Drugs Fund’. They were joined in government by the Liberal Democrats.
Bowel cancer screening introduced
The bowel cancer screening programme started, initially using testing of stool samples, but with a government commitment to introducing flexible sigmoidoscopy to the programme.
2011
Cancer Drugs Fund created
Initially worth £200 million per year, this was designed to give patients access to drugs not routinely available on the NHS.
Improving Outcomes: A strategy for cancer
Landed amid plans for NHS reforms, but did not commit additional money to cancer. It promised action on screening and data, and a maintained focus on improving outcomes.
2012
Health and Social Care Act
Fundamental structural reform to the NHS, with the creation of clinical commissioning groups (CCGs). Devolved responsibility for some functions previously held by the Department of Health to new ‘arm’s-length bodies’ such as Health Education England and Public Health England.
2013
National Cancer Action Team
Disbanded and funding for cancer networks reduced.
2014
Five year forward view
Recognised cancer as a priority and promised action on prevention, faster diagnosis and better care. New models of care established, with a shift towards integration of care. Focused on how to make efficiency savings – no extra funding.
2015
NAO – Progress in improving cancer services and outcomes in England (January)
Reviewed progress since 2011. Outcomes continue to improve, but there is too much variability in outcomes and access across the country. ‘Data gaps’ remain, with more action needed to improve cancer data, particularly around stage at diagnosis.
Independent cancer task force report – Achieving World Class Cancer Outcomes: A strategy for cancer 2015–2020
Written independently but adopted in full by NHS England, the 96 recommendations include a focus on prevention and early diagnosis. Called for investment in new infrastructure and the creation of cancer alliances at an estimated cost of £400 million a year.
Executive summary
This report offers an account of what has changed since 1995 in cancer services in England. It assesses the NHS Cancer Plan and the two subsequent strategies, from 2000 to 2015. We present data on the progress in treatment and outcomes of cancer services (not including end of life care). We also explore what factors might have contributed to success and failure in how cancer services developed. In the absence of formal evaluation of the National Cancer Programme between 1995 and 2015, we conducted interviews with nearly 70 people involved in creating and implementing the cancer programme, to understand what these national strategies were designed to do and how they worked in practice. These included senior clinicians, managers, civil servants and researchers, from the Department of Health, the NHS and charities.
Areas where progress has been made
- Significant improvements have been made on mortality, survival rates and patient experience of cancer care over the past 20 years.
- Progress can almost certainly be attributed to a combination of better service organisation and the introduction of more effective treatments.
- Delivery of care by multidisciplinary teams (MDTs) was the exception rather than the rule 25 years ago. This has now changed radically, though not all teams are functioning optimally.
- The cancer workforce has expanded considerably. Cancer nurse specialists have become the norm, and patients are more likely to receive treatment in specialist centres, where appropriate. But as demand has grown, workforce shortages have re-emerged, particularly in diagnostic specialties.
- Technology for cancer care has improved markedly, both in relation to diagnostics (eg magnetic resonance imaging (MRI), positron emission/computerised tomography (PET/CT) and molecular markers) and new treatments (eg laparoscopic surgery, better targeted radiotherapy and new drugs).
- Data/intelligence on cancer has improved significantly. This can help monitor progress at both national and local levels, though further improvements are still needed.
- Government intervention in the form of anti-smoking legislation has contributed to a steady decline in the largest preventable cause of cancer.
- Measuring patients’ experience of cancer service is now accepted as essential to understanding the quality of care, as is the importance of people’s wellbeing after cancer treatment.
What has driven progress on cancer?
A consistent theme that emerged from many of the interviews was the creation of a broad community for change through the National Cancer Programme between 2000 and 2015. It is possible to distinguish separate components of this that, in combination, were perceived as having created a sense of momentum, particularly among clinicians.
Evidence-based guidance, intelligence and research
- Development of guidance (Improving Outcomes Guidance) for individual cancers setting out the design of services most likely to achieve good outcomes.
- Improved intelligence, including big improvements in cancer registries, the capacity to link with other datasets such as screening and hospital data, good-quality clinical audits for some cancers, and the development of cancer profiles giving comparative information at primary care trust (PCT)/CCG, GP practice and network levels.
- Establishment of cancer research networks, mapped onto the service networks, leading to a tripling of patients entering nationally approved clinical trials.
Infrastructure to make change locally, with support to build capability
- Establishment of cancer networks, which were funded with permanent staff, brought together commissioners, clinicians, managers and patients across organisational boundaries to oversee the local/regional implementation of national strategy, and plan improvement.
- Cancer Services Collaborative (a centrally funded programme using quality improvement methods) worked with clinicians and managers within networks and trusts to redesign services. Cancer networks also had their own development programme to share learning.
- The National Cancer Peer Review Programme (with patients as part of the team) ensured compliance with the recommendations in the Improving Outcomes Guidance, and the results were published to boost transparency.
Adequately supported leadership
- A full-time National Cancer Director from 1999, supported by a national team in the Department of Health, an outward-facing National Cancer Action Team and a dedicated team overseeing cancer screening.
- Clear direction set out in comprehensive cancer plans/strategies and a comprehensive overview of the quality of care being delivered. Data from registries, audits, NHS trusts, screening and research all flowed into the National Cancer Action Team.
- Extensive engagement with key stakeholders and development of a strong cancer community (comprising clinicians, managers, patients, cancer charities, professional colleges and societies, industry and researchers).
- High-level political support, and a strong media focus on cancer, reflecting public interest, fear and concern about cancer.
- Targets for cancer waiting times, supported by intensive support to trusts which were struggling to achieve them.
Adequate funding, and some increases in workforce
- Dedicated funding for some aspects of cancer (especially in the early years of the programme).
- Appraisal by the National Institute for Health and Care Excellence (NICE) of new cancer drugs, with (from 2001) a funding directive to PCTs to make the drugs available within 3 months of a positive appraisal.
- Expansion of the workforce in the early years of the programme, and the introduction of new workforce models (eg the four-tier model for radiographers to enable expansion of breast screening).
Areas where there has been less progress
Despite these improvements, England’s 5-year survival rates (and those of the UK) have not caught up with other comparable countries. With the exception of breast cancer, the gap has not narrowed, as other countries have also improved. The NHS Cancer Plan promised cancer services that would be the best in Europe and that cancer care would never again fall behind. This represents the ‘unfinished business’ that is the theme of this report, and a number of factors have been identified as possible explanations for this.
- The focus in the early years of the programme was largely on secondary and tertiary care. Although the importance of primary care was recognised in both the Calman–Hine report (1995) and the NHS Cancer Plan (2000), it was not clear what actions needed to be taken.
- Until the early 2000s very little health services research had been done on primary care and cancer. This is now an active field of research with high-quality researchers, often funded by the Department of Health and Social Care/National Institute for Health Research (NIHR) and Cancer Research UK. This research has, for example, led to the development of evidence-based guidelines on which patients should be investigated or referred to hospital with possible cancer.
- In the early phases of the National Cancer Programme, too little emphasis was placed on improving the rate of early diagnosis, which accounts, at least in part, for the poor survival rates in England, relative to survival rates in other comparable countries.
- It took time to generate an adequate evidence base and use it to change attitudes. In the early years of the programme, doubts were cast on the validity of the international cancer survival comparisons, as cancer registries were undoubtedly missing some patients. Cancer registration in England is now among the best in the world, however survival rates remain comparatively poor.
- In the late 1990s some cancer experts doubted that delays of a few months in diagnosis could impact on survival rates significantly. This has now changed, as a result of being able to link cancer data with hospital and screening data. This has demonstrated the magnitude of late diagnosis, and its impacts on survival. There is now almost universal consensus on the importance of early diagnosis of symptomatic patients.
- Research has suggested that the gatekeeping model of the NHS (where GPs predominantly have responsibility for providing patients with access to diagnostics and hospital care) may deter patients with possible symptoms of cancer from seeking advice from their GP and may deter GPs from investigating or referring patients.
- New models for access to diagnosis are now being tested, but have not yet been widely implemented.
- Delivering the increases needed in the cancer workforce has been consistently difficult. Diagnostic capacity in particular (endoscopy, imaging and pathology) has not expanded to meet demand and lags behind that in other comparable countries, creating a barrier to early diagnosis. Financial incentives to encourage trusts to increase and maintain their diagnostic capacity have, to date, been inadequate.
- It was only in the later stages of the cancer programme that the needs of people living with and beyond cancer were better understood. A validated measure of quality of life after cancer is still being piloted.
- Variation in quality of secondary and tertiary cancer services undoubtedly persists. However, rigorous assessment of the quality of individual cancer services is no longer routinely undertaken.
- Improving cancer survival has been identified as a key aim in each cancer strategy. Despite this, there has been a lack of accountability for achieving this at a local level.
- Some of the key metrics needed to monitor progress (eg stage at diagnosis) have only recently become available throughout the country.
- The disruption caused by the reforms introduced in 2012 led to a loss of momentum on improving cancer care, which has still not fully been regained. National leadership and support for cancer networks was significantly downgraded, impacting on progress on cancer.
What needs to happen for cancer services to catch up?
The announcement by the Prime Minister (in early October 2018), of a new cancer strategy to form part of the NHS long term plan is extremely welcome. In particular, the Prime Minister focused on early diagnosis and set an ambition to increase the proportion of patients diagnosed at early stage from one in two to three in four people by 2028. This should help to eliminate the gap in survival rates between England (as well as the rest of the UK) and other comparable countries. The Prime Minister also spoke about reducing the age for starting bowel screening to 50 years, investing in scanners and rapid diagnostic centres.
Achieving this goal will be challenging, especially as the proportion of patients being diagnosed at early stage has remained almost static between 2015 and 2017. We know that patients in the UK are uniquely worried about bothering their GP. GPs in the UK are much less likely to investigate or refer patients than those in comparable countries and hospitals are feeling swamped by current levels of referrals (and are failing to achieve the 62-day standard). Based on the experience of the last 20 or so years of the National Cancer Programme, whole-system change will be needed if the unfinished business of closing the cancer survival gap between England and other countries is to be completed.
Actions
- Bowel screening: The change to Faecal Immunochemical Test (FIT) testing should lead to increased participation rates but this needs to be accelerated. Endoscopy capacity also needs to be increased considerably. This could be done by increasing the non-medical endoscopy workforce. Current endoscopy capacity could also be released by introducing FIT testing in primary care for patients with low-risk colorectal symptoms. This has recently been shown to be safe and effective in a paper from Denmark, published in the British Journal of Cancer. However, it will require a major shift in primary care practice. Lowering the age of first bowel screening to 50 (as per the Prime Minister’s conference commitment) will improve outcomes, but will require further expansion of capacity.
- Early detection of lung cancer: The recently announced results of the NELSON trial are very encouraging, showing a 26% reduction in lung cancer mortality among men at high risk of lung cancer who underwent serial low-dose CT scans. Importantly, the proportion of patients who were diagnosed with operable (early stage) disease increased to 67%. We need to ensure that the findings from these studies are translated to benefits for patients as soon as possible.
- NICE Guideline implementation: NICE Guideline 12 should be fully implemented. This guideline recommends that GPs should investigate patients who have symptoms which indicate a 3% or higher risk of cancer. However, these guidelines have not yet been fully implemented and efforts are being made to increase GP awareness. Some, but not all, CCGs have changed their referral templates to comply with the guidelines and tools are being developed to assist GPs in assessing levels of risk. Much more work will be needed to change GP practice (and raise public awareness about symptoms of possible cancer).
- Rapid diagnosis centres: The government should be ready to act quickly to spread learning from the Accelerate, Coordinate, Evaluate (ACE) Programme (run by Cancer Research UK), as evidence emerges of benefit to patients with non-specific symptoms. Although a primary aim would be to diagnose cancer earlier, these centres would also facilitate earlier diagnosis of other significant conditions. These could (and possibly should) be located outside acute hospitals for convenience for patients, and so that diagnostic facilities are not competing with those needed for emergency care pathways.
- 62-day standard: It will be important to continue to measure the timeliness of investigations and treatment within hospitals, though modifications of the 62-day standard should be considered as new pathways evolve.
- Diagnostic workforce and equipment: More patients will undoubtedly need to be investigated. This will require more CT, MRI and endoscopy facilities and an increase in the associated diagnostic workforce. Changes in skill mix need urgent consideration, as does exploring the potential of outsourced reporting (if necessary to other countries) and artificial intelligence (AI).
- Prevention and personalised care: The push for earlier diagnosis should not be at the expense of investment in prevention (which will require reversing cuts to public health budgets as well as cross-government effort on the causes of obesity, smoking and excess alcohol consumption) or further progress in supporting cancer survivors after treatment. Success in early diagnosis will mean more people living after cancer: enabling their wellbeing and health is crucial.
- Funding and accountability: Decisions will be needed on where accountability lies for earlier diagnosis (and thus improved survival) as this will require concerted efforts from public health, primary and secondary care. Integrated care systems might be given responsibility for this, but whichever bodies are funded (whether cancer alliances, sustainability and transformation partnerships or integrated care systems) will need to produce credible plans and have progress transparently monitored.
-
Monitoring: Key metrics will include:
- uptake of screening (especially bowel) and outcomes
- uptake of ‘case finding’ for lung cancer and outcomes
- GP awareness and compliance with NICE Guideline 12
- referrals to diagnostic centres and conversion rates
- stage at diagnosis (by cancer site and age)
- 1- and 5-year survival
- emergency presentations
- 2-week wait, and 62-day standard compliance (or modifications)
- reduction in unwarranted variation of any of the above.
- Progress reports: Public Health England’s National Cancer Registration and Analysis Service (NCRAS) should be charged with producing regular (monthly or quarterly) reports on progress, both nationally and locally.
- Attitudinal change: Perhaps the greatest challenge will be making these changes work with the grain of the current NHS gatekeeping model. This will require: giving the public faster and easier access to primary care and/or diagnostic services and encouraging them to present earlier when they have symptoms; encouraging GPs to lower their thresholds for investigating and referring patients; ensuring that commissioners do not block referrals and that hospital clinicians and managers welcome, rather than discourage, referrals (subject to reducing current capacity restraints). All of this will require building support for the changes across the NHS as well as providing the necessary funding. Some of this funding will need to be used for building capability and supporting cancer alliances to work with other local NHS partners to improve services.
Lessons for the future?
This report describes what was attempted to build support for the earlier phase of the National Cancer Programme. The actions described above would require a similar effort but across broader territory, including primary care. From our analysis of what has gone before, it is possible to identify a set of ingredients that have to fall into place to improve the diagnosis, treatment and care of patients, whether in cancer, or any other condition:
- Belief (at all levels of the system) that there is a problem that needs to be addressed.
- An understanding of what the drivers of that problem are.
- Data to accurately monitor the drivers and the outcomes of interest.
- Interventions to address the problem, with evaluation built in.
- The resources to supply the interventions, for example, workforce or capital investment.
- Support and encouragement for implementation (local capability and national support).
- Accountability for improvement.
Looking back over the past two decades in relation to cancer in England, although national strategies since 1995 have repeatedly described the problem to be solved (poor cancer survival) (1), some of the subsequent ingredients listed have only very recently fallen into place. It took the best part of a decade to develop both belief (1) and an understanding (2) of how important a role late diagnosis was playing in England’s poor cancer outcomes, and insight into the factors that might be inhibiting patients from coming forward, and general practitioners from referring.
It is only in the past few years that data (3) has been collected systematically across the country on stage of cancer at diagnosis for each patient, a metric crucial to monitoring progress in the various interventions being tried, including earlier rapid diagnosis and expanded screening programmes. But, although many of the factors are now in place for accelerating progress in early diagnosis, austerity and the disruption in the wake of the 2012 NHS reorganisation has disrupted other key components, for example, the capability and accountability for making change happen at local level. Although the wheels are now turning again in the form of cancer alliances, integrated care systems and sustainability and transformation partnerships, momentum was lost at national and local level and has had to be rebuilt.
Our report highlights the importance, above all, of the human infrastructure that needs to be in place to wield the soft power that is crucial to engage support and motivate clinicians and managers across a complex service. Many of the ingredients listed require attention to be given to beliefs and behaviours, alongside the evidence and skills to implement change. Without these, the injection of resources will not be effective.
Introduction
On 20 May 1999, in a statement to the House of Commons, Tony Blair, then Prime Minister, announced that he was hosting a high-level seminar on cancer later that day at Number 10 Downing Street. The seminar would bring together experts on cancer, from prevention to screening and treatment, including senior clinicians and researchers from the NHS, leaders from the voluntary sector and a patient representative. The statement went on:
All people, wherever they live, should have access to high-quality cancer services. This was the aim of the Calman–Hine report A policy framework for commissioning cancer services. However, when the Calman–Hine principles were adopted in 1995, no machinery to monitor progress was established. We are now rectifying that omission.
Described by Tony Blair in the Daily Mail as a crusade to ‘save 60,000 lives’, the press release following the meeting announced a number of proposals, including a new National Cancer Action Team, more challenging targets, new guidelines and the first-ever national survey of cancer patient experience. A large amount of machinery was put in place in the months following the seminar, which culminated in The NHS Cancer Plan, published in September 2000.
The NHS Cancer Plan aimed to be the first large-scale, centrally driven effort to improve services and outcomes for a specific disease in the NHS in England. At its zenith, a team of civil servants in the Department of Health was complemented by the outward-facing National Cancer Action Team, comprising NHS managers and clinicians, both led by a full-time National Cancer Director. More than 70 people worked to assemble evidence, commission research, develop and distribute data, support networks of local clinicians and managers, and monitor progress across the NHS.
Three national cancer strategies have followed, the most recent published in 2015. Cancer remains a national priority, one of only two clinical areas singled out in the Five year forward view in 2014, and there are indications that it will be prioritised in the forthcoming 10-year plan. But much of the centralised improvement infrastructure set up after 2000 was either scaled back or broken up and moved into different bodies in the wake of the 2012 Health and Social Care Act. National cancer waiting time targets remain and are still the object of political and media scrutiny, but the continuing effort expended on improving outcomes and quality of care is much less visible.
The ambitions behind the first cancer plan were bold: to raise the level of cancer services to be the ‘best in Europe’, and to build for the future ‘so that the NHS never falls behind in cancer care again.’ These ambitions have fallen short. In 2018, the CONCORD-3 study of international cancer survival published its most recent data, for 2000 to 2014. Although survival rates have improved for almost all cancers, the UK has still not caught up with other European countries – with the exception of breast cancer, where the gap has narrowed.
This report does not attempt to provide a comprehensive evaluation of the NHS Cancer Plan and its subsequent strategies between 2000 and 2015. Instead, drawing on documents, official data and oral evidence from almost 70 people involved in its creation and implementation, the report aims to provide an account of what these national strategies were designed to do and how they worked in practice. A full list of those we interviewed is available as an appendix. We have also analysed data on the progress in treatment and outcomes of cancer services in the same period, and we consider what factors might have contributed to success and failure in how cancer services developed.
Our aim is to draw out learning for the future, not least for the policymakers currently pondering how to invest (and account for) the additional resources that have been promised by the government. There are striking parallels between today and the year 2000: extra resources announced after a period of underfunding, coupled with high expectations on the part of politicians under pressure to demonstrate tangible results to patients and the voting public. In 2000, there was also an urgent sense that improvement hinged on the engagement and mobilisation of the clinical workforce, a workforce described by the NHS Cancer Plan as ‘overworked, run off their feet, and exhausted’.
Background: policies and pledges from 1995–2015
1-1 Calman–Hine: 1995–1997
In his foreword to The NHS Cancer Plan, Secretary of State Alan Milburn hailed it as the ‘first ever comprehensive strategy to tackle the disease’. This was mostly true: the NHS Cancer Plan covered everything, from prevention and screening, through to end of life care. But with respect to the services that diagnosed and treated cancer, the plan built on foundations laid under the previous government. In 1995 the Chief Medical Officers of England and Wales, Kenneth Calman and Deirdre Hine, published A policy framework for commissioning cancer services, commonly referred to as the Calman–Hine report. It contained proposals for changes to cancer services that reached deep into the NHS, and particularly into the way doctors and other professionals organised their work.
Driven by the principle that all patients should have access to uniformly high standards of treatment and care, Calman–Hine recommended the creation of cancer units in district general hospitals, with a full range of supportive services coordinated by a lead clinician. More specialised treatment was to be centralised in cancer centres, based in larger hospitals, serving populations of 1 million people or more. The report also recommended that cancer networks be created to link all these services, across hospitals and general practice. Within hospitals, all patients should be managed by MDTs, bringing together surgeons, oncologists, nurses and other professionals, essential to decide on the right course of treatment for each patient. This kind of collaborative approach, according to one of the NHS managers involved in the subsequent NHS Cancer Plan, was rare in the 1990s:
… although it seems almost impossible to think about today, the colorectal surgeon was not talking to the pathologist, even in his own organisation necessarily, and certainly would not automatically have an oncologist involved in cases.
Teresa Moss, former Director, National Cancer Action Team
Calman–Hine was badged as ‘guidance for purchasers and providers of cancer services’. It was pulled together by a small team of clinicians and academics with support from civil servants, but, as one of its authors remembers, it did not have strong backing from ministers, nor did it have much clout from the Department of Health in terms of implementation:
Ken [Calman] wanted to make this initiative (on cancer) but he did not have funding on any scale from the Department of Health or government. They weren’t interested in spending new money at that stage. So the format was advice to commissioners. ‘You’ve been given these pearls of wisdom, please do it without any resource.’
Peter Selby, Professor of Cancer Medicine, University of Leeds
There was, however, some central funding for the development of a series of service guideline documents which followed the report. These summarised what processes of care were most likely to be associated with the best outcomes for individual cancers. They were produced by an expert advisory group, chaired by Professor Bob Haward. The first was on breast cancer (published in July 1996), followed by colorectal cancer (November 1997), lung cancer (June 1998), gynaecological cancers (July 1999) and upper gastrointestinal (GI) cancers (January 2001). These reports became known as ‘Improving Outcomes Guidance’ or ‘IOGs’, a programme initially managed under the auspices of the NHS Executive, but subsequently transferred to the (then) National Institute for Clinical Excellence (NICE). Cancer networks were expected to implement the recommendations from each guidance document, which, from 1997, were accompanied by £10m of recurrent funding for each cancer.
1-2 1997: the arrival of New Labour
Cancer was the only condition singled out in Labour’s 1997 manifesto, with a promise to ‘end waiting’ for surgery for patients with breast cancer. But no timescale was specified, nor funds committed to reduce waiting times. Labour’s initial approach to the NHS was to free up savings by abolishing the internal market, and spend the proceeds on front-line care. Eager to evade their reputation as a tax-and-spend party, they committed to staying within the previous Conservative government’s planned spending allocations for the first 2 years of the administration, which meant only small real terms increases for the NHS. Accordingly, there was little decisive action taken to change the shape of NHS services between 1997 and early 1999, except dismantling some (but not all) elements of the internal market. Other developments did occur that were to prove important in relation to cancer. These included the first-ever tobacco control strategy, Smoking Kills, in 1998, which set a target to reduce the prevalence of smoking from 28% to 24% by 2010.
In May 1999, Tony Blair convened the cancer summit at Number 10 Downing Street and subsequently announced a review of cancer services, plus the creation of a National Cancer Action Team ‘to raise the standard of cancer care in all hospitals’. By October 1999, Professor Mike Richards had been named as the first National Cancer Director.
Pressure on the government to take more decisive action on the NHS increased that winter, driven by media pressure, and the results of the EUROCARE-2 study which showed that cancer outcomes in England were lagging behind other countries. Nick Timmins, then correspondent at the Financial Times, remembers the impact:
… you start getting international comparisons appearing, and we’re not doing so well on some things and we’re particularly not doing so well on cancer. The OECD are suddenly saying, ‘It looks like the NHS isn’t getting terribly good results. It’s not spending very much, but maybe it’s not getting very good results either.’ You get that winter of ’99–2000, where the department’s analysis shows they actually did better than the winter before, but the headlines were just awful, just awful.
1-3 The NHS Cancer Plan
In the first days of the new millennium, news emerged that Mavis Skeet, a 74-year-old woman with oesophageal cancer, had had surgery postponed four times because of bed shortages, amid a winter NHS crisis exacerbated by flu. By mid-January, her cancer had become inoperable.
The result of this cumulative pressure was a radical shift in Labour’s position on NHS spending. In January 2000, on a breakfast television show, Tony Blair announced that Labour would bring NHS spending up to the EU average within 5 years. In the budget 3 months later Gordon Brown, then Chancellor of the Exchequer, announced that spending on the NHS would rise by 6% on average (double the average growth of the previous 20 years). In return for this increase, the government was determined to reform NHS services in England. The NHS Plan, published in July 2000, promised thousands of new beds, doctors, nurses and hundreds of new hospitals and GP premises. Medical staff would be subject to new contracts, NHS organisations would be accountable for new waiting times targets (a ‘war on waiting’) and expected to deliver care to new national standards. The NHS Plan also contained a promise of a comprehensive national cancer plan and £570m over 3 years for improving cancer services.
The remit of the NHS Cancer Plan, published in September 2000 was broader than Calman–Hine. It set out strategies for prevention, screening, diagnosis, treatment and care, and it also had earmarked funding. Unlike Calman–Hine, it contained detailed plans for implementation over the next 5 years, including milestones and deadlines with dates attached. But it built on its predecessor report in important ways, particularly through the use of cancer networks as the main vehicle for improving services, with MDTs, supported by evidence-based guidance, as the driver of improved care for patients.
Targets were set for speeding up diagnosis and treatment. By 2005, the NHS was to deliver a maximum 1-month wait from diagnosis to treatment for all cancers, beginning with breast cancer in 2001. Childhood cancers, testicular cancer and acute leukaemia, which were already achieving this standard, were set a more exacting challenge: to begin treatment within 2 months of an urgent GP referral. All cancers would be expected to meet this standard by 2005, with breast cancer leading the way by 2002. The overall goal was to have all patients with cancer beginning their treatment within 1 month of urgent GP referral by 2008.
Money was set aside for new equipment (for example 50 new MRI scanners, and 200 CT scanners), staff (1,000 additional cancer specialists by 2006), and for access to 13 new drugs that the recently created NICE was expected to recommend in 2001. Screening programmes were to be expanded: an extra 400,000 women would receive breast screening, pilots launched for bowel cancer screening and prostate-specific antigen (PSA) tests made available to all men who wanted them, subject to informed choice. The NHS Cancer Plan also announced the creation of a National Cancer Research Institute, to have an overview of research and plug any gaps. Progress was to be monitored by the newly formed Commission for Health Improvement, and a process of peer review.
Progress in implementing the NHS Cancer Plan was subject to considerable scrutiny. The Department of Health issued its own updates, in 2001, 2003 and 2004. The first survey of cancer patient experience was published in 2002. The National Audit Office (NAO) also produced a suite of reports in 2004 and 2005: Tackling cancer in England, saving more lives (March 2004), Tackling cancer: improving the patient journey (February 2005) and The NHS Cancer Plan: A progress report (March 2005).,,
By 2006, all cancer waiting time standards were being achieved (including 2 months – or 62 days – from urgent referral to first treatment).
1-4 The next stage: The Cancer Reform Strategy 2007–2010
The NAO’s final report in 2005 noted that there were no plans in place to update the NHS Cancer Plan. That soon changed, as the achievement of many of the targets (and the spending of allocated funding) led many in the cancer world to feel that a new strategy would be needed to maintain momentum. Unlike the NHS Cancer Plan, which had been put together by a small group of clinicians led by the National Clinical Director, the new strategy was developed by a much broader coalition of clinicians, researchers and charities.
The resulting Cancer Reform Strategy, published in 2007, acknowledged progress on many fronts, including a larger workforce and shorter waiting times. But it also flagged the gap in survival between the UK and other countries despite all this activity. Once again, a promise was made to catch up:
By 2012 our cancer services can and should become not only among the best in Europe but among the best in the world. This is the aspiration that drives this Cancer Reform Strategy.
Department of Health, Cancer Reform Strategy
There was to be more action on prevention (targets to reduce child obesity as part of a cross-government obesity strategy and public information on the risks of alcohol consumption) and extensions to screening, including more rounds of breast screening and the rollout of bowel screening from 2010. The overall length of targets remained the same, but their scope was broadened. More patients were to be included in the 62-day target from referral to treatment, including those from screening programmes or referred via other consultants. And for women with any breast symptoms, the 2-week wait to be seen by a specialist was to be applied, even if their GP did not suspect cancer. Pledges were also made to improve access to surgery (including training in new forms of surgery), more radiotherapy, and more consistent geographical access to chemotherapy, underpinned by better data.
The Cancer Reform Strategy also contained four major new initiatives on early diagnosis, survivorship, information and equalities. The National Awareness and Early Diagnosis Initiative was designed to boost research into the barriers faced by patients, and stimulate innovation in information campaigns. It represented the first concerted effort to tackle late diagnosis of cancer, which was (and still is) believed to be one of the main causes of the UK’s comparatively poor survival rates. The National Cancer Survivorship Initiative (NCSI) aimed to improve the quality of life for people after cancer treatment, while information and data on cancer were to be improved through the National Cancer Intelligence Network (NCIN). Finally, the persistence of inequalities in access and outcomes was to be tackled by a new National Cancer Equality Initiative.
The actions set out in the Cancer Reform Strategy did not come with any additional funding, and local commissioning bodies were expected to deliver them. Since 2007, much effort had been expended on the development of commissioning skills in PCTs (a programme known as ‘World Class Commissioning’) but, since the late 1990s, the vehicle for local cancer improvement had been the cancer networks (which had reduced in number from 34 to 28). The Cancer Reform Strategy devoted several pages of detail about how cancer networks were to work with PCTs and strategic health authorities (SHAs).
But two events happened in the next two and a half years, which radically altered the structure of the NHS and the environment for all public services. The first was the banking crisis in 2007/08, which led the Labour government to divert public funds to stabilise the financial sector, and tipped the economy into recession. The second was a general election, which brought three terms of Labour government to an end in 2010.
1-5 All change please: 2010 and its aftermath
In the 2010 election campaign, the Conservative party promised to tackle the ballooning public sector debt, and stabilise the economy, which had taken a downturn after the 2008 crisis. Both Labour and the Conservatives pledged to implement flexible sigmoidoscopy for bowel cancer screening, while Labour promised an additional £1bn fund to improve cancer diagnostics. The Conservatives offered a £200m Cancer Drugs Fund, but otherwise reassured the electorate that there would be no ‘top-down’ NHS reform. Comparatively little attention was paid to the elaborate plans developed by the shadow Secretary of State for Health, Andrew Lansley, while in opposition. These included sweeping away many of the existing local and regional commissioning bodies, creating GP-led commissioning groups, setting up an arm’s-length body for health and much greater use of the market, to drive an outcomes-focused, self-improving NHS, free of political ‘meddling’.
The 2010 election produced no overall majority. The Conservatives and the Liberal Democrats formed the first peacetime coalition since 1930, and work began on policies to reduce the ‘record public debt’. One early action taken was the creation of a Cancer Drugs Fund, to fulfil a Conservative manifesto commitment. This fund, which began in 2011 and was worth £200m per year, was designed to give patients access to drugs which were not routinely available on the NHS.
Meanwhile, Andrew Lansley, now Secretary of State for Health, pressed on with his reform plans, publishing a white paper in July 2010, which eventually led to the 2012 Health and Social Care Act, after a great deal of opposition.
This backdrop of radical reform at a time of financial austerity was evident in the next cancer strategy that was produced – the first under the new coalition government – in 2011. Improving outcomes: A strategy for cancer, acknowledged the work of those in the previous cancer initiatives, but once again flagged up the stubborn gap between England and comparable countries, this time quantifying it in terms of lives: 10,000 lives could be saved a year if England’s survival rates were as good as the best in Europe., The 2011 strategy was steeped in the language of Lansley’s reform programme: outcomes were paramount, and patients and front-line clinicians were to be empowered, not to be driven via a ‘top-down hierarchy’.
As in 2007, there was no new investment on offer and a hint of how challenging this period would be was contained in the Secretary of State’s foreword to this report. Although, he wrote, the NHS had done comparatively well in the October 2010 Spending Review (the NHS would get small real terms increases, unlike many other government departments). The uplift represented ‘the toughest settlement the NHS has faced for a long time’. Meanwhile, the ambitious pursuit of better outcomes would be the job of PCTs, ‘until they are abolished, and their functions in the relevant area transferred to consortia, local authorities and the NHS Commissioning Board’.
The strategy maintained the focus on national leadership (by retaining the National Cancer Director) and the role of the Implementation Advisory Group to help monitor its delivery. The strategy was not clear about where the National Cancer Action Team would sit under the reformed NHS, and suggested both it and (former) NHS Improvement might become social enterprises. Funding was continued for cancer networks, but the paper hinted that these would also need a ‘new style’ once GP consortia – clinical commissioning groups (CCGs) – were up and running.
Better data were promised, including new data to be collected on stage of disease. Screening was again extended, including a wider age range for breast cancer (as part of a large clinical trial) and early implementation of flexible sigmoidoscopy for bowel cancer, with full rollout by 2016. Screening was now to be run by the new Public Health England, which would also take the lead on raising patient awareness on early diagnosis.
The strategy listed a range of desired improvements in treatments, including more use of radiotherapy and the most up-to-date surgical techniques. Some of the core principles of Calman–Hine remained in place, for example the continued use of the Improving Outcomes Guidance, MDTs and peer review (albeit the latter subject to being ‘streamlined’). But networks received very limited attention: instead the driver of improved cancer services was to lie with the new GP consortia which, the report noted, were too small individually for optimal commissioning of a complex service such as cancer, and were likely to have to collaborate. It was up to the new consortia in the future to determine whether ‘to continue getting advice and support from networks or to seek such support elsewhere’.
In 2015, the NAO published its appraisal of progress on the 2011 Strategy. It said that survival was improving, but survival rates remained about 10% lower than the European average. There were still persistent variations in access and treatment around the country, and between groups of patients, for example between older and younger patients.
Although staging data had improved in its completeness, the NAO was unhappy that data on cost and efficiency had not improved, and data more generally were not flowing as quickly as it should, hampering commissioning and evaluation. The report noted ‘It is also unclear whether any one organisation, at a national level, has oversight of cancer commissioning across a range of complex treatment pathways’.
The NAO also warned that there was a risk that progress in improving cancer services and cancer information could stall as a result of the 2012 reorganisation, pointing to the downgrading of the National Clinical Director from a full-time to a part-time post, the disbanding, in 2013, of the National Cancer Action Team and the major reduction in funding and staff for the 28 cancer networks.
The mood music at the time was around not having a disease-specific focus, which was seen as a good thing in terms of benefitting cross-disease working etc. I do buy into that rationale to some extent, but essentially it meant that you had a cancer strategy with no real sense of where initiatives in it sat in relation to the wider system, uncertainty over who was really driving it, who was really responsible.
Emma Greenwood, Director of Policy and Public Affairs, Cancer Research UK
1-6 The Five year forward view and beyond
The first substantive vision for the re-engineered English NHS came in the form of the Five year forward view, published in 2014 by NHS England. There was a heavy emphasis on new models of care as a route out of the intense financial and demographic pressures facing the service, but cancer featured, along with mental health, as a priority area.
In the absence of a central cancer team, and a lack of capacity at the Department of Health and NHS England, development of the next (and current) 5-year strategy was handed to an independent cancer task force led by Sir Harpal Kumar, then Chief Executive Officer of Cancer Research UK. The task force published its report Achieving world-class cancer outcomes – A strategy for England 2015–2020 in July 2015. The 96 recommendations were accepted in full. The 2015 strategy called for more progress on prevention, including reducing smoking prevalence to 13% (21% for routine and manual groups) by 2020 and to 5% by 2035. It also recommended a big push towards more rapid diagnosis, aiming for 95% of patients referred by a GP to wait less than 4 weeks for a cancer diagnosis or for cancer to be excluded (and 50% within 2 weeks) by 2020. This would mean a big expansion in diagnostic capacity, and improving the availability of some diagnostic tests to GPs.
Better patient experience would come from all patients having access to test results online, and clinical nurse specialists (CNS) available to all patients to coordinate care. In addition, the quality of life for cancer survivors merited considerable attention, including the development of a quality-of-life measure by 2017. Progress would depend on investment in new infrastructure – replacement and upgrades for all linear accelerators (linacs) and molecular diagnostics, and plugging workforce gaps, especially in diagnostics, oncology and CNS. Finally, the report also recommended creating cancer alliances – a revived form of cancer network – to bring commissioners, providers and patients together, to ‘drive and support improvement’.
These changes were estimated to cost £400m per annum. Once again, a closing of the gap between England and the best of Europe was the prize, with an additional 30,000 patients a year surviving 10 years or more. Progress reports against delivery of the strategy are released yearly by NHS England, while its board also actively monitors elements of the strategy which were priorities in the Five year forward view, namely faster diagnosis and replacing radiotherapy equipment, in addition to existing cancer waiting times targets.
Headline progress
At a national level, there are four key measures for tracking progress on cancer. These are: the number of new cancers being diagnosed (incidence), mortality, survival and patient experience. This section looks at the broad trends in each of these, over an extended time period.
2-1 Incidence
Figure 1: Number of newly diagnosed cancers between 1979 and 2015 by sex, England
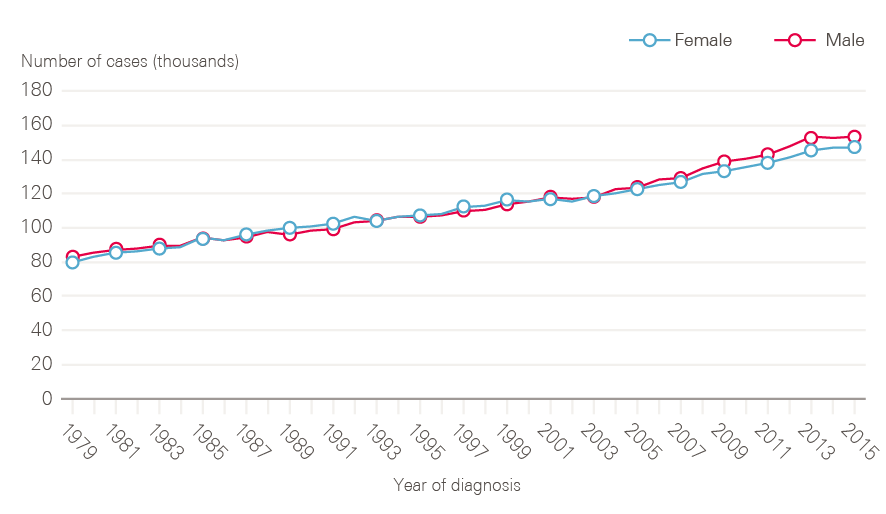
Note: All cancers excluding non-melanoma skin cancer.
Data provided by Cancer Research UK, July 2017. Source: Office for National Statistics. Available at: cruk.org/cancerstats
The number of new cases of cancer in England has risen steadily over time (Figure 1). In 2015, there were 299,923 cancers registered (excluding non-melanoma skin cancers), equivalent to 822 new cases of cancer per day. This represents a 40% increase in cancer incidence over 20 years.
Figure 2 shows age-standardised incidence rates, which take account of demographic change (ie the growing proportion of people surviving longer). These have also risen, by 3% in 20 years in males (648.8/100,000 in 1995 to 667.4/100,000 in 2015), and by 16% in females (from 469.6/100,000 in 1995 to 542.8/100,000 in 2015) indicating that increases in absolute numbers of cases are not simply a product of an ageing population.
Figure 2: European age-standardised cancer incidence rates between 1979 and 2015 by sex, England
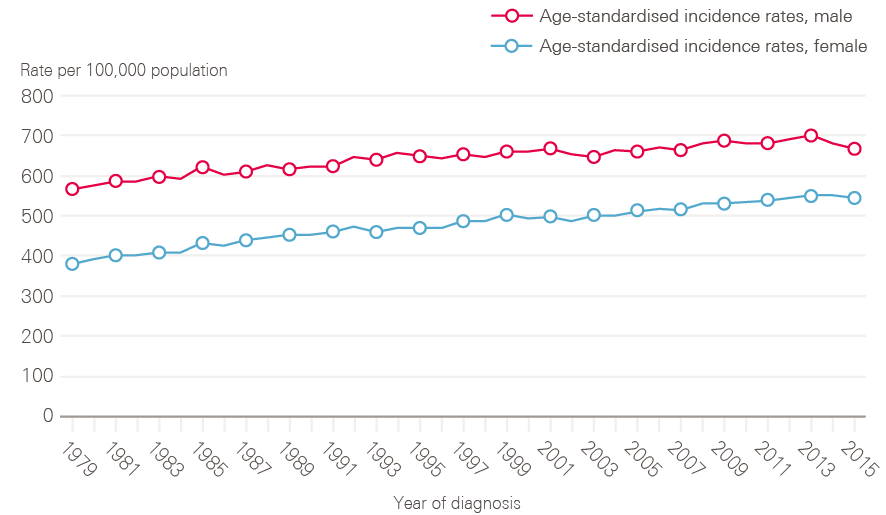
Note: All cancers excluding non-melanoma skin cancer.
Data provided by Cancer Research UK, July 2017. Source: Office for National Statistics. Available at: cruk.org/cancerstats
Figure 3: New cases of bowel, lung and prostate and haematological cancers in males between 1979 and 2015, England
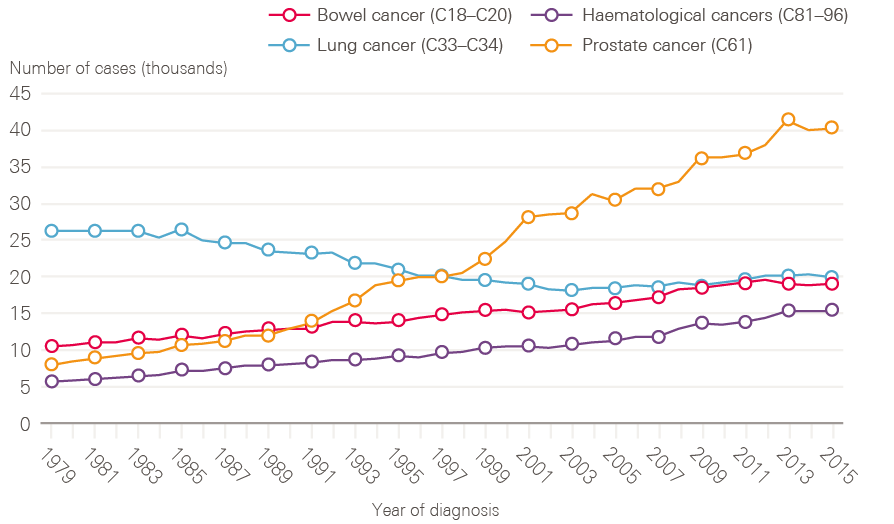
Data provided by Cancer Research UK, July 2017. Source: Office for National Statistics. Available at: cruk.org/cancerstats
A few cancers dominate, for both sexes. Breast (15.2%), prostate (13.4%), lung (12.7%) and colorectal (11.5%) cancers continue to account for more than half of the cancer registrations in England for all ages combined. For men, while lung cancer cases have fallen in line with decreased smoking rates in earlier decades, cases of prostate cancer have risen rapidly, and now account for one in four (26.1%) male cancer registrations, likely a result of increased PSA testing (Figure 3).
Figure 4: New cases of bowel, lung, breast, ovarian and haematological cancers in females between 1979 and 2015, England
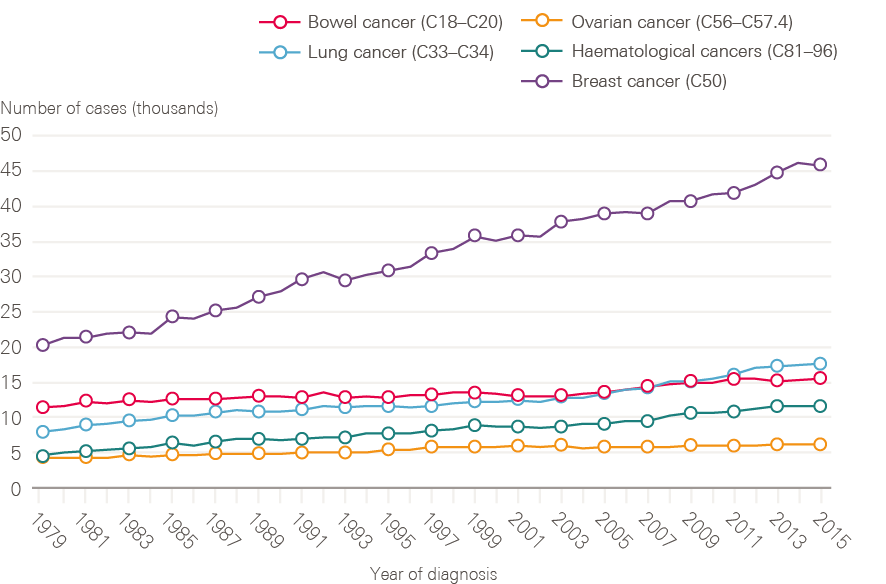
Data provided by Cancer Research UK, July 2017. Source: Office for National Statistics. Available at: cruk.org/cancerstats
Although smoking rates among men have declined steadily from a post-war peak, for women rates continued to climb until the late 1960s, only reducing significantly from the mid-1970s. This is reflected in lung cancer incidence in women, which has continued to rise (Figure 4). Breast cancer incidence has also continued to rise steadily, and in 2016 breast cancer accounted for nearly one in three (30.8%) of all malignant female cancer registrations.
Rates of cancer incidence vary across the country, from 556.7 per 100,000 people in London to 630.3 per 100,000 people in the North East. There are also inequalities in incidence by demographic groups, with rates of lung and other smoking-related cancers more common in manual workers, and breast and prostate cancer proportionately more common among more affluent groups.
2-2 Mortality
Increasing cancer incidence in England has been balanced by improvements in survival, such that the number of deaths from cancer has remained broadly constant over time (Figure 5). There are around 135,000 deaths from cancer each year in England, with cancer accounting for around 30% of deaths in men and 25% of deaths in women. The steady fall in age-standardised cancer mortality (Figure 6) is in part due to improvements in diagnosis and treatment, but also a reflection of reductions in incidence rates for some cancers with very poor prognosis, especially those linked to smoking.
Figure 5: Number of deaths from all cancers between 1979 and 2016, England
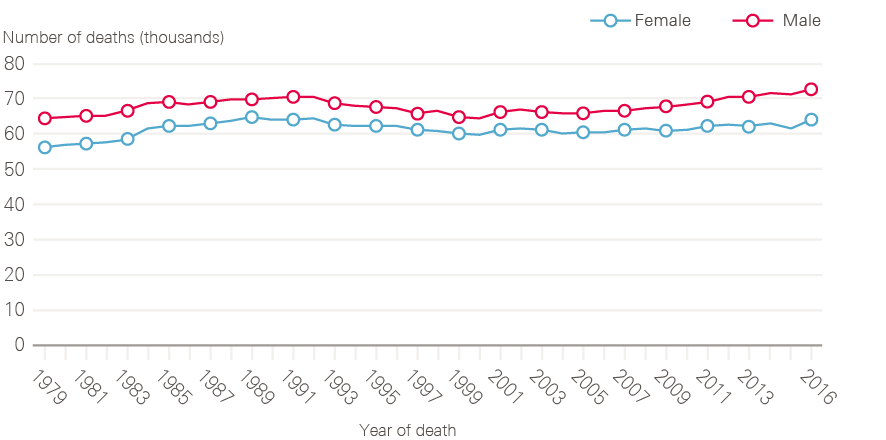
Data provided by Cancer Research UK, July 2017. Source: Office for National Statistics. Available at: cruk.org/cancerstats
Figure 6: European age-standardised mortality rates for all cancers combined between 1979 and 2016, England
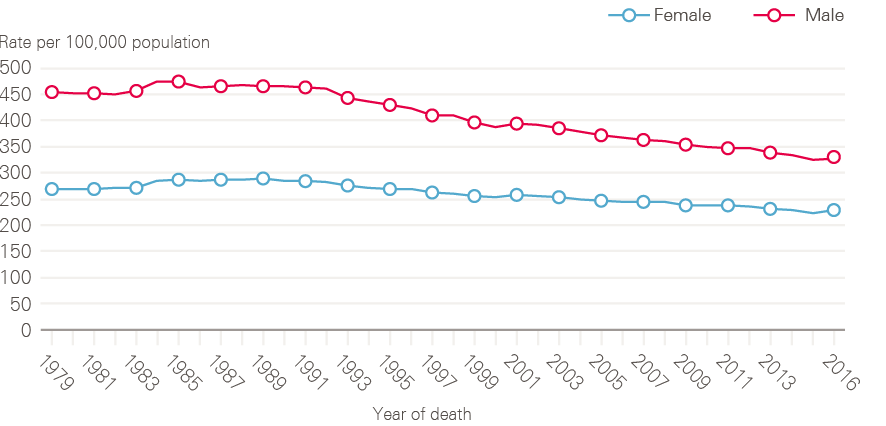
Data provided by Cancer Research UK, July 2017. Source: Office for National Statistics. Available at: cruk.org/cancerstats
Although lung cancer survival has improved, it remains poor. The reduction in incidence of lung cancer in men is reflected in a decline in death rate through the 1990s (Figure 7). The reverse of this trend is seen for women, in whom both the number of lung cancer cases and death rates continue to increase (Figure 8). This is, at least in part, explained by the fact that smoking rates continued to increase in women long after they had started to decline in men.
Figure 7: Number of male deaths (all ages) broken down by cancer type (bowel, lung, prostate and haematological) between 1979 and 2016, England
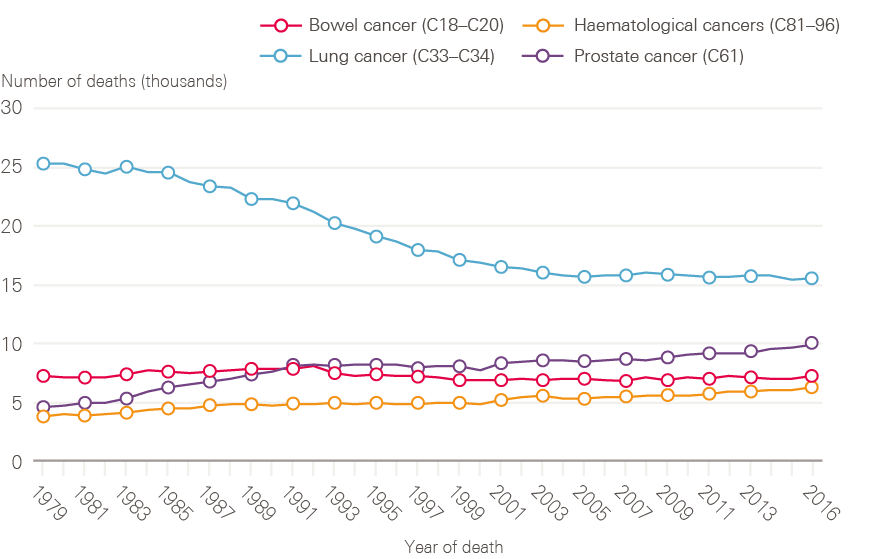
Data provided by Cancer Research UK, July 2017. Source: Office for National Statistics. Available at: cruk.org/cancerstats
Figure 8: Number of female deaths (all ages) broken down by cancer type (bowel, lung, breast, ovarian and haematological) between 1979 and 2016, England
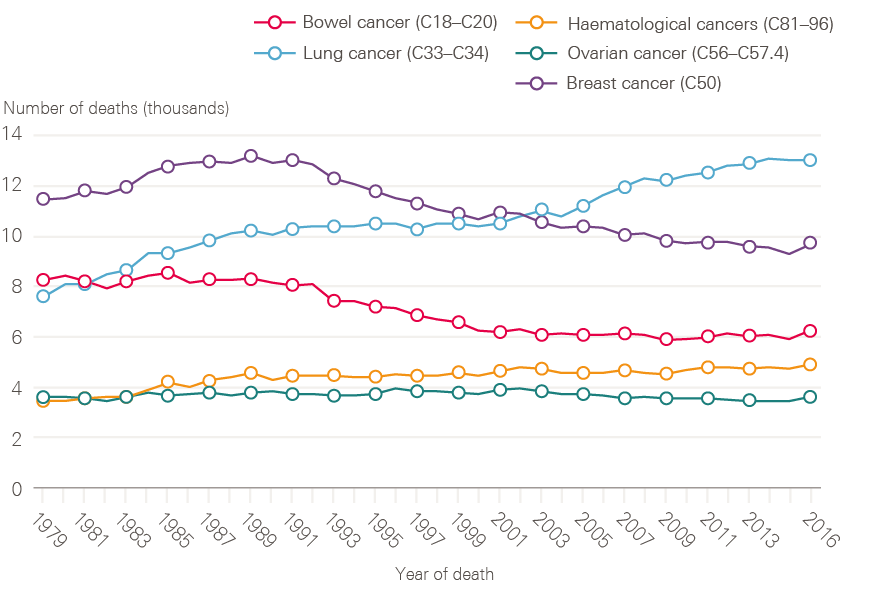
Data provided by Cancer Research UK, July 2017. Source: Office for National Statistics. Available at: cruk.org/cancerstats
2-3 Cancer survival
Half of people diagnosed with cancer in England now survive their disease for 10 years or more, and both 1- and 5-year cancer survival (all cancers combined), has been steadily improving in England over the period covered by this report (Figure 9).
Figure 9: 1- and 5-year net survival for all adult cancers (15 to 99 years) between 2000 and 2015 (age, sex and cancer-type standardised), England
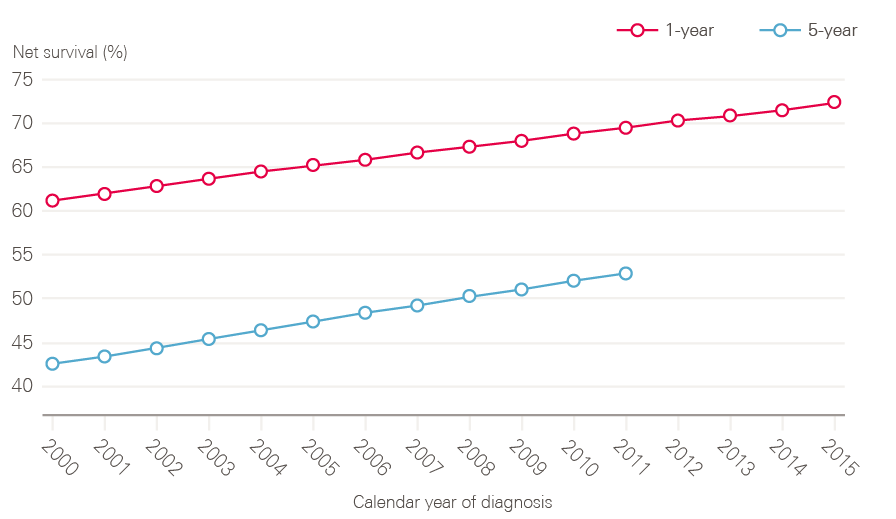
Note: Pre-2000 datasets have been excluded because they are not directly comparable due to changes in methodology.
Source: National Cancer Registration and Analytical Service, Public Health England; Office for National Statistics (2017). Available at: www.ons.gov.uk/peoplepopulationandcommunity/healthandsocialcare/conditionsanddiseases/datasets/table01to091yearcancersurvivalbyclinicalcommissioninggroupsinenglandandwithprecisionestimates (accessed on 19 October 2018).
Despite this, survival in the UK continues to lag behind those in comparator countries. The most recent analysis of international variation in cancer survival, the CONCORD-3 study, demonstrates that, while the gap has narrowed for breast cancer, 5-year survival rates for many cancer types continue to be lower in the UK than in comparable countries, with few signs of the gap reducing (Figure 10). There are also significant variations in survival by age and deprivation.
Figure 10: CONCORD-3 survival estimates for the UK in comparison to Australia, Canada, Denmark, Norway and Sweden, adults (15–99 years), 2000/04–2010/14
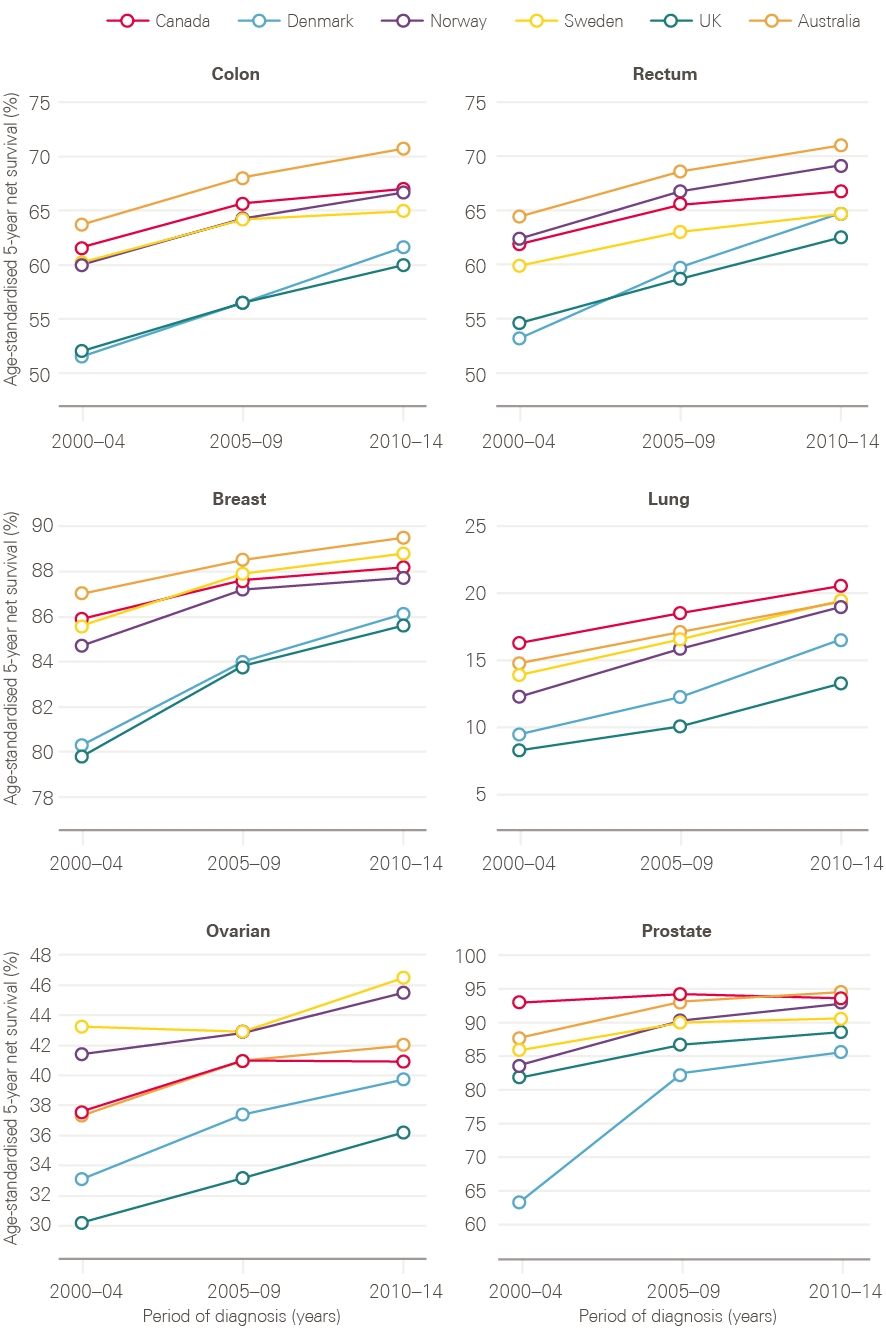
Note: Data provided by Cancer Research UK.
Source: London School of Hygiene & Tropical Medicine; CONCORD-3 study. Available at: www.thelancet.com/journals/lancet/article/PIIS0140-6736(17)33326-3/fulltext (accessed on 26 October 2018)
Older adults continue to have poorer survival, likely due to a combination of more advanced stage at diagnosis, and greater frailty, with fewer patients receiving curative treatments. Figure 11 shows data for stage 2 tumours by age group. These tumours are usually operable, but for older age groups, the data suggest that older cancer patients in England are less likely to have surgery for these cancers. It is not possible to know to what extent this is explained by patient choice, co-morbidities making surgery more risky, or a systematic bias in care.
Figure 11: Proportion of stage 2 tumours with a tumour resection recorded by age and cancer type between 2013 and 2015, England
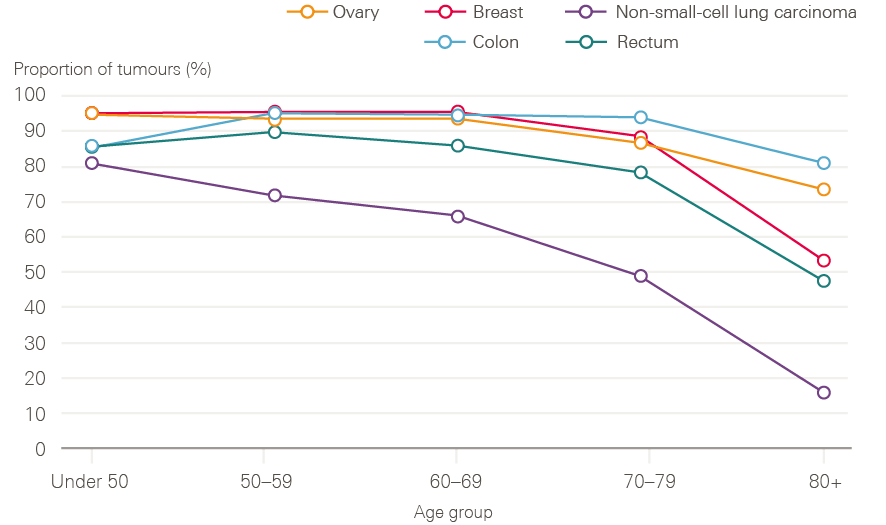
Source: Data provided by Cancer Research UK. Produced by the Cancer Research UK – Public Health England Partnership. Available at: www.ncin.org.uk/cancer_type_and_topic_specific_work/topic_specific_work/main_cancer_treatments
Despite explicit strategies to tackle inequalities and promote equality in access to cancer services in England, including the creation of the National Cancer Equality Initiative in 2008, inequalities in survival by socioeconomic status have persisted throughout the past 20 years. The deprivation gap in 1-year net survival has remained unchanged for almost all cancers, with a clear and persistent pattern of lower survival among more deprived patients.
2-4 Patient experience
Cancer patient experience was first measured in 2000 (initially on six tumour groups) and was subsequently repeated, albeit on a smaller sample, in 2004. This showed improved experience in this early period, but is not directly comparable with the annual Cancer Patient Experience Surveys from 2010 onwards. Since 2015, cancer patients have been asked to rate their care on a scale of 0 to 10. Overall care ratings have shown improvements over the last 3 years from 8.70 in 2015 to 8.74 in 2016 and 8.80 in 2017; under the old measurement, the rating also improved between 2012 and 2014. Figure 12 shows that, in comparison with survival rates, there is no significant difference in care experience reported between socioeconomic groups, with an average of 8.73 and 8.83 being reported for Index of Multiple Deprivation (IMD) quintiles 1 and 5 respectively (with 1 being the most deprived and 5 being the least deprived). Similarly there is no major difference in care experience reported in relation to gender. Poorer experience is reported by younger adults aged between 25 and 44 and by black and minority ethnic groups, especially Asian patients; older adults aged between 65 and 84 and white patients report a significantly better experience.
Figure 12: 2017 care rating for all cancers broken down by demographics
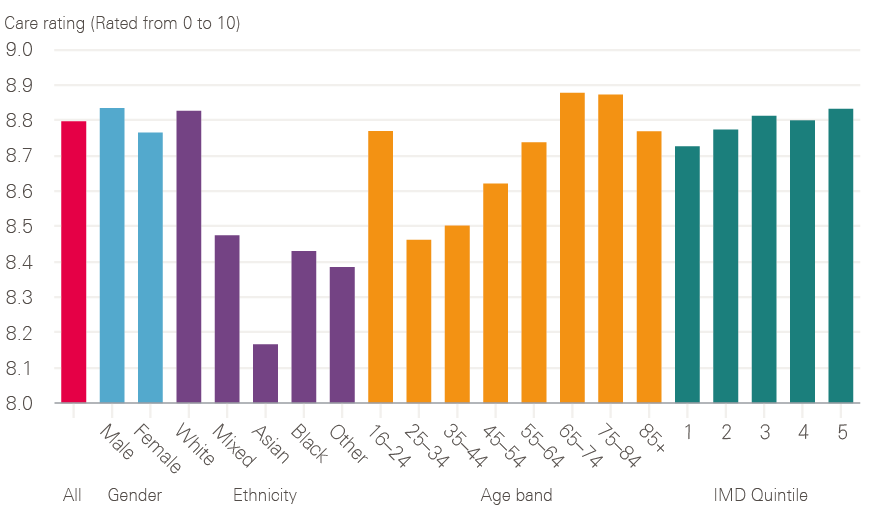
Source: 2017 National Cancer Patient Experience Survey (national results). Available at: www.ncpes.co.uk/reports/2017-reports/national-reports-2 (accessed on 19 October 2018).
Since 2015 care ratings have improved for all tumour groups except brain/central nervous system and sarcoma, both of which had the two lowest care ratings in 2017 (though these tumour groups are of low occurrence compared with other cancers, so the number of respondents is comparatively small). Care ratings for breast, skin and haematological cancers are highest, while brain/central nervous system, sarcoma and upper gastrointestinal cancers perform relatively poorly.
Figure 13: Variation in care rating observed between CCGs in 2017
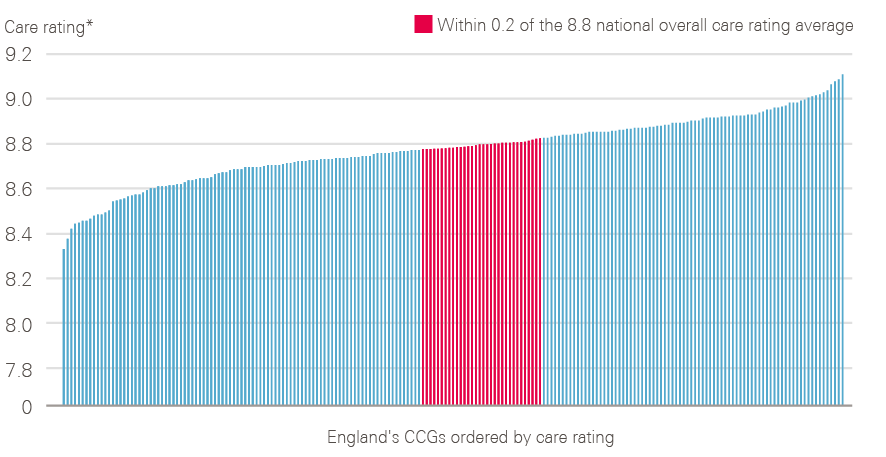
* Case mix adjusted ratings
Source: 2017 National Cancer Patient Experience Survey (local results). Available at: www.ncpes.co.uk/reports/2017-reports/local-reports-2 (accessed on 24 October 2018).
CCG-level data from 2017 show that there is variation in recorded patient experience in England (Figure 13), with an overall care rating difference of 0.78 observed between the best- and worst-rated CCGs (when case adjusted).
Figure 14 shows the changes over time of a number of key indicators between 2010 and 2017. These results show progress in the percentage of patients who were given the name of a nurse specialist, treated with respect and dignity, and involved in decisions about their care and treatment. There is, however, still room for progress in these measures, with 21% of people still not stating ‘yes, definitely’ to being involved as much as they wanted to be in their care and treatment. There is limited progress reported for patients feeling that they were seen as soon as they thought necessary by a hospital doctor, with 16% still feeling that they waited too long. There is a similar story of limited progress for patients only being seen once or twice by their GP about their cancer symptoms before being referred to a hospital, with 23% of patients still reporting seeing their GP three or more times before referral. There is no long-term progress reported by patients in relation to the different people treating and caring for them always working well together, with 38% not feeling that they always worked well together.
Figure 14: Changes observed for six key patient experience indicators between 2010 and 2017
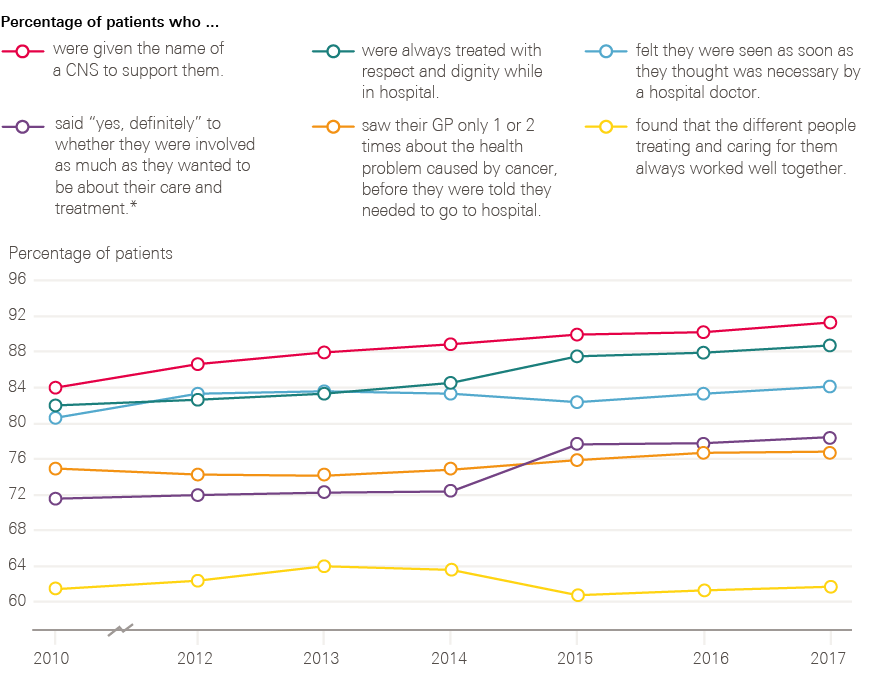
* In 2010 the patients were only asked about involvement with their treatment, not care.
Source: National Cancer Patient Experience Survey (2010, 2012–2017). Available at: www.quality-health.co.uk/surveys/national-cancer-patient-experience-survey (accessed on 19 October 2018).
Progress across the cancer pathway from 2000
This section describes the main developments since 2000, across the main dimensions described in the various cancer strategies, from prevention, screening, diagnosis and treatment, to living with and beyond cancer. One deliberate omission is end of life care, which merits its own analysis. Each section draws on available data, including the testimony of those people directly involved in developing and implementing policy.
3-1 Prevention
Around 4 out of 10 cancers are caused by exposure to risk factors, such as smoking, that are preventable. The scope of prevention has broadened considerably from the NHS Cancer Plan, which focused heavily on reducing smoking and increasing fruit and vegetable consumption, with only brief mentions of the role of alcohol, obesity, lack of exercise and exposure to the sun as cancer risks. The most recent cancer strategy (2015) has been developed on the basis of a much improved evidence base, particularly in relation to the effects of obesity and alcohol consumption on cancer, as well as action to reduce exposure to ultraviolet radiation and boost the coverage of the human papilloma virus (HPV) vaccination. The next section looks in more detail at the action taken on two of the main risk factors: smoking and being overweight or obese.
3-1-1 Smoking
Action to reduce smoking rates represents one of the most successful strands of health policy in recent years. It is the product of successful mobilisation of a broad set of actors, which included the cancer community, but extended beyond to a coalition of health charities, politicians (able to vote freely) and the research community.
If I look back at my time involved with the cancer community, it [smoking] stands out as the biggest success story, that we’ve changed the nature of the debate, and we have got politicians to do things we never thought they’d do.
Sarah Woolnough, Executive Director of Policy and Information, Cancer Research UK
Smoking rates are now at their lowest levels since records began (Figure 15). In 2016, 18% of adults in England smoked cigarettes (20% of men, 16% of women), compared with 28% in 1998 when Smoking kills: a white paper on tobacco was published.
For the UK this represents significant progress. Following the Second World War the UK had a particularly high prevalence of cigarette smoking in men: more than 60% in 1948. In 1950 a seminal paper, Smoking and carcinoma of the lung, was published in the BMJ, linking deaths from lung cancer with smoking tobacco. As further proof of the link emerged, smoking rates in men began to fall, and in 1965 the advertising of tobacco on TV was banned.
Figure 15: Changes in cigarette smoking prevalence in male and female adults (16 and older) between 1993 and 2016
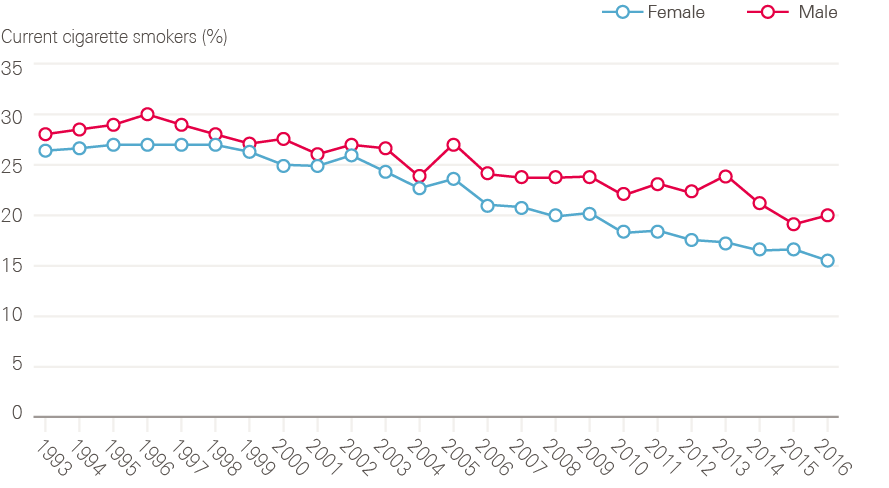
Source: Data provided by Cancer Research UK. Source: Health Survey for England; NHS Digital. Available at: http://healthsurvey.hscic.gov.uk/data-visualisation/data-visualisation//explore-the-trends/smoking.aspx
For almost 40 years after the first evidence of harm from smoking appeared, central government made relatively little effort to regulate tobacco. Taxes on tobacco crept up slowly and, other than the ban on television advertising, the industry was relatively unrestricted. By the mid-1990s, it was clear that the prevalence curves had flattened, and smoking was no longer declining.
In 1997 the Labour Party manifesto included a pledge to ban tobacco advertising, and the first-ever tobacco control strategy, Smoking Kills, was published in December 1998. In the following 10 years, action was taken on smuggled cigarettes, stop smoking programmes, public awareness programmes, smoke-free legislation (2007), a ban on smoking in public places, compulsory health warnings on cigarette packets, standardised packaging and a ban on advertising in shops.
Looking back, for one of the leading civil servants, the period represents a positive feedback loop between evidence and action:
If you look at 2002–2007 there was an acceleration [in tobacco control], as more and more of the properly evidence-based policies happened. There was an acceleration, but I could not at all have guessed that it would end up at the rate of reduction. It’s the smoke-free legislation. Part of that, and the whole denormalisation piece, is about creating a societal movement that it [smoking] is not the right thing, or normal thing, to do and that’s what you hope for.
Nick Adkin, former Head of Tobacco Programme, Department of Health
An important part of the NHS Cancer Plan was establishing smoking cessation services in the NHS, reversing the ban on prescribing nicotine replacement therapy, and putting in place financial incentives for GPs to register smokers and refer people to cessation services. According to the latest data, numbers accessing NHS stop-smoking services rose steadily until 2011/12, but have since declined. It is not clear what is driving this. Since 2012, public health has fallen in the remit of local authorities, which have seen their total budgets fall by 32.6% between 2011/12 and 2016/17. While some of the drop-off in smoking cessation numbers may represent under-reporting from local authorities, NHS Digital estimates that access to e-cigarettes has had a role to play. So too might underinvestment in the stop-smoking services previously supported by local government – between 2014/15 and 2018/19 there has been a 32% reduction in real term spend on stop-smoking services.
Figure 16: Number of smoking quit attempts (characterised as setting a quit date) and the percentage of those that were self-reported as being successful between 2007/08 and 2017/18, England
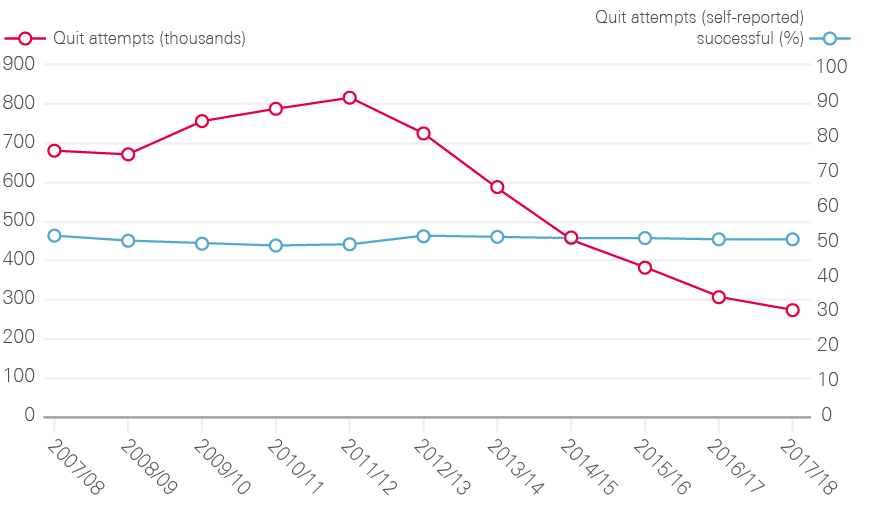
Note: The 2016/17 and 2017/18 data have not been adjusted to estimate for the local authorities that did not provide any data or only provided data for some quarters. These totals are therefore underestimates and not directly comparable with previous years.
Source: Lifestyle statistics; NHS Digital. Available at: https://digital.nhs.uk/data-and-information/publications/statistical/statistics-on-nhs-stop-smoking-services-in-england (accessed on 19 October 2018).
There was also a significant investment in media campaigns from 2003. Charities, including Cancer Research UK and the British Heart Foundation, funded advertisements which produced memorable images such as children breathing in smoke, and cigarettes dripping fat.
By 2004, the government was being confronted with an important lesson, which was that voluntary agreements with business and industry had only limited traction, in this case to provide smoke-free areas in places of work, which was part of the 1998 Smoking Kills strategy. What seemed to have helped shift this was the impact of the media campaigns on public attitudes, as evidence mounted from Office for National Statistics surveys that the public welcomed smoke-free areas. As Nick Adkin recalls, ‘what we were trying to do is generate the evidence base for ministers to be more comfortable with a decision which was about legislating in this area.’
When Ireland and Scotland decided to ban smoking in public places, it tipped the weight of evidence even further. The impact of Ireland is crucial in this.
So, Irish ministers. Huge problems with smoking, and drinking [in Ireland]. They made a decision to go for, ‘This is a flagship policy for Ireland as modern Ireland. You know, forward thinking, not backward-looking smoky pubs. This is our future.’
Nick Adkin, former Head of Tobacco Programme, Department of Health
Behind the symbolism of Ireland’s decision came evidence, funded by Cancer Research UK.
I remember there were big concerns about the impact on the economy and on pubs, of the workplace ban. So, we funded an evaluation of the Irish Republic who’d gone earlier, and that was often quoted. Politicians took big interest in that, to be able to say, ‘Look. The pub trade will survive this,’ was incredibly important, politically.
Professor Sir Alex Markham, Professor of Medicine, University of Leeds, and former Chief Executive of Cancer Research UK
The first explicit call for legislation came in the Chief Medical Officer’s report of 2004. The legislation was eventually passed with a majority of 200 in 2006. Rapid progress was then made on the next anti-smoking goals, such as point-of-sale restrictions and plain packaging, as stakeholders learned how to marshal arguments effectively:
Actually, when it [point-of-sale restrictions] came to it, it certainly wasn’t as hard a sell as the workplace smoking ban. I think partly because the community – and it was a very broad community – had done such a good job in using the evidence and what we knew about public opinion, to try to translate that into a strong story to go to government with.
Sarah Woolnough, Executive Director of Policy and Information, Cancer Research UK
Smoking continues to be the leading cause of preventable deaths, and currently causes around 50,000 cases of cancer per year in England (across 15 cancer types). Men are more likely to smoke than women, younger people more likely to smoke than older people, and smoking rates are significantly higher in more deprived communities and among people with mental illness.
The most recent tobacco control plan for England, Towards a smokefree generation, published by Public Health England in July 2017 pledges that, by the end of 2022, it will:
- reduce the prevalence of 15-year-olds who regularly smoke from 8% to 3% or less
- reduce smoking prevalence among adults in England from 15.5% to 12% or less
- reduce the inequality gap in smoking prevalence between people in routine and manual occupations and the general population
- reduce the prevalence of smoking in pregnancy from 10.7% to 6% or less.
3-1-2 Obesity
Being overweight or obese has now been recognised as the next biggest preventable cause of cancer behind smoking. Researchers estimate that obesity causes around 23,000 cancer cases each year in the UK, and being overweight or obese is linked to at least 13 different types of cancer, including bowel and endometrial cancers., Despite this, public awareness of the relationship between obesity and cancer remains low, with just 15% of UK adults aware of the causal link.
In contrast to tobacco, the evidence base is much newer. Obesity merited only a single bullet point in the NHS Cancer Plan. In the 2015 cancer strategy it is given much more prominence. The learning from the smoking campaigns has been vital. Similar tactics to those deployed in tobacco control are being developed by government agencies, such as Public Health England, the Royal Colleges and charities, but there is still much ground to cover.
It’s not rocket science. If you go after the availability of high fat, sugar, salt foods and try to do something about that, you tackle the price, you tackle the promotion, you know, it’s the four Ps (product, price, place and promotion) that we’ve always referred to in tobacco control, you will make a difference. We do have a job to do, to change the environment in the way that we’ve done for tobacco, with food.
Sarah Woolnough, Executive Director of Policy and Information, Cancer Research UK
Weight is a growing problem in the UK. The Health Survey for England measures a representative sample of adults aged 16 and older to provide estimates of obesity levels in the country. The 2016 survey found that 26% of adults in England are obese (body mass index (BMI) of at least 30) and a further 35% are overweight (BMI of 25 to 29.9), meaning that 61% of people are either overweight or obese. As shown in Figure 17, the percentage of adults in England who are obese or obese and overweight combined has increased steadily since 1993. Cancer Research UK and the UK Health Forum have predicted that, if current trends continue, obesity will cause an additional 670,000 cases of cancer in the UK over the next 20 years.
In 2016 the government launched its childhood obesity strategy with the aim of ‘significantly reducing’ childhood obesity within 10 years. This included launching a ‘soft drinks industry levy’ – a levy on manufacturers of sugary drinks, implemented in April 2018. In February 2018 Cancer Research UK launched a national campaign aimed at raising awareness of the link between obesity and cancer. There is currently no national strategy for adult obesity.
Figure 17: Changes in prevalence of adults (16 and older) being obese and overweight between 1993 and 2016
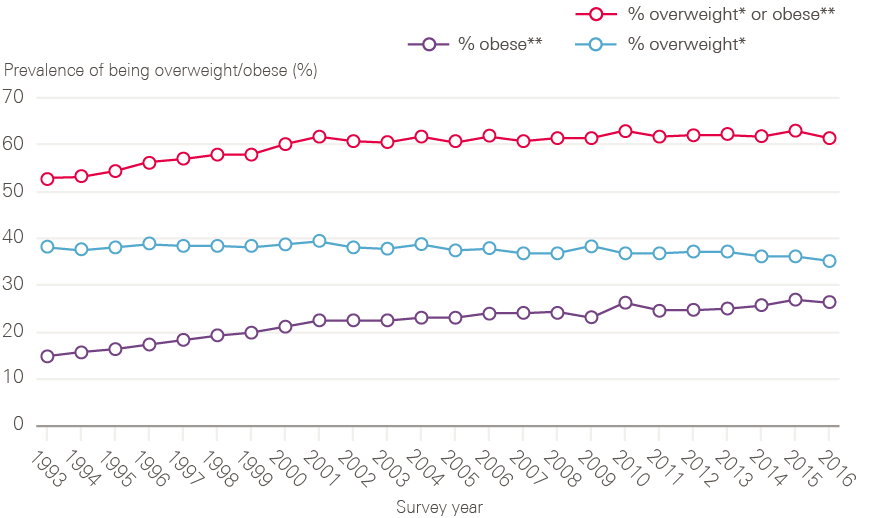
* Overweight = BMI 25 to less than 30kg/m2. ** Obese = BMI 30kg/m2 or more.
Note: Data up to and including 2002 are unweighted; from 2003 onwards data have been weighted for non-response.
Source: Health Survey for England; NHS Digital. Available at: https://digital.nhs.uk/data-and-information/publications/statistical/health-survey-for-england/health-survey-for-england-2016 (accessed on 22 October 2018).
3-2 Screening
The aim of screening is to reduce mortality from cancer. This can be achieved either by detecting and removing precancerous lesions – thereby preventing cancer from developing – or by detecting cancers early, making a cure more likely than if they were detected once symptoms have appeared. For some cancers, the challenge is to balance the risk of overdiagnosis (finding cancers that wouldn’t cause problems in a patient’s lifetime and exposing them to potentially unnecessary treatment) against the benefits of earlier intervention. Evidence-based recommendations are made by a National Screening Committee, which is UK-wide. Screening programmes are nationally coordinated but locally commissioned, and are almost exclusively delivered by NHS trusts and GPs.
National screening programmes are currently available in the UK for three cancer types – breast, cervical and bowel cancers. The breast and cervical screening programmes were already well established by the time of the NHS Cancer Plan, and represented the only nationally coordinated aspect of cancer-related services before 2000.
It is important to recognise that only 29% of breast cancers and 10% of bowel cancers are currently detected by screening, and that uptake of screening remains far below 100% across all programmes. Across all cancers combined, only 6% of cases are detected through screening.
3-2-1 Breast cancer screening
The NHS breast screening programme was introduced in 1988. Women were invited for screening at 3-yearly intervals from around the age of 50 to around the age of 65, meaning that an individual woman would be invited five times in total. The NHS Cancer Plan extended the programme up to the age of 70 (increasing the number of times a woman is screened from five to seven), and promised a change from single to two-view mammography at all screening attendances by 2003. During this period the National Cancer Screening programme was responsible for the rollout of new screening services with considerable support and direction from the National Cancer Director and Department of Health Cancer Policy Team.
I was involved, hands dirty, you know, ringing up clinicians and hospitals, and getting into clinics. I was really into the details.
Julietta Patnick, former Director of National Screening Programmes
These changes led to a marked increase in cancers detected both at first and subsequent rounds, and had significant implications for the workforce. The NAO estimated it had resulted in a 40% increase in workload. Expanding the breast radiology workforce was not possible in the time frame. Instead the National Cancer Director and the Director of the Cancer Screening programme redesigned the workforce with the Department of Health and professional bodies, including introducing a four-tier model for radiographers – assistant practitioner, radiographer, advanced practitioner and consultant radiographer. This meant that trained radiographers could perform tasks previously done by radiologists.
Figure 18: Changes observed between 2006/07 and 2016/17 in the number of women (50–70) invited for breast screening, the number of women (50–70) screened and the percentage uptake
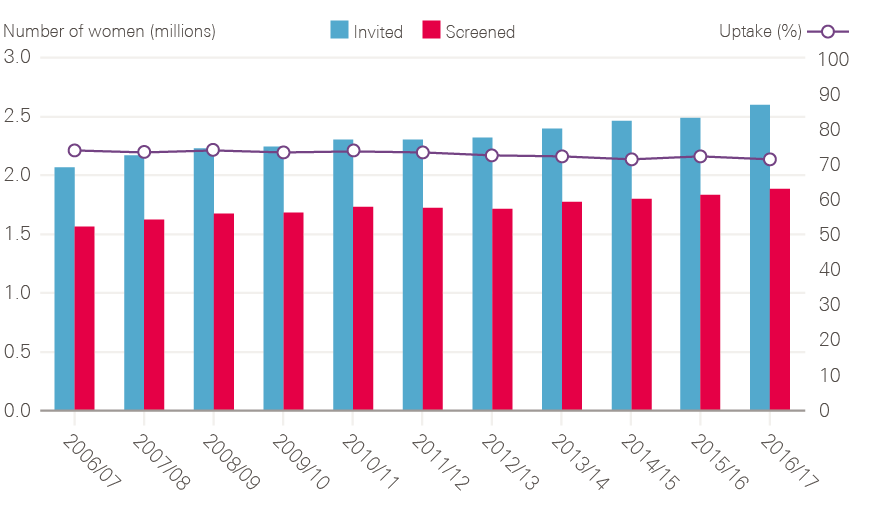
Source: Breast Screening Programme; NHS Digital. Available at: https://digital.nhs.uk/data-and-information/publications/statistical/breast-screening-programme/breast-screening-programme-england---2016-17 (accessed on 22 October 2018).
Figure 18 shows that, between 2006/07 and 2016/17, the total number of women being screened for breast cancer (of all ages) has risen by more than half a million because of the age extensions, even though uptake has fallen slightly. The UK performs above the Organisation for Economic Co-operation and Development (OECD) average for the number of women aged 50–69 who have received breast screening in the past 2 years though remains below nine countries, including Denmark, Norway and Sweden (Figure 19).
Further extension of the breast screening programme followed the publication of the Cancer Reform Strategy in 2007. The aim was to extend screening to a total of nine rounds from around age 47 to around age 73. As there was uncertainty about the benefits of screening in these younger and older age groups, it was decided that the extension should be introduced through a randomised controlled trial (AgeX). This has now recruited more than 3 million women. Full results of impact on mortality are not expected for several years.
Figure 19: International comparison of the percentage of women (aged 50–69) screened for breast cancer in the past 2 years (in 2015 or nearest year)
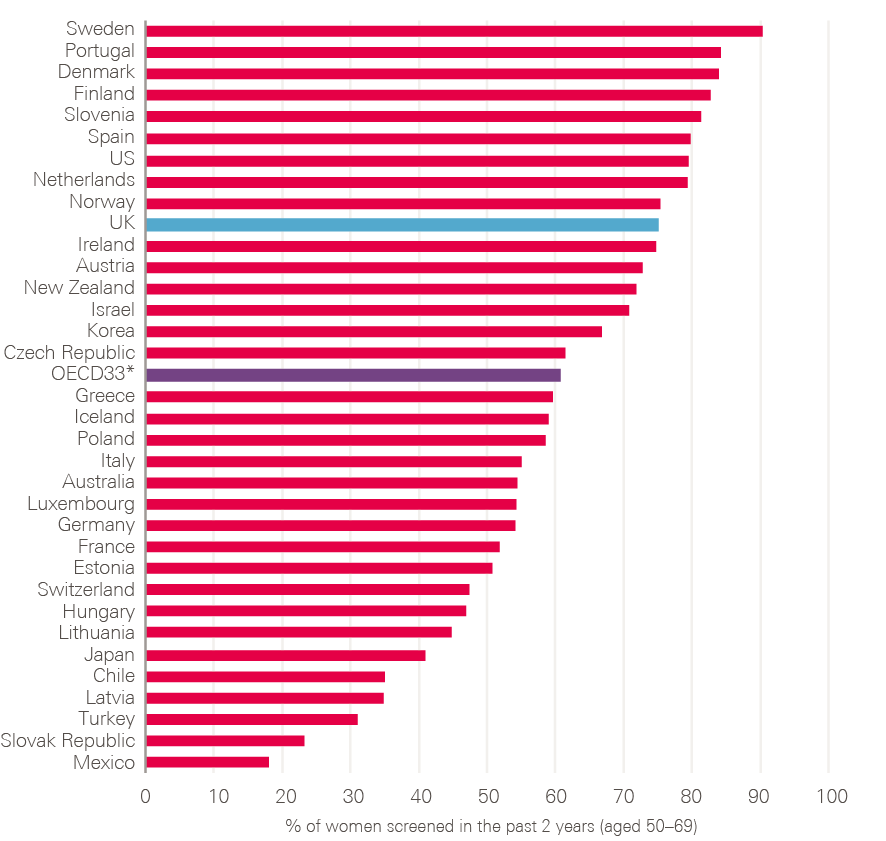
* The OECD average is calculated for the 33 OECD countries for which data were available.
Source: OECD Health Statistics (2017), EHIS Eurostat database. Available at: www.oecd-ilibrary.org/social-issues-migration-health/health-at-a-glance-2017_health_glance-2017-en (accessed on 22 October 2018).
3-2-2 Cervical cancer screening
Although the Pap smear to screen for cervical cancers was developed in the 1940s, a national programme to invite women to attend their GP for screening at set intervals was only introduced in 1988. Since 2003, women aged between 25 and 49 receive screening invitations every 3 years, and those aged 50 to 64 every 5 years.
In 2000, the NHS Cancer Plan committed to change the technology used for cervical screening from smears to liquid-based cytology. This required retraining GPs and others to take samples and training of laboratory technicians (cyto-screeners) to interpret the samples. The programme was rolled out over several years.
Increased attention to the quality of screening programmes was galvanised early in the Labour government’s new term by the emergence of breast screening failures at a hospital in Exeter, which followed hard on the heels of a cervical screening scandal at Kent and Canterbury Hospital. The director of the screening programmes at the time recalled a swift response, which culminated in a strengthening of central power over the quality of screening happening in NHS trusts.
The vast majority of cervical cancers are caused by HPV, and in 2003 research on screening for HPV, either to replace cytology or as an adjunct to it, was commissioned. In England, samples from women with borderline or mild changes in the cells at the cervix now go on to have an HPV DNA test. Women who test positive for high-risk types of HPV are referred onward for colposcopy (an examination of the cervix where abnormal cells can also be removed). Those who are HPV negative are returned to routine screening.
Figure 20: Changes observed between 2006/07 and 2016/17 in the number of women invited for cervical screening (25–64), the number of women screened (25–64) and the percentage uptake
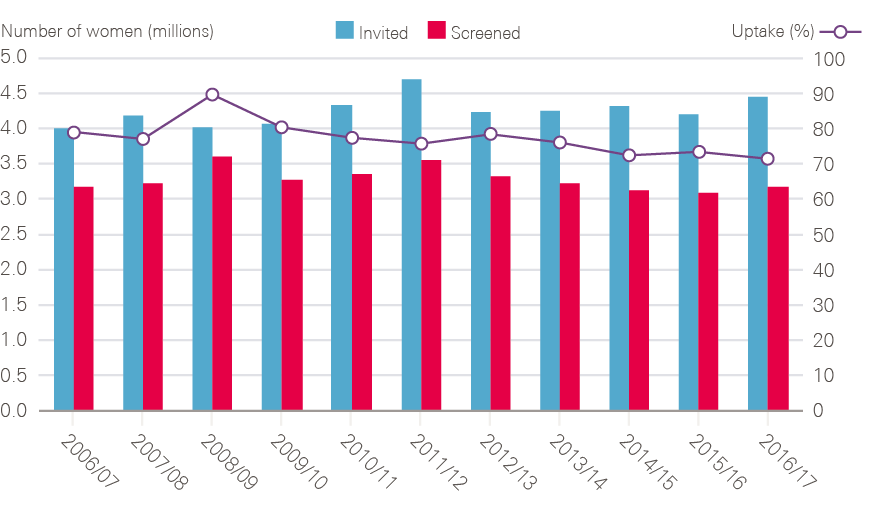
Note: Uptake was calculated by the Health Foundation by dividing the number of women screened by the number invited.
Source: Cervical Screening Programme. Available at: https://digital.nhs.uk/data-and-information/publications/statistical/cervical-screening-programme (accessed on 22 October 2018).
Since September 2008, girls aged 12–13 have been offered vaccination against HPV, and in 2016/17, 83.1% of eligible females completed the two-dose HPV vaccination course. In time, this should reduce the incidence of cervical cancer. Earlier this year, the government announced that the HPV vaccination will be rolled out to boys aged 12–13. There is ongoing research into HPV testing as a means of screening for cervical cancer (as opposed to its present use as an adjunct to the smear/cytology test).
Figure 20 shows that, between 2006/07 and 2016/17, the number of women screened for cervical cancer each year has fluctuated, and uptake has generally reduced over time. The increase in women screened in 2008/09 has been associated with the diagnosis and death from cervical cancer of the reality TV star Jade Goody. An increased screening attendance was observed at all ages but particularly for women under 50. The increased number of women invited for screening in 2011/12 may, in part, be explained by the increased number of women screened in 2008/09, who would have been expected to receive their next routine invitation for screening in 2011/12.,
Without the cervical screening programme, incidence of and deaths from cervical cancer would almost certainly have increased over this period as the incidence of the sexually transmitted HPV viruses has risen. It is estimated that, in England, screening currently prevents 70% of cervical cancer deaths. If everyone attended screening regularly, 83% of deaths could be prevented.,
3-2-3 Bowel cancer screening
Bowel (colorectal) cancer is the third most common cancer in both men and women in the UK, with an estimated 41,700 new cases per year. Cancer Research UK has estimated that 54% of bowel cancers are preventable, and screening is vital.
By the year 2000, pilot programmes were underway to test the use of faecal occult blood testing (FOBT) as screening for bowel cancer. These followed the publication of three trials all showing that bowel screening reduced mortality from bowel cancer. The evidence was sufficiently robust by 2006 for a national bowel cancer screening programme to be rolled out. FOBT kits are sent to people aged 60–69 every 2 years, with those testing positive for blood in the stool invited for a colonoscopy (diagnostic camera test). Following the Cancer Reform Strategy (2007) this was expanded to people aged 60–74. Recent Bowel Cancer Screening Programme data show an uptake rate of 59% for FOBT screening, with 1.66% of those participating testing positive for blood in the stool. In 2016/17, 3,021 people were diagnosed with a bowel cancer following screening, and a further 16,356 had potentially pre-cancerous lesions found.
In 2010 the results of a UK-based trial of an alternative approach to bowel screening were published, showing a reduction in mortality from colorectal cancer for patients aged 55 undergoing a one-off flexible sigmoidoscopy (camera test). With publication timed to coincide with the run-up to a general election, the introduction of flexible sigmoidoscopy became a manifesto commitment for both Labour and the Conservatives. Rollout subject to successful piloting was agreed, and this is now being delivered in around 65 centres. This has been harder than anticipated, in part due to a lack of endoscopy capacity, and in part as a result of poor uptake from the public.
The bowel screening programme is now undergoing further change, with FOBT being replaced by faecal immunochemical testing (FIT). This is an easier procedure from a patient’s perspective (it requires only a single stool sample, unlike FOBT which requires six samples from three separate stools) and has been shown to have a higher uptake than FOBT. Full rollout of FIT was due by April 2018 but has been delayed. The bowel cancer screening programme places demands both on colonoscopy and pathology services, as polyps removed at colonoscopy have to be analysed by histopathologists. The lack of workforce capacity and delays in procuring the FIT tests, is a source of frustration for the bowel cancer charities:
It [introduction of FIT] would result in a 120% increase in pathology demand in some areas, and we just don’t have the capacity. Now, we’ve seen this coming for years, but action hasn’t been taken until the last minute to prepare. Therefore, what they’re beginning to propose is that they will now, instead of doing a switchover from FOBT to FIT as there has been in Scotland, do a phased rollout as capacity becomes available. That could be 2 to 3 years for some areas, it’s such a lost opportunity.
Deborah Alsina, Chief Executive, Bowel Cancer UK
3-3 Earlier and faster diagnosis
By the late 1990s, some researchers and clinicians argued that survival rates in the UK were relatively poor compared with other countries due to delays in getting patients into treatment. Two systematic reviews were published in The Lancet in 1999 which suggested that delays in presentation with breast cancer were linked to poorer outcomes., But this was far from convincing for most cancer clinicians at the time, as one of the researchers recalls:
I suppose my overwhelming sense at the beginning of it all was the huge resistance of the cancer clinical community to this idea that delayed presentation or delayed diagnosis could in any way count for significant differences in outcome. The vituperative responses that our systematic review drew – the arguments were worse than politics or religion. These were core beliefs that were being challenged. ‘How could a 3-month delay possibly explain a reduced survival probability?’ So, it’s a wonderful example of evidence that, on its own, doesn’t win the day.
Amanda Ramirez, Professor of Liaison Psychiatry, King’s College, London
This resistance was difficult to overcome because of gaps in the data. Although cancer, compared with other diseases, had comparatively advanced datasets (having kept registries for several decades), in 1999/2000 it was not possible to know where the delays were happening (ie patients not going to the GP in the first place, delays between the GP and the hospital consultant, or delays in diagnosis once in the hospital system). In the event, because data on patients in the hospital system were easier to collect, much of the early effort from 2000 went into reducing delays in the hospital system (described in section 3.3.5). The puzzle of delayed diagnosis had to wait several years before new streams of research bore fruit. This work, some of it drawing on new comparative datasets, has since revealed multiple dimensions to the challenge of late diagnosis, and a problem still far from being solved.
3-3-1 Public awareness of symptoms and accessing GPs
Public awareness of which symptoms ought to be checked out by a GP is a self-evidently vital part of an effective cancer system. But in 2000, there was only a brief mention of the need for better public awareness in the NHS Cancer Plan. However, there was a commitment to produce a better evidence base.
By 2007, evidence from the EUROCARE studies, UK-based researchers and the Cancer Patient Experience Survey all pointed to patients being diagnosed later in England (and the UK) than in other countries. In response, the Cancer Reform Strategy established a multi-pronged National Awareness and Early Diagnosis Initiative, formally launched in 2008. The initiative had seven workstreams, including measuring public awareness and promoting interventions to prompt patients to go to their GP.
The measurement work resulted in the validation and first successful use of a national survey to test public awareness of cancer symptoms. The paper, published in 2009, found that overall cancer awareness was low, but that 68% of people could recall (unprompted) that a lump or swelling was a cancer symptom. The results also suggested that there was a problem right at the start of the cancer ‘pathway’ in getting people to go to their GP at all. In 2009, 38% of people were worried about wasting the doctor’s time, and 41% said it might be difficult to make an appointment. Cancer Research UK now publishes the Cancer Awareness Measure survey. In 2017, 45% of respondents said they found it difficult to make an appointment, 22% were worried about wasting the doctor’s time, and awareness of some cancer symptoms appears to have worsened: 59% of people recalled that a lump might be a cancer symptom.
These studies have also revealed systematic differences in knowledge according to age, gender, socioeconomic status and ethnicity: older, wealthier, white women are the most likely to know the risk factors, and seek help promptly. But the work also incorporated an international dimension, which has revealed factors that might be unique to the UK. Research conducted by the International Cancer Benchmarking Partnership revealed that low public awareness was a problem in Norway, Sweden, Denmark, Australia and Canada. But ‘not wanting to bother the doctor’ turned out to be a peculiarly British trait.
Since 2011, raising public awareness has been tackled through the ‘Be Clear on Cancer’ campaigns, run in collaboration with Public Health England, the Department of Health and Cancer Research UK. Time-limited national campaigns have been run on lung cancer, bowel cancer, bladder cancer and breast cancer (aimed particularly at older women above the age for routine breast screening). A wide range of resources, from leaflets to videos, have been developed for use by the NHS and other public services.
For cancer experts such as Professor Mick Peake, a lung cancer specialist, the campaigns have helped GPs as well as patients to navigate what has traditionally been a fraught relationship between primary and secondary care:
They [GPs] feel that the public awareness campaigns have given them the ‘permission’ to refer, at a lower threshold than they had before. You have seen hospital correspondence and know what these letters were like. The GP gets two letters, in the first the consultant says: ‘You’ve been sitting on this patient for months now and he’s got advanced disease, he’s going to die, you know, what have you been doing?’ Next day another letter arrives saying essentially: ‘What are you doing sending me this patient? There’s nothing wrong with him, what a waste of my time.’ You know, you can’t win.
Mick Peake, Professor of Respiratory Medicine and former Cancer Services Collaborative Lung Cancer Lead
3-3-2 Speeding up the journey from general practice onwards
In the absence of evidence about the precise nature and location of the barriers to early diagnosis, the early efforts of the NHS Cancer Plan focused instead on what happened after referral. This meant making sure that patients who did go and see their GP and were referred for a suspected cancer could be seen promptly. The NHS Cancer Plan took action based on existing evidence that there were unacceptable waits in three parts of the cancer pathway:
- between referral and first hospital appointment
- between first hospital appointment and key diagnostic test
- between diagnosis and treatment.
This evidence was based on an audit of waiting times (run in 1997) and results from a pilot Cancer Patient Experience Survey (1999/2000). The audit, (published in 2000), looked at the experience of more than 13,000 patients referred by their GPs for cancer in October 1997. GPs already categorised patients into ‘urgent’ and ‘non-urgent’. On average, urgent cases were first seen by a specialist within 2 weeks, but people often faced additional long waits for treatment. Those patients referred as ‘non-urgent’ by their GP faced much longer waits, for first outpatient appointment and subsequent treatment. The audit also found large variations by tumour type and hospital trust.
The ‘2-week wait’ pledge was brought in to standardise the ‘urgent’ GP referral route, effectively forcing hospital consultants to accept the verdict of the GP that this was an urgent case. The first standard, for women with suspected breast cancer to be seen by a specialist within 14 days of urgent referral by their GP, was implemented in 1999. For other cancers, the same standard was applied in April 2000. Initially, around 600,000 patients were referred each year through this route.
Assessment of performance against this target was (deliberately) simple: 93% of people classified as urgent had to be seen within the required time frame. There was no specific intention to monitor the proportion of suspected cancer cases classified as urgent, or the proportion of cancers eventually found.
This target was very quickly met. By 2003, when progress against the NHS Cancer Plan was first reported, 98.5% of people with suspected cancer were being seen within 2 weeks, and subsequent performance has been consistently above the 93% standard (Figure 21), until the first quarter of 2018/19 when performance slipped for the first time in a decade (although this may relate to a rapid increase in urgent referrals of patients with possible prostate cancer, following media publicity around two celebrities (see 4.11) and possible breast cancer, following a national breast cancer campaign for women over 70 years of age).
Figure 21: Urgent GP referrals and proportion seen within 14 days between Q4 2008/09 and Q2 2018/19, England
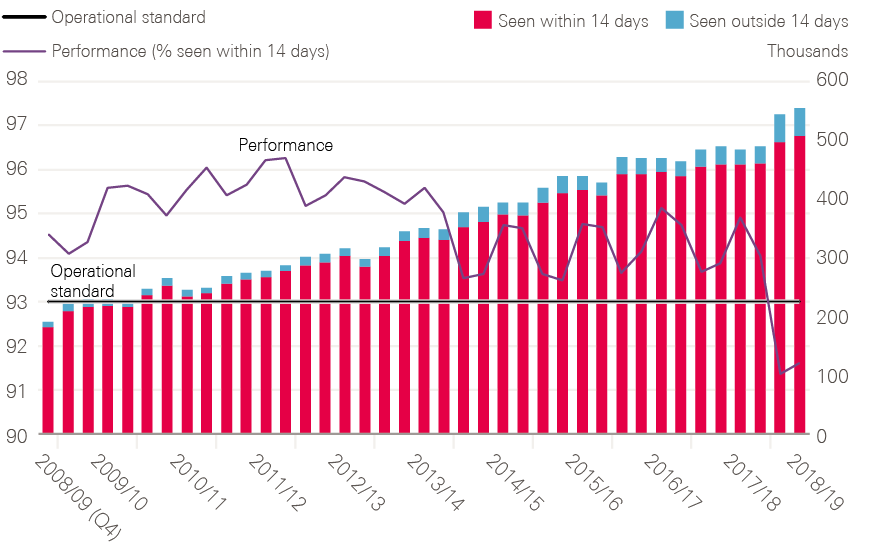
Data provided by Cancer Research UK. Source: Cancer Waiting Times – National Time Series – Provider based; NHS England (2018). Available at: www.england.nhs.uk/statistics/statistical-work-areas/cancer-waiting-times/ (accessed on 23 October 2018).
Figure 21 also shows a large increase in the number of patients being referred through the urgent, ‘2-week wait’ route. By 2017, almost as many people were being referred every 3 months as had been each year in the early 2000s. Now, almost 2 million go through this route per annum. Of these people, around 8% are found to have cancer.
3-3-3 Influencing GP referral rates
While an increase in the volume of urgent referrals was not an explicit aim of the 2-week standard, it was accompanied by newly developed guidance for GPs. By common consent, among those interviewed for this report, primary care was relatively neglected in the early cancer strategies, including Calman–Hine and the NHS Cancer Plan.
In these early years, I don’t think the penny had dropped that, unless we could tackle the impact of primary care on access to cancer diagnosis and manage the gatekeeping function of GPs more effectively, we wouldn’t be able to get the improvement in outcomes that we were seeking.
Peter Selby, Professor of Cancer Medicine, University of Leeds
This was partly a function of poor data on how patients were actually moving through the system, and a lack of appropriate guidance for GPs on how to interpret and spot symptoms. On average a GP will see around eight new cases of cancer each year, but will also see hundreds of patients with symptoms that could possibly be due to cancer.
The patients we send up the 2-week wait are the easy ones. We can do that with our eyes shut. Have they got red flag symptoms? Yes. The really difficult ones are the grey areas, the ones with only a 1–2% risk of cancer.
Dr Fiona Walter, Reader in Primary Care Cancer Research, University of Cambridge
The referral guidelines for suspected cancer were published in 2000 by the Department of Health, and covered all cancer types. These were sent to all GP practices and the breast cancer targets were the first to be achieved. However, these guidelines were largely based on the symptom profiles of patients diagnosed with cancer (in secondary care) not on those presenting in primary care.
In 2015 NICE published new guidelines (NG12) to help GPs know which patients should be referred urgently for suspected cancer. These reflect the growing body of primary care research, stimulated by the NHS Cancer Plan and National Awareness and Early Diagnosis Initiative, into the risk of cancer associated with individual symptoms or combinations of symptoms. The guideline sets a risk threshold of 3% as being appropriate for an urgent referral, though a recent large-scale study in primary care Prostate Cancer Intervention Versus Observation Trial (PIVOT) indicates that patients believe that a risk of cancer of 1% should trigger investigation or referral.
There have long been concerns, raised by patient groups and supported by evidence from academic studies, that referrals from GPs are sometimes made too late., A recent UK-based study found that, while the median interval between presentation to primary care and referral to secondary care for patients subsequently diagnosed with cancer was 5 days, this varied significantly (interquartile range 0–27) and was significantly faster for some cancers than others.
The causes of late diagnosis of cancer in general practice are still not fully understood. It is often suggested that the ‘gatekeeping’ role of GPs in the UK contributes to the problem. Research using patient vignettes found that GPs in the UK were much less likely to investigate or refer immediately than doctors in countries with higher cancer survival rates.
Efforts to encourage GPs to refer early for suspected cancer can also be met with resistance from commissioners under pressure to limit hospital referrals, and by limited secondary care capacity for diagnostic tests such as endoscopy. Wide variations persist between GP practices and CCGs in the use of the urgent referral route and in so-called conversion rates (the proportion of people referred who are subsequently found to have a cancer). Currently around 37% of all cancers are diagnosed through the urgent (2-week wait) route (as discussed further in section 3.3.4 and shown in Figure 22). A further 25% of patients subsequently diagnosed with cancer are referred non-urgently by their GP. This group experience much longer waits overall to diagnosis and treatment.
3-3-4 Routes to diagnosis: a fuller picture at last?
It wasn’t until 2010, 10 years after the original NHS Cancer Plan, that a more comprehensive analysis was available that could offer a new perspective on how patients with cancer reached the health system, and the subsequent impact on their survival rate. The ‘Routes to Diagnosis’ research project was one of the first major successes of the NCIN (see section 4.4). This linked datasets from screening services, cancer waiting time data, hospital episode statistics and cancer registries, which contain details of cancer type, staging and survival. The research was part funded by the Department of Health, part funded by Cancer Research UK, and was undertaken by the NCIN core team.
In 2010, the first briefing from the research was published, which looked at data from 2006. It contained a surprise: a much higher-than-expected rate of cancers diagnosed as emergencies in hospital, as the project lead at Cancer Research UK recalls:
This other category that we had not even known we were going to find, which was emergency presentations, it was nearly a quarter of all diagnoses coming through an emergency route. Politically, this was obviously seen as totally unacceptable and drove a whole load of initiatives and subsequently has driven metrics around the current cancer plan and cancer programme. One of the key metrics is now reducing the number of emergency presentations.
Sara Hiom, Director of Early Diagnosis and Cancer Intelligence, Cancer Research UK
Not only was the proportion of people presenting as emergencies a shock – nearly a quarter – but the data also revealed that, for some cancers, this was associated with much lower 1-year survival. Figure 22 shows the proportion of cancers diagnosed by each route, and Table 1 how 12-month survival varies by route of presentation for different cancer types.
Figure 22: Proportion of cancers diagnosed by each route for all cancers
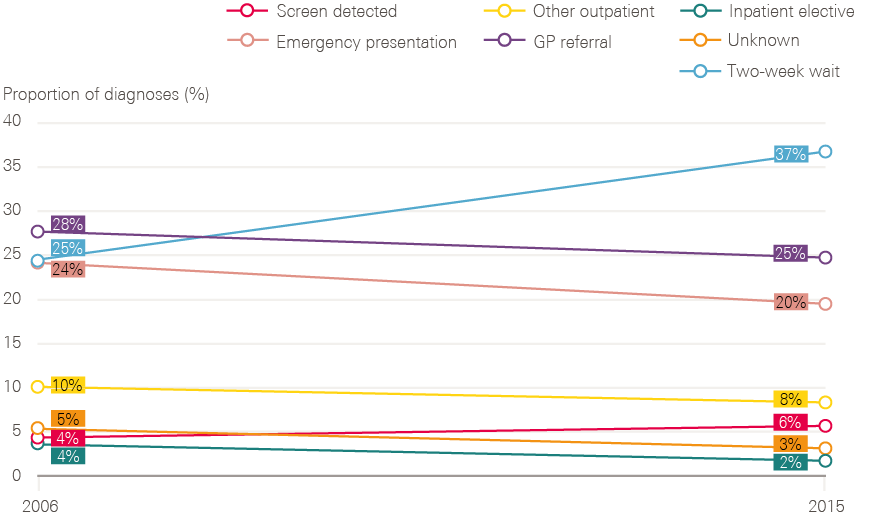
All cancers include all Malignant Neoplasms (excluding non-melanoma skin cancer). Percentages shown do not always total 100% due to rounding.
Source: Routes to diagnosis, National Cancer Registration and Analytical Service, Public Health England. Available at: www.ncin.org.uk/publications/routes_to_diagnosis (accessed on 22 October 2018).
Table 1: 12-month net survival rate for breast, colorectal, lung and prostate cancers diagnosed by each route (2011–15 cohort)
|
All routes |
Screen detected |
Two-week wait |
GP referral |
Other outpatient |
Inpatient elective |
Emergency presentation |
|
|
Breast* |
96.2 |
** |
97.5 |
93.3 |
92.1 |
87.4 |
57.2 |
|
Colorectal |
76 |
97.6 |
83.1 |
81.5 |
78.8 |
84.1 |
50.6 |
|
Lung |
36.2 |
*** |
46.5 |
47.5 |
52.7 |
34 |
16 |
|
Prostate |
95.8 |
*** |
98.4 |
98.8 |
95.7 |
97.5 |
64.8 |
* Female breast cancer only, not including female breast (in-situ). ** Due to a small number of deaths in the screen-detected cohort, 12-month net survival estimates are not available. *** Not applicable – no national screening programme.
Source: Routes to diagnosis, National Cancer Registration and Analytical Service, Public Health England. Available at: www.ncin.org.uk/publications/routes_to_diagnosis (accessed on 22 October 2018).
There has been progress across all cancer types, with more people referred under the 2-week wait and a consistent drop in emergency presentations (Table 2). There are no comparable data of this kind for other health systems. In the case of colorectal cancer, it also shows the potential for screening to improve outcomes (in 2006 the bowel screening programme was yet to start).
Table 2: Percentage of people diagnosed at emergency presentation, 2006 and 2015
|
Percentage of cancers diagnosed at emergency presentation |
||
|
Primary cancer site |
2006 |
2015 |
|
Brain |
64 |
51 |
|
Liver |
48 |
41 |
|
Pancreas |
50 |
44 |
|
Lung |
39 |
33 |
|
Stomach |
34 |
30 |
|
Ovary |
31 |
27 |
|
Kidney |
28 |
21 |
|
Colorectal |
27 |
23 |
|
Oesophagus |
23 |
19 |
|
Bladder |
20 |
18 |
|
Cervix |
12 |
10 |
|
Prostate |
11 |
7 |
|
Breast |
5 |
4 |
|
Melanoma |
3 |
2 |
The gradual accumulation of evidence about the importance of early diagnosis and its multi-faceted nature has led to something of a policy crossroads around the role of primary care. On the one hand, there are strong arguments for empowering GPs to do more diagnostic work:
An inordinate amount of time is spent chasing missing results so, if I wasn’t sending them away, if I had a point of care test to use with the patient with me, I would be triaging there and then with an immediately available test result, to be able to make a much more informed management decision on whether or not a patient needed a referral or a test that was undertaken in hospital. My analogy is that I have no idea why I can take my dog to the veterinary surgeon and the dog is worked up and managed in half an hour. It has its x-ray and it has its blood test and it’s starting on a treatment, and I cannot do the same for my child.
Dr Fiona Walter, Reader in Primary Care Cancer Research, University of Cambridge
On the other hand, there is a growing belief that the gatekeeping function of general practice might need to be side-stepped completely. In practice, this may need a combination of more diagnostics in primary care (eg FIT for patients with non-alarming bowel symptoms) and increased referral (or routes which bypass general practice) for other conditions, for example low-dose CT scanning for possible lung cancer.
Since 2015, Cancer Research UK and Macmillan Cancer Support have been working with the NHS to explore a range of projects designed to diagnose patients earlier. The Accelerate, Coordinate, Evaluate Programme (ACE) is now on its second wave, exploring the impact of ‘one stop shop’ diagnostic centres. In April 2018, NHS England announced 10 ‘rapid diagnostic and assessment centre’ pilots designed to accelerate cancer diagnosis. These allow GPs and other health care professionals to rapidly refer people with non-specific symptoms which would otherwise not fit existing 2-week wait pathways. For Sean Duffy, (National Cancer Director 2013–15) who worked with the charities to get the ACE programme running, the Department of Health and Social Care-funded evaluation of wave 2 is eagerly awaited to see if it will deliver gains for patients with cancer and other diseases:
This is not just for cancer, because the patients don’t pitch up [at the GP] with a cancer label, they come in with a set of symptoms that you are worried about. At the moment, if it’s a red flag [symptom] you get taken care of, but anything else – I describe this ping-pong of activity that goes on, in and out of different ‘ologys.’ It’s not just about cancer, the same will happen if you’re breathless.
3-3-5 Improving the speed of diagnosis in the hospital sector
Meeting the 2-week waiting time standard required local networks to first map and then redesign how referrals moved between GP practices and hospital outpatient departments. Much of the early work in networks was supported by the Cancer Services Collaborative, to get people in one room and map their services:
I remember having a day with the GPs about getting more rapid access to our outpatients. We identified, I think, it was 24 steps from a GP saying, ‘I’m going to refer,’ to actually being seen. We got it down to three, I think, after a couple of months. My biggest success was getting the pathology turnaround time reduced by a week overnight just by timing when the porters came and picked up the collections from the biopsy suite or bronchoscopy suite.
Mick Peake, Professor of Respiratory Medicine and former Cancer Services Collaborative Lung Cancer Lead
Meeting the other dimensions of the waiting time targets required even more complex work across different hospital departments, including imaging and pathology. Most patients presenting with possible cancer require a combination of clinical assessment, some form of imaging (eg ultrasound, CT or MRI scanning or mammography) and a biopsy to confirm or exclude the diagnosis. For some cancers, biopsy may require an internal inspection of an organ (eg stomach, colon or bladder) via an endoscopy. Once the diagnosis of cancer has been made, further tests may be needed to assess the extent of spread of the disease (staging) and to determine the most appropriate treatment (eg molecular tests to assess likelihood of response to particular drugs). The arrival of new tests, and in particular the expansion in genetic testing of tumours, enable treatments to be targeted at patients who are most likely to benefit. This does, however, mean that, for many cancers, diagnostic pathways are now far more complex, involving a greater range of tests and processes before treatment can begin.
Despite the increasing complexity of the diagnostic process, the targets set nearly 20 years ago in the NHS Cancer Plan are still in force: 1 month between diagnosis and treatment for all cancer patients (the 31-day target; 96% of patients to be treated within this time), and 2 months between urgent GP referral and first treatment (the 62-day target; 85% of eligible patients). Both targets had to be met by 2005. The 62-day target was met and exceeded in 2006 (Figure 23), and maintained until 2013/14 (Figure 24).
Figure 23: Proportion of urgent GP referrals resulting in treatment within 62 days between May 2005 and July 2006, England
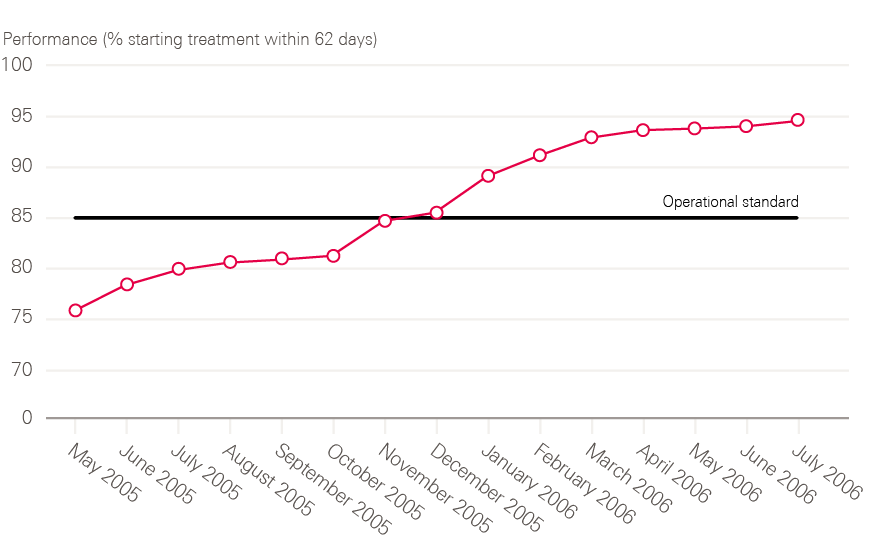
Source: Department of Health Cancer Waiting Times Database; Waiting Times for Cancer: Progress, lessons learned and next steps (October 2006). A report to the Secretary of State by Professor Mike Richards.
Despite an injection of capacity, of both equipment and workforce, the 62-day target proved tricky to meet. A progress report published by the Department of Health in 2006 conceded that ‘little overt progress’ had been made between 2000 and 2004. As a result, the efforts of the Cancer Services Collaborative, an Institute for Healthcare Improvement-inspired improvement programme set up in 1999 by the now disbanded Modernisation Agency, were beefed up with much more stringent performance management from the Department of Health from 2004. A national weekly data collection was set up to feed information back to the Department of Health and the Prime Minister’s Delivery Unit.
Figure 24: Urgent GP referrals resulting in treatment and proportion seen within 62 days between Q4 2008/09 and Q2 2018/19, England
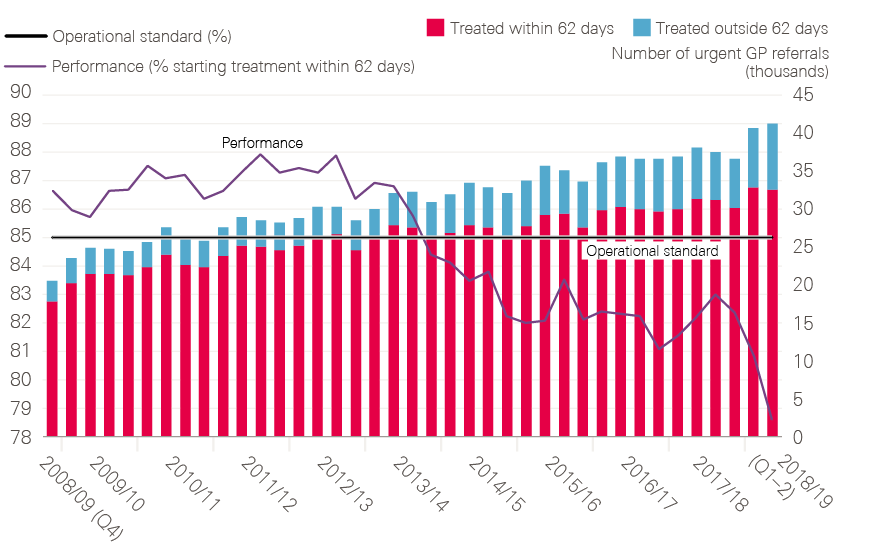
Source: Data provided by Cancer Research UK. Source: Cancer Waiting Times – National Time Series – Provider based; NHS England (2018). Available at: www.england.nhs.uk/statistics/statistical-work-areas/cancer-waiting-times/ (accessed on 23 October 2018).
Laggard trusts were identified for additional ‘support,’ as Janet Williamson former Director of the Cancer Services Collaborative remembers:
We had the ‘naughty 30’. If you remember, the Department of Health team had every single trust and where it was positioned on the grid, and I think that’s probably one of the first times that had ever been done. Well, it was the first time, but there was a huge resource behind that. There were 20 or 30 staff, weren’t there, working on data, and then we had that red list of about 30, but a lot of that came out of that PMDU [Prime Minister’s Delivery Unit], the tracking, and the monitoring.
This heavy-duty performance management worked: in the 2006 report’s own words, progress was ‘spectacular’ from September 2005, with both targets met from July 2006, and maintained thereafter. Trusts whose performance was felt to be lagging were supported by an ‘Intensive Support Team’ (IST), yielding often-dramatic improvements in performance (Figure 25).
Indeed, there was enough confidence about the permanence of the improvement made to this aspect of the pathway that, in 2010, the new Secretary of State for Health, Andrew Lansley, requested that a committee consider whether these standards needed to be retained at all. The committee decided that the targets benefitted patients and should be retained at national level.
Figure 25: Progress resulting from the interventions of the Intensive Support Team on the group of 30 trusts originally selected for support
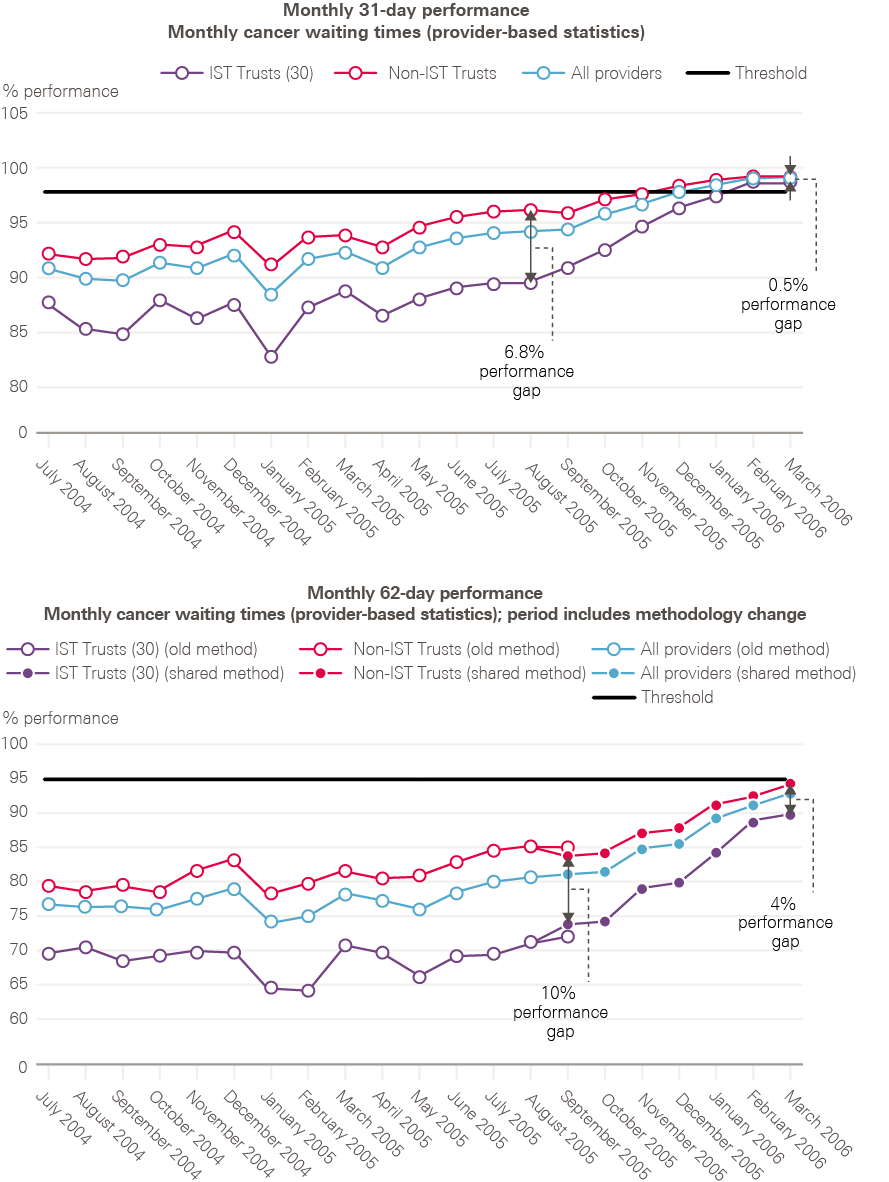
Note: 62-day performance statistics are only comparable from September 2005. Source: Waiting times for cancer – Progress, lessons learned and next steps; Department of Health (2018).
It is important to note that the 62-day standard does not apply to patients who are referred through a non-urgent route, though the 31-day diagnosis to treatment standard does apply to these patients as well as to those who are referred urgently. The original NHS Cancer Plan set an ‘ultimate goal’ that patients should start treatment within 1 month of urgent referral by 2008, which was ‘in line with the best that patients experience in Europe and the USA’.
The goal for all patients (whether referred urgently or not ) to be diagnosed and treated speedily was revived as a ‘Faster Diagnosis Standard’, recommended in the 2015 strategy, Achieving world class cancer outcomes. This states that all patients should have cancer diagnosed or excluded within 28 days of referral by a GP by 2020. This is now being piloted and data collection methods are being established before full rollout.
Figure 26: International comparison of the number of CT scanners (per million population) in 2015 (or nearest year)
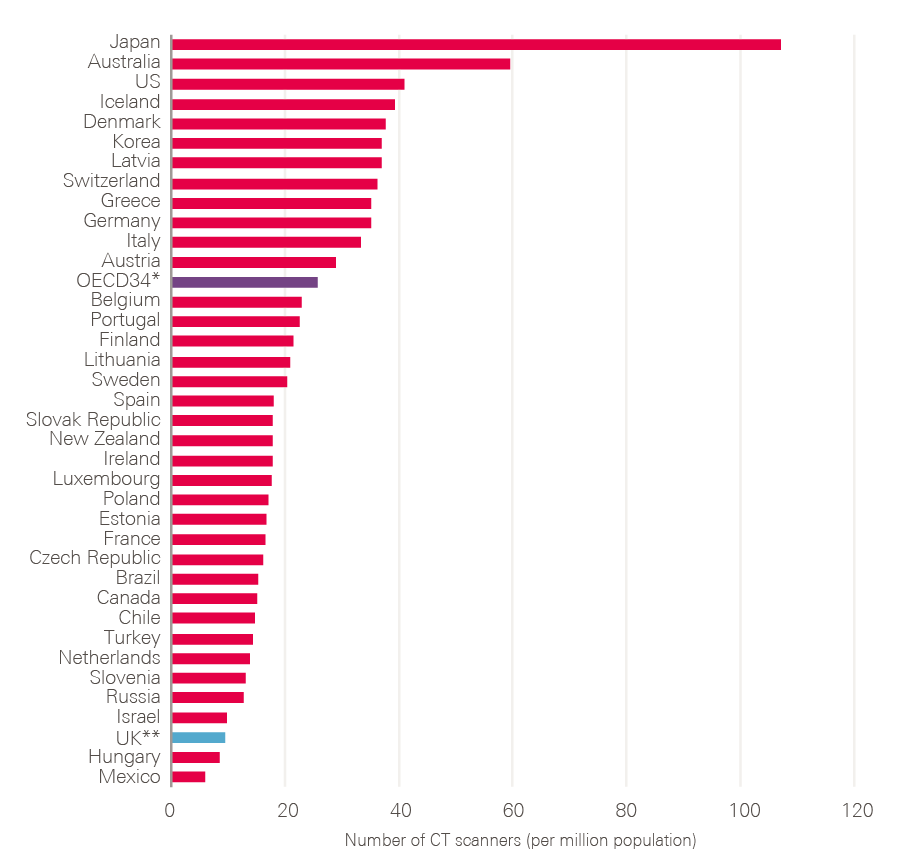
* The OECD average is calculated for the 34 OECD countries for which data were available. ** The UK data used in this comparison are from 2014.
Source: OECD Health Statistics (2017). Available at: www.oecd-ilibrary.org/social-issues-migration-health/health-at-a-glance-2017_health_glance-2017-en (accessed on 22 October 2018).
This new standard is likely to be extremely difficult to meet. Meanwhile, performance against the 62-day standard has continued to deteriorate (Figure 24). As the number of patients referred in to these pathways, and the complexity of the pathways themselves increases, there are concerns that there may not be enough scanning equipment, and workforce to use it. Figures 26 and 27 demonstrate that the UK lags right at the bottom of the OECD in terms of absolute numbers of CT and MRI scanners, ranking 35th out of 37 countries for CT, and 31st out of 36 for MRI.
Unsurprisingly, given the relative paucity of equipment, the UK also lags far behind in terms of absolute numbers of scans done. Although the number of CT and MRI scans being done in the UK has risen steadily over the past 10 years, OECD data suggest 79.3 CT scans/1,000 population occur in the UK compared with the OECD average of 143.1 (ie 80% higher in the OECD than in the UK). For MRI, the UK average of 52.6 MRI scans/1,000 population lags significantly behind the 64.8/1,000 OECD average, 23% higher than the UK (of note, the datasets do not allow us to look specifically at scans for cancer or suspected cancer).
Figure 27: International comparison of the number of MRI units (per million population) in 2015 (or nearest year)
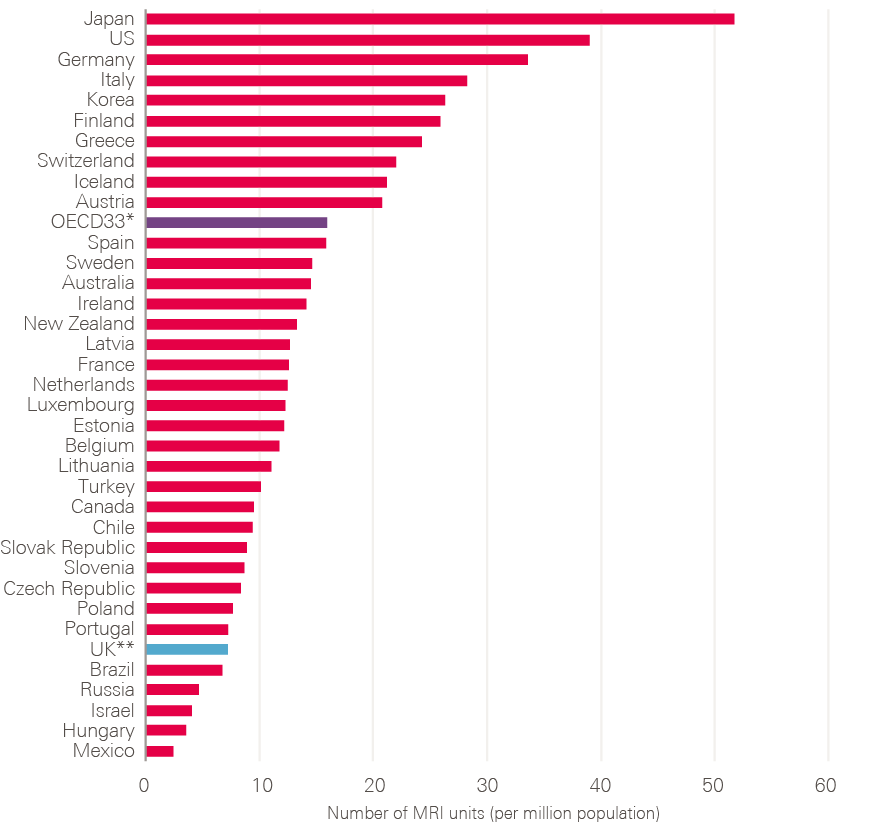
* The OECD average is calculated for the 33 OECD countries for which data were available. ** The UK data used in this comparison are from 2014.
Source: OECD Health Statistics (2017). Available at: www.oecd-ilibrary.org/social-issues-migration-health/health-at-a-glance-2017_health_glance-2017-en (accessed on 22 October 2018).
The lack of endoscopy capacity discussed elsewhere in this report risks becoming a rate-limiting step in the ability to get more people through diagnostic pathways. In 2010/11 crude colonoscopy rates were calculated by the Department of Health and compared to those in Norway, Scotland, Poland, Australia and two provinces in Canada (Table 3).
Table 3: Colonoscopy rates per 1,000 population 2010/11
|
England |
8 |
|
Norway |
10 |
|
Scotland |
12 |
|
Poland |
12 |
|
Australia |
22 |
|
Alberta (Canada) |
21 |
|
Nova Scotia (Canada) |
26 |
Source: Unpublished analysis by the Department of Health.
Figure 28 shows a gradual increase in all-cause endoscopy numbers since 2007, and anecdotally we were repeatedly told that this slow rise has not kept pace with increased demand.
Figure 28: Number of colonoscopies, flexi sigmoidoscopies, cystoscopies and gastroscopies completed between 2007 and 2017
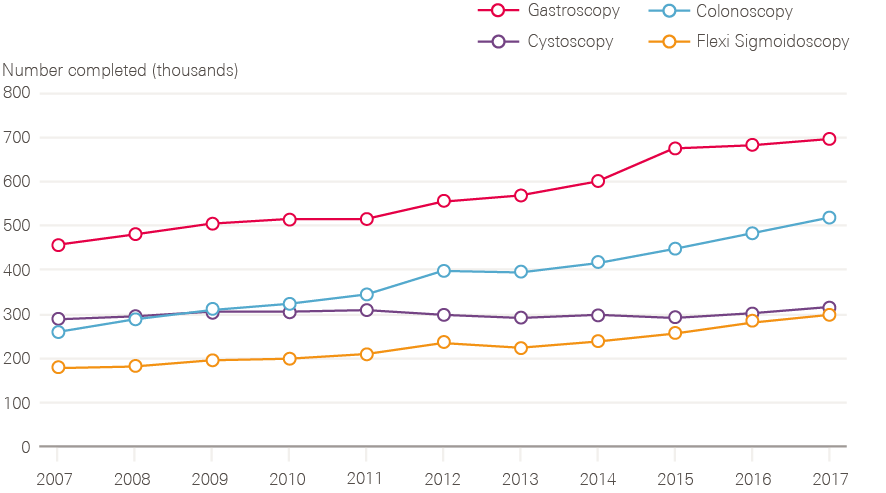
Source: Monthly Diagnostics Data; NHS England. Available at: https://www.england.nhs.uk/statistics/statistical-work-areas/diagnostics-waiting-times-and-activity/monthly-diagnostics-waiting-times-and-activity/ (accessed on 22 October 2018).
Slippage against the 62-day target (not consistently met in England since 2013/14) is likely to be due to a combination of factors, including the steadily rising numbers of urgent referrals, but also the cumulative effect of system change and funding restrictions since 2013.
3-4 Better cancer treatment
There are three main approaches to treatment of cancer: surgery, radiotherapy and systemic therapies (which include chemotherapy, hormonal therapies and newer biological/immunological treatments). All three approaches have improved over the past 20 years. They are often used in combination, for example surgery plus radiotherapy plus chemotherapy/hormonal therapy for many patients with breast cancer. They can also all be used either with curative or palliative intent. For example, surgery can be done to relieve bowel obstruction and thereby improve symptoms, even when it is clear that this will not be curative. Similarly, radiotherapy for a bone metastasis can be very effective at relieving pain, but will not provide a cure.
Surgery cures more patients with cancer than the other methods, and is often the least expensive. Chemotherapy is often thought (by non-experts) to have the greatest impact on survival, but overall this is not the case. It does, however, vary by cancer type. For leukaemias, lymphomas and testicular cancers, chemotherapy is of central importance.
The role of adjuvant therapy (usually given after surgery to reduce the risk of relapse) has grown markedly in the past 20 years for breast and colorectal cancers – and some others. This has been in response to evidence from clinical trials of improved survival.
One of the key problems 20 years ago was that patients were not being assessed by teams with expertise in all of these methods and were therefore missing out on treatments. This was the prime reason for establishing MDTs. For surgery, there was an additional problem that some patients requiring complex surgery were being treated by surgeons who only rarely performed that surgery.
Although Calman–Hine recognised these problems (and hence recommended centres and units), Kenneth Calman also recognised that much more detailed guidance was needed on individual cancers. This led to the Improving Outcomes Guidance programme, which was supported by rigorous evidence reviews.
The NHS Cancer Plan did not go into detail about the different types of cancer treatments and how they were to be improved. The focus instead was on implementation of the approach outlined in Calman–Hine, providing a timetable for producing service guidance for each cancer type, rolling out peer review across the country to underpin scrutiny of the guidance, and, via the cancer networks, ensuring that all patients were seen by multidisciplinary cancer teams. The recommendations about the most up-to-date (and cost-effective) cancer drugs now became the responsibility of NICE.
3-4-1 Multidisciplinary teams: the cornerstone of high-quality care
Good decision making on cancer treatments almost always requires input from several different specialists, together with good communication with, and involvement of, patients. Although the combination of specialists required varies between cancer types, most commonly this involves surgeons, clinical oncologists, medical oncologists, pathologists, radiologists and nurse specialists working together as a team, with administrative support.
Before the Calman–Hine report (1995) this form of MDT working for cancer was the exception rather than the rule. MDTs had existed in some specialist centres for decades, but the large majority of patients were not benefitting from this approach. MDT working became formalised for breast cancer before other cancers, partly as a result of the introduction of breast screening in the late 1980s. However, despite this, the British Breast Group (a multidisciplinary group of experts in different aspects of breast cancer) felt the need to publish a report in 1994 making the case for MDT working becoming the norm.
Although advocated by the Calman–Hine report, in 2001 the Commission for Health Improvement reported that progress on MDT working in the years between 1995 and 2000 had been patchy.
Improving Outcomes Guidance reports were subsequently used as a vehicle for encouraging MDT working, with each of those published between 1996 and 2005 re-emphasising the need for MDTs and specifying the range of specialists required in them. These requirements were then reflected in the standards used for the national cancer peer review programme (described more fully in section 4.3). This combination of evidence-based guidance, peer review and MDTs is seen by many as having made a crucial difference to the quality of cancer care.
There’s no question but that the widespread adoption of an MDT-based system of management has led to improvements of practice across the board. I mean, sad to say that the most important change is probably stopping maverick clinicians doing what they had decided, on very little evidence, was the best thing to do for this patient because that’s what they always did for this patient.
Professor Sir Alex Markham, Professor of Medicine, University of Leeds, and former Chief Executive of Cancer Research UK
It enforced non-tribal working. It looked at whole pathways of care. It’s made two groups of people in particular perform in front of an audience, where the quality was woeful. That is, radiologists and pathologists. It frankly made people raise their game, because otherwise they were embarrassed on a weekly basis. So, rapid change of quality of both reporting and relevance to clinical decision making.
Adrian Crellin, Consultant Clinical Oncologist, Leeds
There are now around 2,000 cancer MDTs in England, with the vast majority of patients being managed by such teams. The workload associated with reviewing every cancer case at a formal MDT meeting is now being reviewed. In some cases, MDTs can be over-burdensome for staff, and approaches that streamline processes while retaining the benefits of multidisciplinary input are now needed.
3-4-2 Surgery
Calman–Hine recommended that complex cancer surgery should be undertaken in specialist centres and that reconfiguration would be needed. The Improving Outcomes Guidance provided more detailed evidence reviews to support this and recommended numbers of procedures that should be done in centres. This had big implications for the workforce and local hospitals, as the architect of the Improving Outcomes Guidance remembers:
Roles would become more specific. The generalists would stop fiddling around with stuff and the specialists would do more of that work.
Bob Haward, Professor of Cancer Studies, University of Leeds
The approach for each cancer was set out in the respective Improving Outcomes Guidance. Implementation was the responsibility of cancer networks and progress was monitored through peer review, with oversight by the National Cancer Action Team.
Some types of surgery needed more change than others. While breast and colorectal remained largely based in district general hospitals, lung and brain surgery were already specialised. For breast cancer, surgery in district general hospitals reflected the large volume of patients requiring surgery, while for colorectal cancer the need to have surgeons available to deal with non-cancer-related emergency abdominal surgery ensured that colorectal surgeons remained in district general hospitals. Surgery for prostate, bladder and oesophagus/stomach needed the biggest overhaul, along with some head and neck, and gynaecological procedures.
As an example, in 1997/98, 17% of surgery for prostate or bladder cancer was done in trusts doing fewer than nine procedures a year. In 2006/07 that had dropped to 2%, whereas 77% of surgery was done in trusts undertaking more than 40 cases a year (Table 4).
Table 4: Change in prostatectomy and cystectomy procedure volume by location over time
|
% of procedures taking place in trusts undertaking: |
1997/98 |
2006/07 |
|
1–9 procedures per annum |
17% |
2% |
|
10–39 procedures per annum |
71% |
21% |
|
40+ per annum |
12% |
77% |
Source: Cancer Reform Strategy: first annual report (2008).
Driving these shifts was the evidence assembled in the Improving Outcomes Guidance. The presence of a credible evidence base, according to Professor Bob Haward, was crucial in reconfiguration:
We were able to propose quite radical reconfigurations which the world broadly accepted. I mean, there were fights here and there about particular places and how it would be interpreted in this part of the country or that. I remember being called before the national committee of the clinicians involved in upper GI. Allegedly we were going to have our balls removed and hung out to dry. As it was, we came into a room full of people who were lying on their backs with their paws in the air and, in a way, it demonstrated that, really, it was hard to fight it and they, in the end, didn’t.
Bob Haward, Professor of Cancer Studies, University of Leeds
For some cancers, particularly lung cancer, the focus has been on increasing the number of patients receiving surgery. This work has been led by chest physician Mick Peake, who remembers a ‘completely and totally nihilistic attitude’ towards lung cancer among fellow clinicians:
A very prevalent view was that this [lung cancer] was all smoking related and self-inflicted, and they all died anyway, and it’s nothing to do with the chest physicians. So, I just felt it needed fixing really. It was an obvious clinical need that hadn’t been addressed.
Armed with evidence from peer review and subsequently from the National Lung Cancer Audit that patients with operable disease were often not being referred for surgery, Mick Peake demonstrated that it was possible to triple the surgery rate for lung cancer (in one cancer network) within a year, with the help of the Cancer Services Collaborative improvement team. Spreading these improvements across all cancer networks was catalysed by the release of the first lung cancer audit in 2005. Between 1985 and 2005, there were, on average, about 3,000 lung cancer operations a year.
In 2016, it was 7,250, and 2017’s going to be above that. So, the number of operations has more than doubled. They’re doing complex procedures. The average age of those being operated on has increased, and the mortality rate has dropped at the same time. So, they’re dealing with an older, less fit, more complex, more advanced stage surgery, and the mortality rates are now below anything international.
Mick Peake, Professor of Respiratory Medicine and former Cancer Services Collaborative Lung Cancer Lead
Surgical technique has also evolved. Surgery is now undertaken in situations that would not have been possible 20 years ago, for example liver resections (to remove metastases from colorectal cancer in the liver). There have also been major developments in minimally invasive forms of surgery, including sentinel node biopsy in breast cancer, and laparoscopic surgery for colorectal cancer (the adoption driven by a national training programme, underpinned by the bowel cancer audit). In breast cancer, the practice of surgery has changed, moving away from mastectomies towards breast conservation and reconstruction.
Another major surgical change has been breast reconstructive surgery, which has gradually developed over the last 20 years to the point that, at the Royal Marsden Hospital, 50% of our patients choose breast reconstruction at the time of mastectomy. We’re at the point where we’re using the biology of the cancer more than the disease extent and stage, to guide the initial treatment. Treating the cancer with drugs such as chemotherapy, Herceptin and Letrozole as the first treatment has the potential to allow us to de-escalate from radical surgery such as mastectomy and axillary clearance to more conservative surgery preserving the majority of the breast and axilla. There are increasing numbers of women who will not benefit from radical surgery if the cancer shrinks or disappears on the initial drug treatment. So, in the future, the next decade or so, we will be looking at the role of surgery and its sequencing with the other cancer treatments so we get the best survival outcomes for minimal surgery and complications.
Fiona MacNeill, Consultant Breast Surgeon, Royal Marsden NHS Foundation Trust
3-4-3 Radiotherapy
Radiotherapy is a vital component of cancer treatment, and has been used since 1899. It can both help cure and alleviate symptoms. By the end of the 1990s, it was clear that there was an inadequate provision of radiotherapy machines and staff to operate them. This was a legacy of underinvestment in a sector that had once looked as though it might be made redundant as an effective treatment of cancer. As a leading cancer specialist remembers:
You know, when I started [my career] in 1985 a senior colleague called me aside and said, ‘Are you really sure you want to do this? You do realise that everything’s going to be cured by chemotherapy and that radiotherapy is a complete waste of time.’ In the 1970s and 80s, various figures had very clearly signalled the death of radiotherapy and it, therefore, became a Cinderella thing, underinvested, and the quality actually went. We just lost all momentum to keep pace with what was going on in the rest of the world, which was a massive acceleration of complexity and technology.
Adrian Crellin, Consultant Clinical Oncologist, Leeds
Radiotherapy has consistently had a much lower public profile compared with chemotherapy and access to cancer drugs, which has had a powerful pharmaceutical industry behind it, and attracted much more media interest. Nevertheless, there have been important improvements in radiotherapy techniques. Examples of selected innovations are given in Box 1, all of which provide more targeted treatments, with fewer side effects for patients.
Box 1: Innovations in radiotherapy since 2000
Innovations in radiotherapy since 2000:
- Intensity-modulated radiotherapy
- Image-guided radiotherapy
- 4D adaptive radiotherapy
- Stereotactic ablative radiotherapy (also known as stereotactic body radiotherapy)
- Proton beam therapy
While the number of episodes of radiotherapy has broadly increased over time, the trend has levelled off in the past 2 years (Figure 29). The proportion of patients receiving intensity-modulated radiotherapy is currently increasing year on year, from 32% in 2014/15 to 46% in 2017/18.
There have been several pulses of central capital investment in equipment, the largest in 2000, and from 2015 in terms of volume of new machines (Table 5). Radiotherapy is administered by a machine known as a linear accelerator, or linac. Linacs last around 10 years and then need to be replaced. Expanding radiotherapy therefore needs both a rolling programme of renewal and upgrading, alongside the purchase of new machines.
Figure 29: Radiotherapy activity in England, 2009/10 to 2017/18
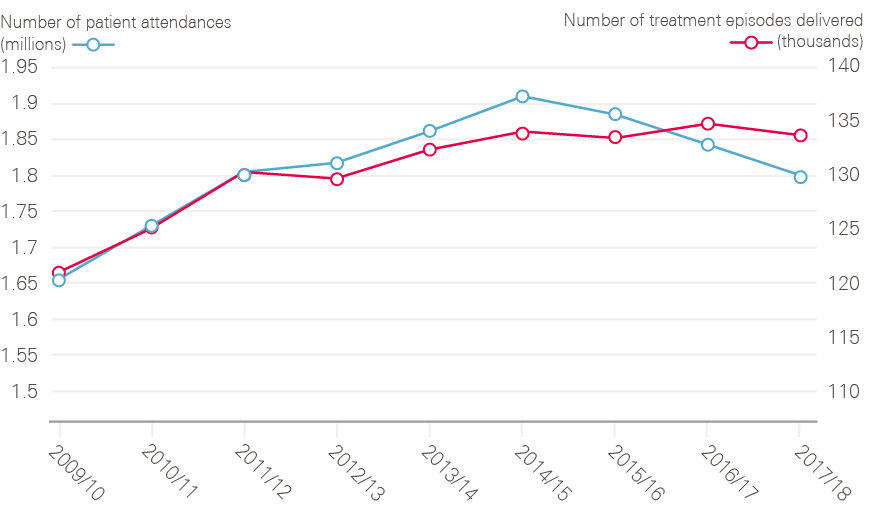
Data provided by National Cancer Registration and Analytical Service, Public Health England. Source: Radiotherapy Dataset (RTDS), NCRAS, Public Health England.
Table 5: Central capital investment in equipment
|
Year |
Funding/numbers of machines |
|
|
NHS Plan/Cancer Plan |
2000 |
106 linacs (cost unknown) |
|
Innovation Fund |
2012 |
£23m |
|
Proton beam therapy |
2012 |
£230m for two centres |
|
2015 Cancer Strategy |
2015–2018 |
£130m for new and renewed linacs |
In 2000, the NHS Plan promised 50 new linacs, and the NHS Cancer Plan a further 56, funded through the National Lottery. National oversight of investment and implementation rested with the National Cancer Action Team, assisted by a National Radiotherapy Advisory Group and an implementation group.
Despite the investment in 2000, a report commissioned by the Department of Health and published in 2007 concluded that the pace of the growth in demand for radiotherapy had been underestimated and that more capacity was urgently needed. The report estimated a 63% gap between existing and optimal radiotherapy levels for patients, and an ‘unacceptable’ variation between regions. It called for a 91% increase in activity to meet demand, by 2016. The report also highlighted that action to train more therapeutic radiographers since 2000 had been hampered by high attrition rates (ie students not completing the training), of 35%.
The 2007 Cancer Reform Strategy did not allocate additional investment for radiotherapy, but it was hoped that the inclusion of radiotherapy in the 31-day treatment target would focus the attention of local hospital trusts and commissioners on the need to invest locally in adequate services.
In 2012, the government committed £230m to build two proton beam therapy centres, in Manchester and London, to treat a minority of patients who would otherwise have had to travel abroad. (The first machines are due to begin work in 2018.) The most recent tranche of investment (£130m) was made following the 2015 strategy (Achieving world class cancer outcomes), to renew and replace linacs across England.
Two themes emerged from interviews. First, it has been difficult to incentivise trusts to invest consistently in renewing equipment, and a second (related) theme is the challenge of spreading innovative techniques. While national action has been important to kick start the use of new techniques, such as intensity-modulated radiotherapy and proton beam therapy, some interviewees questioned why national bodies are still expected to identify gaps and provide funding for routine equipment renewal in trusts, despite the creation of a national tariff for radiotherapy activity, which includes an element to cover depreciation.
Radiotherapy services have suffered through lack of investment in the latest technology and due to trusts not seeking to ensure that funding from the radiotherapy tariff is kept aside for essential equipment replacement. Whilst government handouts of funding are welcome in rectifying this problem in the short term, it doesn’t encourage trusts to plan appropriately for the next round of equipment replacement. Either equipment should be managed, ie funded at the national level, or trusts incentivised to ensure they plan for replacement on a regular and rolling basis.
Charlotte Beardmore, Director of Professional Policy, Society of Radiographers
Expanding access also depends on recruiting additional staff. But the adoption of new technologies seems to have compounded an already challenging workforce planning task, complicating some tasks (and requiring better treatment planning), while simplifying others:
The technology is getting ever better, and you can bend and shape a beam in whatever direction you like these days. It’s much more technically demanding so some radiotherapy now has been pushed off to radiographers, the simple breast post-lumpectomy radiotherapy, which is pretty straightforward. But planning in 3D and with CT and MRI scanners obviously takes time.
Adrian Crellin, Consultant Clinical Oncologist, Leeds
In early 2018, an All-Party Parliamentary Group (APPG) for Radiotherapy was formed and published a ‘manifesto.’ This highlighted the relatively low spend on radiotherapy (5% of the cancer treatment budget) and called for investment in new radiotherapy equipment, to bring the UK in line with some other comparable countries (Figure 30).
Figure 30: International comparison of radiotherapy equipment (per million population) in 2017 (or nearest year)
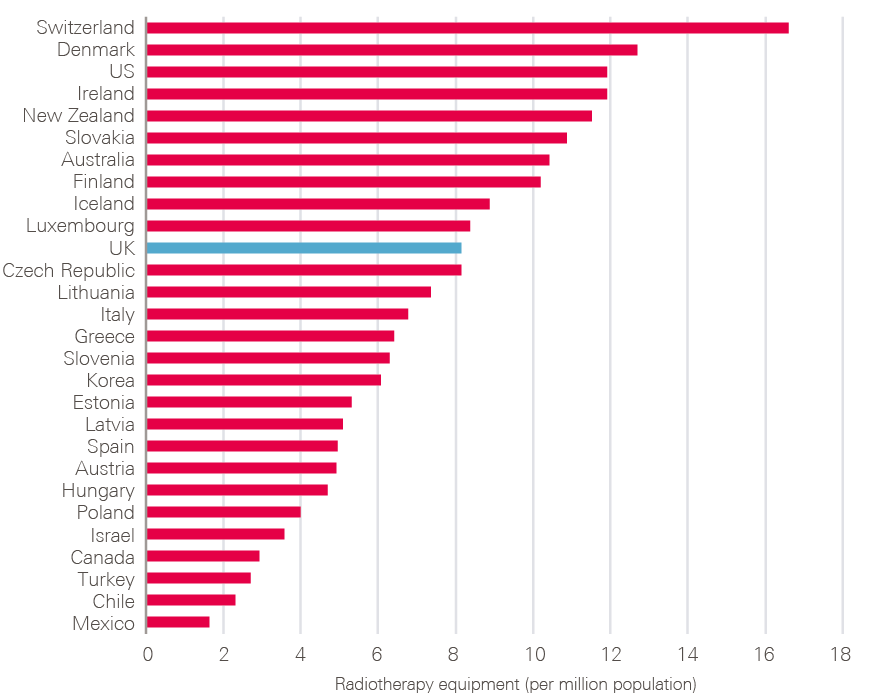
Source: OECD (2018), Radiotherapy equipment (indicator). Available at: https://data.oecd.org/healtheqt/radiotherapy-equipment.htm (accessed on 15 October 2018).
3-4-4 Chemotherapy and other systemic treatments
Chemotherapy, used on its own and in combination with other forms of treatment, is the third vital component of cancer treatment. It is by far the most expensive, and access to chemotherapy has been transformed since 2000. There has been very significant improvement in the use of what might now be called ‘old’ drugs and the development of novel, targeted treatments.
A far higher proportion of patients with cancer are now treated with drugs than 25 years ago, although this is difficult to quantify as good data on chemotherapies were not collected until recently. The increase is partly because chemotherapy is now being used for some cancers for which this was previously rare (eg cervix, prostate, non small-cell lung cancer, oesophagus and stomach). In addition, expansion in the drugs available means that individual patients who might only have received one or two different regimes in the past might now receive five or more – gaining a response each time, but with the disease then progressing again.
The importance of improving access to cancer drugs pre-dated the NHS Cancer Plan. After the Downing Street cancer summit in 1999, 13 drugs were earmarked for urgent appraisal by the new NICE. A pivotal moment was the decision, in 2001, to make it mandatory for PCTs to fund positive NICE technology appraisals of new cancer drugs. Once a drug was approved by NICE, local commissioners had 3 months to ensure it was funded, and money was allocated to commissioners at a national level to enable this.
This led to an expansion of drugs available to cancer patients, at the same time as shifting, for a while, the political heat away from ministers about which drugs should be available.
The creation of NICE did not depoliticise chemotherapy for long. Pressure on NICE grew from the mid-2000s for patients to get access to drugs that had not yet been appraised by NICE, or had been turned down (see Box 2). In 2009, NICE relaxed its thresholds for certain patients at the end of life, but improving access to cancer drugs had become a campaign issue. In 2010, the new coalition government fulfilled a manifesto promise by announcing the creation of a Cancer Drugs Fund to allow patients access to drugs that were not routinely available on the NHS. In 2015, the NAO reviewed the fund: £968m had been spent on drugs for 74,380 patients between 2010 and 2015. It concluded that it is likely that the Fund has ‘contributed significantly to the improvement in the UK’s relative position in providing access to newer cancer drugs.’ But crucially, the NAO noted, despite this spending, there was no data to assess what impact these drugs had had on patient outcomes, such as survival, making it hard to assess what the benefits might have been if the money had been invested in other forms of treatment.
Box 2: The Herceptin story
Though many new cancer drugs have appeared in the past 20 years, few have had the impact of Trastuzumab – a targeted cancer drug, best known by its brand name Herceptin. Usually used to treat breast cancer expressing a specific protein, HER-2 (present in about 20% of breast cancers), Herceptin was first approved for medical use in the US in 1998. Thereafter followed a bumpy journey in to the NHS: an early test of Labour’s commitment to end postcode lotteries and of the fledgling machinery of NICE built to do just that.
Herceptin had been approved for use in the NHS in 2002, but only for metastatic breast cancer – a life-prolonging but not a life-saving intervention. By early 2005 though, the cancer research community was clear that the uses for Herceptin extended beyond patients with an already terminal diagnosis. In October 2005 the New England Journal of Medicine published the results of three trials designed to test the role of Herceptin as an addition to surgical treatment for primary breast cancer. Described as ‘simply stunning’ in an accompanying editorial, the case for an expanded rollout of Herceptin was becoming more evidence based.
In England the Secretary of State, Patricia Hewitt, moved quickly to make it clear that she wanted wider use of Herceptin to be approved for the NHS as a whole. Inconvenient then that the manufacturer, Roche, hadn’t even applied for a licence yet, a necessary step to enable an application to be submitted to NICE for approval. Hewitt made clear that NICE should ‘fast-track’ the drug as soon as an application was made, and encouraged PCTs to consider funding the unlicensed drug in the interim ‘because I think it is the right thing to do’. Such an intervention was, as the King’s Fund pointed out, ‘a substantial deviation from the procedures set up to recommend therapies for use in the NHS’.
This deviation though, had occurred in the face of unprecedented pressure from charities, patient groups and the media. A campaign group, Women Fighting for Herceptin, had been formed in 2005 with the aim of getting Herceptin free on the NHS for all who might benefit from it. A petition with more than 34,000 signatures was taken to Downing Street and the campaign group met with Minister for Health Rosie Winterton and received significant media coverage in print, on BBC Breakfast and on Woman’s Hour on Radio 4. As one journalist, then health editor at The Independent commented:
‘a story about breast cancer would sail into the paper…. you have a young mother dying, there’s almost nothing – with young children there’s almost nothing – that trumps that in terms of tugging the heartstrings. It’s a dreadful position’.
Cancer charities including Cancer Research UK, the Breast Cancer Campaign and Breakthrough Breast Cancer lobbied loudly, both in the corridors of Westminster and through copious column inches. When Ann Marie Rogers took Swindon PCT to a judicial review to challenge its refusal to give her Herceptin on the NHS in 2006, she lost the case, but won the media battle. Less than 6 months later, in August 2006, NICE licensed Herceptin for use as an adjuvant treatment in early stage breast cancer.
Data are now available from the Systemic Anti-Cancer Therapy Dataset on the numbers of patients treated in England and what was given for different cancers. In the 12-month period from March 2017 to February 2018:
- 212,344 different patients are recorded as having chemotherapy.
- 330,474 regimens were given (eg one patient can have two regimens, such as first and second lines of treatment and some therapies have two separate phases with different regimens).
- There were 1,160,551 cycles with 2,968,925 separate drugs within these cycles.
- Of these 212,344 different patients, chemotherapy was given for specialties in the following proportions:
- breast 19%
- urology 12%
- lower GI 11%
- lung 9%
- lymphoma 8%
- upper GI 7%
- myeloma 6%
- gynaecology 6%
- leukaemia 5%
- head and neck 2%
- skin 2%
- brain 1.5%
- paediatrics (0–16) 1.3%
- teenagers and young adults 0.8%
- sarcoma 0.7%
- miscellaneous 8%.
There has been a large increase in spending on chemotherapy. In 2017 around £2.5bn was spent on cancer drugs and their delivery, approximately 2% of the NHS budget. Chemotherapy is currently funded and managed as part of specialised commissioning in NHS England, and represents its single biggest cost pressure.
As regards the current £2.5bn expenditure by NHS England on chemotherapy: if you’d said this figure to me 5 years ago I’d have laughed. If you’d said that to me 10 years ago I’d have said ‘which country are you talking about?’. We have this because of the mandatory funding direction from NICE. Within NHS England Specialised Commissioning the expenditure on chemotherapy swipes four-and-a-half times the size of the nearest other single expenditure which is radiotherapy, which is £450m to £500m.
Professor Peter Clark, Chair, NHS England Chemotherapy Clinical Reference Group
Chemotherapy has, in some cases, revolutionised the lives of patients in the opinion of those we interviewed (see Box 3). The creation of a good-quality dataset, that can answer questions about the relationship between all the cancer drugs in use (rather than just the minority accessed through the Cancer Drugs Fund), alongside their costs and outcomes, has been slow:
I’m frustrated that we haven’t yet got the routine analysis of outcomes, you know, proper, meaningful outcomes such as treatment duration and survival. Well, for CDF [Cancer Drugs Fund] drugs where we’re investing heavily in SACT [Systemic Anti-Cancer Therapy] and PHE [Public Health England], we know we’re going to get those data and are beginning to get them now. For the routine access and outcome data, I still think it’s going to take another year or two.
Professor Peter Clark, Chair, NHS England Chemotherapy Clinical Reference Group
Box 3: Some of the ‘game changers’ in systemic treatments according to interviewees
Tamoxifen – Arguably the first game-changing systemic therapy, tamoxifen was discovered in 1962. It wasn’t until the early 1990s that a meta-analysis from the Early Breast Cancer Trialists’ Collaborative group conclusively showed that tamoxifen saved lives in early breast cancer. Since then it has become the mainstay for treatment of oestrogen-receptor positive breast cancer.
Trastuzumab – Approved by NICE in August 2006, trastuzumab (Herceptin) is used to reduce the risk of recurrence in breast cancers expressing the HER-2 protein. Usually given for 12 months, it can also be used in advanced HER-2 positive breast cancer to slow disease and extend survival.
Imatinib – Approved by NICE in October 2003, imatinib (Glivec) rapidly became the most common treatment for chronic myeloid leukaemia. A daily tablet, taken (often) indefinitely, Glivec has turned this into a disease that, in most cases, can be controlled for many years.
Rituximab – Approved by NICE in September 2003, rituximab has significantly improved survival for people with non-Hodgkin lymphoma as well as being used as a treatment for a variety of autoimmune diseases such as rheumatoid arthritis.
Pembrolizumab – a type of cancer immunotherapy which stimulates the immune system to fight cancer cells. It has recently been approved by NICE for metastatic melanoma, non-small-cell lung cancer, relapsed or refractory Hodgkin lymphoma and some advanced bladder cancers.
3-4-5 Patient experience and living with and beyond cancer
If you’re told you’ve got a cancer, there are three crucial questions, ‘Am I going to survive?’ ‘Am I going to be treated well?’ and ‘What am I going to be like afterwards?’ When we assess outcomes in cancer, in general, the easiest and most objective parameter, is ‘Am I going to survive?’
Adam Glaser, Professor of Paediatric Oncology, University of Leeds
This section deals with how well the cancer strategies have addressed the second and third of the questions above: patient experience, and living with and beyond cancer. An estimated 2.5 million people were living with cancer in the UK in 2015. This is predicted to rise to 4 million people by 2030. This reflects both the increasing numbers of new cancer cases, and improvements in survival in recent years.
Patient experience
The idea that patients’ experience of care is as important as their clinical outcomes seems uncontroversial now. But many clinicians interviewed for this report remember a time when providing patients with even the most basic information about their cancer did not always happen, as oncologist Adrian Crellin remembers from the early 1990s:
I was working in Pontefract where one woman, a lovely little old lady, really smashing, no faffing around, [said] ‘You look like a nice young man? I hope you don’t mind me asking, but is it cancer? I thought it probably was when I woke up from the operation and the breast was gone, but I didn’t want to bother the surgeon because he seemed to be in a rush and I didn’t want to trouble him. You look like a nice young man, I hope you don’t mind me asking.’ Those were the words that were used. I’ve never forgotten it. It was one of the most shocking consultations I think I’ve ever been in.
From the 1980s onwards, evidence emerged about the value of good information and psychological support for cancer patients, and the importance of good communication skills on the part of their clinicians. Patient charities, particularly CancerBACUP, had lobbied hard for information and support to be a normal part of treatment. In 2000, the NHS Cancer Plan promised a national patient survey for cancer, originally promised by Frank Dobson (then Secretary of State for Health) in 1998, to run alongside a similar survey for heart disease.
The first survey, of 65,000 patients from 172 trusts, was published in 2002, followed by another in 2004. Regular annual surveys then followed from 2010, known as the National Cancer Patient Experience Survey. Data are published nationally, but are also presented back to hospital trusts, with performance against individual questions marked in red, amber and green.
It was a powerful lever for trusts, they couldn’t ignore that, well they would try to sometimes, but it was hard to ignore the data around patients’ reports of poor experience. It was forensic and the whole traffic-lighting was very powerful in terms of being able to work at a granular level, at a trust level, even down to a team level, to drive change. It was hugely powerful.
Amanda Ramirez, Professor of Liaison Psychiatry, King’s College, London
In addition to the survey, the NHS Cancer Plan set up communication training for clinicians (evidence for which had been provided by a trial, led by Professor Lesley Fallowfield) and a review of information available to patients. There was ample ground to cover: in 2002, a review of cancer services by the Commission for Health Improvement and the Audit Commission found that only a quarter of consultants reported having had any communication skills training, and the written information available to patients was highly variable, with some only offering a few leaflets or none at all.
One of the components of a positive patient experience has been the presence of CNS, who provide cancer patients with information, support and continuity, in addition to clinical care. Their numbers have risen over the years, but it remains the case that not all cancer patients have access to a CNS. Research by Breast Cancer Care found that not all patients with metastatic breast cancer have access to a CNS, despite these being patients who may need the most support. The charity Macmillan Cancer Support has played a pivotal role in spreading CNS posts across the NHS. Macmillan has pump-primed CNS positions for 3 years, in return for continued NHS funding thereafter.
By 2011, the National Cancer Patient Experience Survey was able to shed light on whether important aspects of care were in place. For example, it demonstrated whether surveyed patients were actually receiving help from a CNS, and analysis showed that patients who received support from a CNS had a better experience. The survey also asks questions about whether patients were given their diagnosis in a sensitive way, provided with written information about their treatment, had side effects explained and were offered help managing symptoms.
Living with and beyond cancer
By the time of the second cancer strategy, in 2007, the quality of life for people who had survived cancer and completed their treatment came into focus, as research emerged about the poor quality of life reported by patients who had had bowel cancer and prostate cancer in particular. In 2008, the first estimate was made of the number of people living with cancer in the UK: 2 million (expected to grow by 3% a year), but the evidence base was limited about what interventions would best address people’s needs. A National Cancer Survivorship Initiative (NCSI) was set up, in collaboration with Macmillan Cancer Support (which successfully campaigned for the abolition of prescription charges for cancer patients in 2008) and other NHS partners. The NCSI set out to build a better evidence base and develop new models of care to improve the health and wellbeing of cancer survivors.
The initiative produced a ‘vision’ for better survival services in early 2010. This called for a significant shift in the culture of care, with a greater focus on recovery and wellbeing after treatment. This had to be tailored to each patient, with an emphasis on enabling patients to self-manage, with more targeted follow-up, rather than automatic outpatient appointments.
The overall impression from interviewees was that supportive care had, on the whole, improved over the past 20 years:
Supportive care around patients has changed enormously over the years. We still have pockets of good and less good now, but there’s a lot more about the psychological support of the patients, a lot more around thinking of managing symptoms, managing side effects, about patients and families.
Amanda Shewbridge, Macmillan Nurse Programme Lead for Living With and Beyond Cancer for the South East London Accountable Care Network
But it is difficult to provide any evidence for this. The 2010 vision called for the development of systematic measurement, in the form of a patient-reported outcome measure (PROM) for cancer. A PROM was developed and tested in 2011 for breast, colorectal, prostate cancer and non-Hodgkin’s lymphoma. The national rollout of the PROM was a casualty of the 2012 reorganisation, when its earmarked £2m funding was reallocated in NHS England after 2013.
Work on a quality-of-life measure has now restarted and is being piloted in five areas, with rollout scheduled for 2019. The metric may help assess the impact of the key interventions recommended by the NCSI. These include a recovery package (consisting of a holistic needs assessment, treatment summaries to be shared with GPs, a review with either a GP or practice nurse, and access to health and wellbeing support). The current 2015 strategy wants the recovery package to be available to all by 2020.
Despite the obvious importance to patients, many felt it was difficult to make the case for additional funding for these services in a constrained environment, and that it had slipped down the priority list for policymakers.
The NHS clearly is resource-stretched, or resource-poor. I think the supportive care was seen as a bit of a soft option. There are key bits. You’ve got to answer question one, which is: will I survive? They’ve got to have their operation in time, their diagnosis in a timely manner, get their operation and treatment started in a timely way, and deliver safe radiation and chemotherapy. Undoubtedly, that’s got to be right, because, if you don’t get point one right, you can forget point three [what am I going to be like afterwards?].
Adam Glaser, Professor of Paediatric Oncology, University of Leeds
For charities such as Macmillan Cancer Support, the logic of more people surviving cancer will mean that this dimension can no longer be ignored:
I think we, in cancer, still live very strongly in cell biology, and in clinical mode. If one in two people in our lifetime are going to have cancer, and a lot of people do survive, there is a need for more investment in that area. Whilst survival is ‘king’, how people survive and get back to best quality of life is critical, both for the individual as well as the overall economy.
Fran Woodard, Executive Director of Policy and Impact, Macmillan Cancer Support
Enablers and barriers to change
This section brings together the themes across nearly 70 interviews, about what factors were thought to have been important in driving change between 2000 and 2015, and what factors might have held things up. We do not necessarily equate ‘change’ with success. As described in the previous section, there has been some good progress in cancer, and some areas which have not progressed as planned. Nevertheless, the period from 2000 was seen by many of the people we spoke to as a time when a movement for change was set in motion, guided (and sometimes driven) from the centre, which extended across organisational and professional boundaries, and enabled change at the front line.
Our analysis has benefited from a coincidental ‘rupture’ in policy, in the form of the 2012 Health and Social Care Act. The Lansley reforms did not intentionally set out to disrupt the cancer strategy (or other disease-specific strategies), but the rapid dismantling and relocation of many of its components laid bare, by their absence, aspects of the cancer reform infrastructure which appear to have been important to implementing large-scale change.
This section looks at the following important components of change in cancer services. First, we look at the NHS cancer infrastructure (the National Cancer Action Team and networks) and levers at its disposal. Next we look at the underpinning role played by data (registries, audits) and research, and then consider the impact of politicians, the charity sector and the media. Finally, we reflect on some of the many views that we heard on the impact of the 2012 reforms.
4-1 The national cancer teams and National Cancer Director
The first National Cancer Director (Professor Mike Richards) was appointed in 1999. The role was full time, and between 2000 and 2012, a small cancer team evolved into a National Cancer Action Team, and a cancer policy team, housed in the Department of Health – a combined force of some 70 people.
The National Cancer Action Team faced outwards, supporting the NHS to implement policies such as waiting time targets, reconfiguration of complex surgery, early diagnosis and living with and beyond cancer. The Department of Health cancer policy team faced inwards, and worked closely with ministers (Box 4). The National Cancer Director straddled both teams.
Box 4: The National Cancer Teams
Department of Health policy team
- Advised ministers on all aspects of cancer policy (except prevention and research)
- Secured funding for new initiatives
- Drafted cancer plans/strategies
- Prepared progress reports
- Drafted speeches for ministers and answered parliamentary questions
- Liaised with other teams in the Department of Health (eg finance, diagnostics, drugs)
- Attended meetings between external stakeholders and ministers.
- Convened a range of advisory boards
National Cancer Action Team
- Supported the NHS in implementing cancer policy (eg waiting times, reconfiguring complex surgery, living with and beyond cancer)
- Supported the networks, through the network development programme
- Coordinated the national cancer peer review programme
- Coordinated a number of training programmes (eg colorectal surgery)
- Hosted the National Cancer Intelligence Network
The national teams, through the various workstreams, including peer review and supporting the networks, generated a detailed working knowledge of what was happening to cancer services on the ground.
As a national team, looking at cancer and looking at the country, between us we had a complete handle on what was going on. You know, that soft intelligence, which was often pretty hard intelligence at the end of the day, but, we had a very clear picture, or if you didn’t it was one phone call away. If you look at it now, who has that intelligence across the country?
Teresa Moss, former Director, National Cancer Action Team
The teams were also well known to those in the NHS and the research community, who felt able to navigate through to the right people:
It was also possible at that time to identify pretty well within the Department of Health who you went to when you had a problem. At least at a national level, I pretty well understood who did what and where.
Mick Peake, Professor of Respiratory Medicine and former Cancer Services Collaborative Lung Cancer Lead
The National Cancer Action Team reported directly to the National Clinical Director and, while the Department of Health policy team also took its lead from the National Clinical Director, it reported through civil service channels. There was, perhaps unsurprisingly, a lot of value placed on the importance of the Director as a senior clinician, working full time in the department.
What you had, uniquely, was the absolute buy-in of your clinical community. They all regarded Mike as authoritative, fair, which is an important consideration, tough, determined but somebody who was fundamentally on their side. That, I think was crucial in getting dramatic changes of practice, widely accepted, remarkably quickly.
Professor Sir Alex Markham, Professor of Medicine, University of Leeds and former Chief Executive, Cancer Research UK
The national director was also seen as a powerful link between the service and the upper strata of the Department of Health:
It’s a very specific skillset, it’s somebody who can both go out into the service and do that but also act like a bit of a spider in the tangled web of the Department of Health or NHS England or wherever… whichever set of structures you’ve got at that time, but kind of work their way across and basically bring people together to problem solve.
Mike Birtwistle, former adviser to the National Cancer Programme
The relationships between these teams are reflected in Figure 31.
Figure 31: Circles of engagement
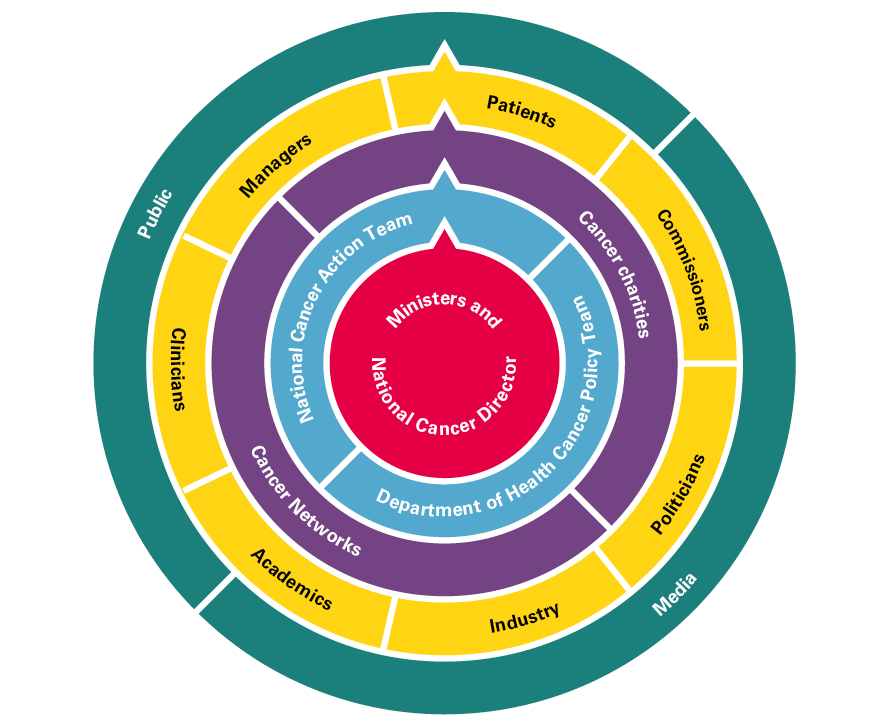
The close proximity to ministers, supported by a policy team, was perceived to have been a major asset – one interviewee described the role as:
a translational mechanism between medicine and politics.
Phil Quirke, Professor of Pathology, University of Leeds
The rupture caused by the 2012 Health and Social Care Act reorganisation has also allowed some insight into the function of this national infrastructure, if only because of the sudden absence of people and projects from the perspective of clinicians and managers now in the service.
It’s all gone. I see Cally [Palmer – National Cancer Director] and Chris [Harrison – National Clinical Director for Cancer] trying to do the right thing, but you also, and it might again be back to resource, but there was a team behind you centrally. You had different functions, and they were the go-to people. Those individuals themselves had a huge amount of intelligence, which all went [in the reforms]. I asked NHS England to send somebody to explain to us where the decision points were. Who wrote the cheques about what was going to happen or not? They spoke for an hour and, at the end, I asked that question, they said, ‘We don’t know, it varies.’ The infrastructure, who makes the decisions, and where they go and what they’re based on, seem very untransparent.
Mick Peake, Professor of Respiratory Medicine and former Cancer Services Collaborative Lung Cancer Lead
4-2 Networks
Networks were suggested first in the Calman–Hine report, ‘[networks] of proficiency and not of buildings’, to link together the smaller cancer units with the more specialised cancer centres, and act as an entity through which audit data could be collected and scrutinised, as well as an interface with clinical research trials. The Calman–Hine report did not set out a blueprint or, indeed, a map for where these networks of units and centres should be located or structured.
Shortly after the NHS Cancer Plan, 34 networks were in place, and much of the implementation of the reforms listed in the plan fell to the networks and their regional offices. The NHS Cancer Plan specified the networks’ composition: they had to include commissioners (health authorities, primary care groups and trusts), providers (primary and community care and hospitals), the voluntary sector and local authorities. The plan stated that they should serve a population of between 1 and 2 million people. The list of tasks for networks, once fully implemented, was broad (Box 5).
Box 5: Tasks and functions of the cancer networks, from the NHS Cancer Plan, 2000
- Develop service delivery plans (eg to ensure all patients had access to MDTs).
- Act as the unit of analysis for peer review.
- Ensure patients had access to good-quality information.
- Provide a vehicle for local patient and public involvement.
- Assess training needs for communication skills.
- Plan the workforce (with the relevant NHS trusts).
- Conduct audits of diagnostic facilities.
- Map cancer networks onto the national cancer research network, so each network could get maximum access to research trials.
Although there was undoubtedly variation between networks – ‘some absolutely brilliant ones and there were some dreadful ones’ (as Fran Woodard of Macmillan remembers), when they worked well networks performed a variety of functions. As Box 5 suggests, they were a key way for central directives to filter down to those delivering services. For those at the centre, for example, Julietta Patnick, then in charge of screening, the network was a crucial link to local services:
You knew where to go. If you had a question or, you know, if I had a problem in [X], I could contact the Cancer Network and they’d sort it for me. You know, I didn’t have to know them personally, but I thought, ‘Alright, who runs the cancer network down there?’ You know, and it was… you can really get things done and move the whole country in one go, and that all disappeared for me, in 2013. It just shows you the value of it. Suddenly I didn’t know who to talk to.
For clinicians and managers, the networks were not seen only as the agents of central control. There was some pragmatism within this – some of the NHS Cancer Plan’s investment was disbursed via networks, so funding hinged on collaboration – but networks also helped local staff learn from each other how to set up services, for example MDTs:
I think it got people talking and thinking care pathways, it got them into MDTs. It sorted out the worst examples of dabblers, and it made oncologists get in the same room as the surgeon and the pathologist and all the rest of them. That certainly was not happening, in any way, shape or form. It was really good in that it started to get specialist nurses introduced into every speciality.
Mick Peake, Professor of Respiratory Medicine and former Cancer Services Collaborative Lung Cancer Lead
The networks grew organically, without a tight operating model. There were mergers, and the number dropped from 34 to 28 by 2013. Initially consisting of a lead doctor, a lead nurse and a lead manager, over time, patient representatives became key components of networks, as did data managers, allied health professionals and others. The development of tumour groups, and groups for cross-cutting functions such as chemotherapy and radiotherapy, broadened the scope for clinicians to get involved:
The networks gave clinicians an easy way to getting involved in improving services because it was easy to get involved, there were enough of them that you didn’t have to be the biggest shot in colorectal cancer to get involved in colorectal cancer improvement.
Mike Birtwistle, former adviser to the National Cancer Programme
The networks were given two sources of support: the Cancer Services Collaborative and the Network Development Programme. The Cancer Services Collaborative, run by the Modernisation Agency, used quality improvement approaches drawn from the US-based Institute of Healthcare Improvement. Nine networks had already acted as pilots for the collaboratives by the time the NHS Cancer Plan was published, and the methods were to be rolled out to all networks. Much of the early work centred around reducing waiting times, which involved bringing clinicians together from different organisations – often for the first time – to look at entire patient pathways. Janet Williamson led the collaboratives from 1999 to 2014, and remembers how difficult it was for staff to understand the overall patient pathway:
There wasn’t ever one person that could articulate the pathway, but everybody thought they could, but nobody could. We had spent 3 months getting all the consultants, all the teams in a room in Leicestershire, and it had to be on neutral territory, because, you know, one wouldn’t go to another trust, and we started mapping that pathway. I remember, the lead consultant, he said, ‘I know exactly how this works. Give me the pen and I’ll write it. I remember an admin member of staff putting their hand up and saying, ‘No, that isn’t correct. It doesn’t happen like that.’ He promptly sat himself down and this admin assistant, who was really never allowed to contradict the consultant, stood up and was helped to put in what the pathway actually looked like, from her perspective.
Improvement work of this kind, via the networks, needed to be sensitively managed, as consultants often bridled at the suggestion that the part of the service they were responsible for may not have been as good as they thought, when seen from the patient’s perspective:
For the consultants there, they saw it as a very direct criticism that clinically, they weren’t doing a good job. If you’re a clinician who hasn’t had the opportunity to stand back and really look at your service, from your perspective the bit you manage and look after is pretty damn good. It’s the connections and the interface with the other bits of the pathway that let it all down, and it’s the fact that you never, actually, stand in the shoes of the patient and see the whole journey.
Janet Williamson, former Director, Cancer Services Collaborative
The National Cancer Action Team also ran a Cancer Network Development Programme. This included funding for networks to send about 10 people from each network to meet three or four times a year, to exchange learning. This was never mandatory but was well attended by lead clinicians, nurses and managers, data leads and patient representatives. About 300 people attended each time. Development meetings were nearly always attended by the National Cancer Director, and allowed for a two-way exchange of information and opinion. The National Cancer Director was at times on the receiving end of ‘sometimes quite vitriolic feedback’, but the meetings also provided an opportunity to keep the pressure on local networks to keep improving:
The Network Development Programme for cancer was one of the key drivers for change. As the National Cancer Director, you did it subtly, but you did name and shame, and you did highlight the poor-performing cancer networks, particularly around early diagnosis. You cajoled people into action by reminding them of the standard and comparing them with others. It was very powerful.
Juliet Bouverie, Chief Executive, Stroke Association
We always aimed to have a balance between top down, bottom up in the programme. In other words showcasing innovative local projects, as well as, for example, having key clinical leaders of the latest IOG to brief network teams. I think network leads always wanted to deliver; the exchange of information and hearing what others were doing spurred them on. Network posts were lonely posts, outside mainstream organisational structures. The NDP [Network Development Programme] played an important role in nurturing and sustaining those individuals, who were very dependent on the ability and support they got from their lead CEO. These were complex cross organisational posts, held by individuals who already had very busy roles.
Teresa Moss, former Director, National Cancer Action Team
All those interviewed acknowledged that the cancer networks were variable in their quality. Additionally, some believe that the collaborative approach would not, on its own, have been enough to deliver consistent performance on waiting times, which as section 3.3 described, needed a more rigorous approach driven from the Department of Health. It is, however, likely that the networks, assisted by the Cancer Collaboratives and Development Programme, prepared the ground – particularly among local clinicians – for a centrally directed improvement effort on waiting times to work.
In the wake of the 2012 Act, the cancer networks were reviewed. Kathy McLean, who was in charge of the process, remembers that it was part of a broader shift away from disease-specific approaches, and also informed by the emerging funding pressures:
The financial resource was going to be cut considerably and there was a view that it shouldn’t just be for one or two areas that had been picked out, like cancer and stroke. It should be more broad. Going through that process was quite painful in some ways, because everybody wanted a network. We moved to a smaller number of strategic networks but their individual resourcing went down. They did still have some core resource, but it was expected to support a whole series of different areas like maternity and so on.
Kathy McLean, Executive Medical Director and Chief Operating Officer, NHS Improvement
After a fallow period, the cancer network concept has now been revived in the form of 19 cancer alliances, suggested in the 2015 cancer strategy. The current National Cancer Director, Cally Palmer, believes the alliances will build on the best of what the networks achieved:
What we are trying to do now is create Cancer Alliances as accountable cancer networks, building on the original networks from Calman–Hine, but ensuring they are fit for purpose for the modern NHS. They need focus and investment to really start to make a difference for the whole population.
Although most people welcomed the return of a form of network, they felt there was a great deal of ground to make up:
We’re now in a position where we’ve moved on from strategic clinical networks, and we’re in a period of alliances, but if you have a strong, regional, local network, through which you can direct communications… I mean, the number of conversations I’ve had, simply about people on the ground not knowing there’s a new cancer strategy at times. It requires a really concerted approach from the centre to work with regional and local partners to raise the profile, get good clinicians involved, create a local and regional momentum, ideally work to some kind of framework, share best practice.
Sarah Woolnough, Executive Director of Policy and Information, Cancer Research UK
Those with experience that spans both the networks and alliances see different approaches being used, particularly as the alliances are now focused on regaining the 62-day target, and delivering the ‘recovery package’ for patients living with and beyond cancer. Julie Lees was Deputy Director of the North Central London Cancer Network and is now Deputy Director of the Transforming Cancer Services Team in London:
We are nowhere near where we were before, but there are some good things too about the alliances. The new programme management approach brings a lot more rigour.
4-3 Service guidance and peer review
As described earlier (section 1.1), detailed guidance on individual cancers had been produced since the Calman–Hine report, and the National Cancer Action Team led a peer review programme to ensure its adoption across cancer services. The Improving Outcomes Guidance programme was led by Professor Bob Haward. The approach was novel, attempting to combine consensus among experts (including patients) and independent scrutiny of the available evidence. The programme defined the structure and processes of care most likely to result in good outcomes, to complement clinical guidelines, which clinical teams should use to determine optimal treatment for individual patients. NICE took over the guidance production after 2002, but peer review stayed with the National Cancer Action Team.
Early initiatives on peer review or accreditation of cancer services started between the publication of the Calman–Hine report and the NHS Cancer Plan. These were regionally led and used somewhat different approaches. The Trent, Northern and Yorkshire and West Midlands regions set the pace. Following the publication of the NHS Cancer Plan, the need for a single national programme became apparent. This was based most closely on that developed in Trent.
The first national peer review programmes got underway in 2001, bringing clinical experts and patients working in other parts of the country to look at local services, with the help of dedicated peer review staff. Ruth Bridgeman, who eventually led the National Cancer Peer Review Team, reflected that the power of the peer review process was heightened by the drive to specialisation, and meant that local services would have to be reconfigured if they were not good enough:
Discussion of configuration, focuses minds, if I dare say, threatens people’s position. As a result of that, it triggers personal survival instincts, if you like, to either demonstrate they conform with, or prove their non-conformation is still delivering high quality.
Ruth Bridgeman, former National Programme Director, National Cancer Peer Review Programme
Peer review also meant that participating teams needed to become very familiar with the guidance:
I think the greatest benefit of peer review, right at the very beginning was that actually it got clinicians to read and to learn what was expected of them from the IOGs, which they probably wouldn’t have made time to do if they hadn’t been going to be a reviewer or [be] reviewed. To really, then, reflect on local practice, think about how they could put new guidance into place, and get some systems to support it. I cannot see anything else that would have motivated them to do that reflection on: ‘What am I supposed to do?’ ‘What is the team supposed to do?’ ‘How do we put it into place before the visit?’
Teresa Moss, former Director, National Cancer Action Team
Involving clinicians and patients gave the programme credibility, as well as its evidence-based foundation. Although it had no legal teeth, a handful of services were closed down after peer review.
If it had had teeth, it might not have worked so well; it was honesty of the process that delivered the early improvements.
Ruth Bridgeman, former National Programme Director, National Cancer Peer Review Programme
In retrospect, those who worked on the peer review programme acknowledge that it had too many measures (between 30 and 40 for each cancer type), and did not have a focus on productivity. That said, the results were put into the public domain, and showed improvements between the first and second round.
It gave many clinicians the opportunity to see other services than their own first hand. They could see variation for themselves and benchmark their own service against that. Since trust status had been introduced in the early 1990s trusts had become competitive and much more insular. So peer review gave a unique opportunity to connect with neighbouring services.
Teresa Moss, former Director, National Cancer Action Team
In an era when case mix adjusted outcomes were not available, the presence of a programme focusing on structures and processes was particularly important. From the perspective of the national team, the process of peer review provided them with a unique level of detail about cancer services locally.
When we started in peer review, that first national round, nobody knew where the cancer services were. Nobody knew where the teams were. So, there was a time when I was the only person who knew where every cancer team in the country was. The number of people who came to us and asked us for that information – Royal Colleges, nurses, clinicians – everybody came to us to know where the cancer services were. Now, that absolutely astounded me, that the country, forget who, that the country couldn’t put its hands on where its individual services were, and that is still the case for most of our clinical services in this country.
Ruth Bridgeman, former National Programme Director, National Cancer Peer Review Programme
Peer review in cancer ran until 2015. After the 2012 Health and Social Care Act’s reorganisation, the team worked to peer review the specialised services commissioned directly by NHS England. It was the responsibility of the Care Quality Commission to inspect and regulate provider services from 2013. Although an inspection of a hospital might include a focus on oncology departments, there have to date been no single disease area inspections similar to peer review, which some feel is an omission:
If cancer is a public priority, it seems odd that you would have cancer services not being regulated front and centre. I guess the equivalent would be if literacy is a public priority, it would be strange if Ofsted went in and didn’t look at literacy. Peer review I think was tremendously powerful, which was soft regulation in a way. No legal teeth, it was very hand to mouth but I think that was a powerful driver.
Mike Birtwistle, former adviser to the National Cancer Programme
4-4 Data and intelligence
Major advances in data collection have been made over the past 20 years, which have undoubtedly helped to drive implementation of the cancer programme. England now has more comprehensive information on cancer than many other countries do (Table 6).
These advances were driven centrally in the early years of the programme, through the Department of Health Cancer Policy Team and the National Cancer Action Team. The appointment of a coordinator for cancer registration was a first step in improving the quality of the cancer registries – collections of data containing details of each case of cancer. Cancer registration had existed since 1947, and data were collected by autonomous regional registries. Common data requirements had existed since the early 1990s, but data completion varied considerably, for example some registries having significant proportions of ‘death certificate only’ entries, with little or no accompanying clinical information.
Table 6: Cancer intelligence sources and availability, England, 2018
|
Data |
Source |
Data collection period |
|
Incidence |
Office for National Statistics (ONS) |
1979 onwards |
|
Survival |
National Cancer Registration and Analysis Service (NCRAS), ONS |
1996 onwards |
|
Mortality |
ONS |
1979 onwards |
|
Screening |
National Cancer Screening Programmes (NHS Digital) |
Breast >20 years* |
|
Cervical >20 years* |
||
|
Bowel – 2010s onwards* |
||
|
Attendances in primary care before diagnosis of cancer |
National Cancer Patient Experience Survey |
2000, 2004, 2010 onwards |
|
Waiting times |
NHS Digital |
2003–2007, 2009 onwards |
|
CT scans |
Diagnostic Imaging Dataset (NHS Digital) |
2012/13 onwards |
|
MRI scans |
Diagnostic Imaging Dataset (NHS Digital) |
2012/13 onwards |
|
Endoscopies |
Monthly Diagnostic Waiting Times and Activity (NHS England) |
2008/09 onwards |
|
Number of MDTs |
Cancer peer review/NCRAS |
2001–2010, 2013 onwards |
|
Patients discussed by MDTs |
NCRAS |
2013 onwards |
|
Surgical procedures and lengths of stay |
Hospital Episode Statistics |
>20 years* |
|
Radiotherapy |
Radiotherapy Data Set (NCRAS) |
1999 onwards |
|
Systemic therapies |
Systemic anti-cancer therapy dataset (NCRAS) |
2014 onwards |
|
Stage at diagnosis |
NCRAS |
2012 onwards |
|
Routes to diagnosis |
NCIN/NCRAS |
2006 onwards |
|
Cancer workforce |
Department of Health/Health Education England |
1999 onwards |
*Full dataset not currently publicly available
Work to improve the cancer registries took place alongside a team working on analysis from Hospital Episode Statistics (HES) led by the late Brian Cottier. Chris Carrigan, who was the Coordinator for Cancer Registration in the National Cancer Action Team, remembers the early meetings between the registries and those using HES:
There was a massive clash of cultures between the traditional cancer registry epidemiologist whose focus was to work on data checking, quality and finesse which, after many years would produce a statistic, versus Brian whose ethos was literally smash data together and see what it shows you. So, they were on two ends of the spectrum, and part of the trick was to try and bring them closer together to recognise that there were merits of both of those things.
Chris Carrigan, former Head of the NCIN
This work – which was eventually to lead to data linkage across HES and registries – was given more heft following the Cancer Reform Strategy in 2007. An NCIN was established, with a director and steering group chaired by the National Cancer Director with input from a wide range of interested parties, including major cancer charities and patient representatives. The NCIN had five objectives:
- standardising the way cancer data were recorded in the NHS
- ensuring that data could be pulled together in the same place, and flow into a central point
- creating outputs with the data, including comparative analyses
- increasing the use of data from clinical audits
- making the data available to researchers and cancer networks.
The NHS in England now has one of the most complete cancer registries. ‘Death certificate only’ rates are now very low (less than 0.2% nationally). Some of these cases may relate to patients who were never referred to hospital, but for whom a GP diagnosed cancer. With regard to timeliness, registration for patients diagnosed in 2016 was considered complete by the end of 2017 – a massive improvement from the year 2000.
I think what’s been extraordinary and has to be one of the major, major successes of all of this era is the improvements in cancer registry data over that time period. What we didn’t have then, in term of completeness, timeliness, understanding of it, attention to it and we were definitely on the lower rungs comparatively, we’re now up there. We’re now the shining example, it seems.
Sara Hiom, Director of Early Diagnosis and Cancer Intelligence, Cancer Research UK
In 2013, responsibility for cancer registration and the NCIN transferred to Public Health England, who set up the National Cancer Registration and Analysis Service (NCRAS). One of the first actions taken by NCRAS was to establish a single national cancer registry, while retaining eight regional offices. Since 2013, the richness of information on individual patients has also improved, with information on different treatments (eg radiotherapy and chemotherapy) from bespoke datasets being linked to cancer registration.
One of the pieces of the jigsaw that has been missing until recently has been information on stage at diagnosis. This is in part because it is incompletely recorded in hospital records by clinicians. However, this has now been overcome, by applying algorithms to the data on which staging is based (eg clinical, pathological and radiological extent of disease) to derive a ‘registry’ stage that is uniform across the country. Reliable information on stage at diagnosis for the vast majority of cancer types and patients has only been available since 2015, but this now provides a new measure for evaluating progress on earlier diagnosis.
We are not making diagnosis early enough, and this is confirmed by our staging data that tells a very stark story of the lost opportunity to intervene early for quite large numbers of people in this country. So, we’re thinking, ‘What could we do to address this through concerted action between NHS England and Public Health England?’ Prioritising early detection and treatment must continue, but we also need to get better at predicting and preventing cancers through enhanced behavioural change programmes focused on the major risk factors of tobacco, alcohol and obesity targeted on those most at risk.
Duncan Selbie, Chief Executive, Public Health England
The data on chemotherapy usage at national level have also only recently become available. This was previously hampered by the failure of the NHS to introduce electronic prescribing systems for chemotherapy, which were originally promised as part of the National Programme for IT by December 2006. This has now at last been rectified. In addition, multiple different acronyms were being used for essentially the same chemotherapy regimens. These have now been rationalised, allowing meaningful comparisons to be made across the country. Unfortunately, other countries do not collect comparable data to facilitate comparisons.
One of the other major steps forward has been linkage of datasets. The Routes to Diagnosis programme is probably the best example of new information that has emerged from linking datasets and which is now being used to drive change. Routes to Diagnosis combines data from cancer registration, HES, the waiting time dataset and the screening dataset. The finding that caused most surprise when this was first published was that around 24% of all cancer patients were diagnosed as emergencies in 2006. This figure focused attention on early diagnosis, and analyses have subsequently been repeated annually. In 2015, 20% of cancers were diagnosed as emergency presentations, with reductions in these predominantly late diagnoses being observed across all tumour groups.
Alongside monitoring of outcomes at national level, it is important to provide information at local level (eg at network/alliance level and by trust, CCG and general practice), so that those responsible can compare their processes and outcomes against other comparable organisations. The National Cancer Action Team and NCIN produced practice, PCT and cancer network profiles. These undoubtedly focused the attention of clinicians and managers at local level.
One of the things that was tremendous was the development of NCIN, because that gave us the data to see the variation. Of course, with the demise of NCIN, I know it’s now in NCRAS, but it’s still not got the same edge that it had. So, all the groups that were looking at data, I know a lot of the NCIN groups didn’t work well but the colorectal one did.
Deborah Alsina, Chief Executive, Bowel Cancer UK
The ability to feed back data to an even more local level – to clinical teams – is also essential, but still not happening systematically at national level. Professor Eva Morris is a leading epidemiologist in the field of bowel cancer, and has seen how data can unlock improvement if managed correctly:
So much of what we’ve done has always been, ‘Look, there’s this variation’. Then they [clinicians] say, ‘You’re having a go at us.’ We’re like, ‘We’re not, actually.’ There could be good reasons for that variation, but what are they? If people start looking at the data proactively and, you know, not as a threat, then you can make big changes, and people are really keen.
Eva Morris, Professor of Cancer Epidemiology, University of Leeds
A very common thread running through the interviews from senior researchers and analysts was the challenges in getting access to cancer data, either for research or improvement purposes, caused by a combination of the post-2012 reorganisation, and a more general tightening of information governance standards since the failure of the NHS ‘care.data’ programme:
There has been a fundamental shift, misplaced in my view, in the difficulty of obtaining research access to data, rather than emphasising the benefit of using those data to generate information and intelligence for cancer control. The difficulty for researchers in accessing data for ethically approved, legally justified research is probably greater now than it has ever been. There has been a steep increase in these difficulties, even when we have the requisite approvals from the statutory Health Research Authority and NHS Research Ethics Committees. We face repeated rejection of our applications – in some cases for more than 2 years – because some new issue or problem has been identified in our applications for a contract for data from the Office for Data Release at Public Health England (sometimes referred to as the Office for Data Non-Release). These contracts used to be a couple of pages long just a few years ago. Today they run to 20 or 25 pages, even though the research designs and the data requested are similar. Whatever we do, however we complete these application forms, it is never enough. The Department of Health and Social Care agrees that this is not a question of law, neither the new General Data Protection Regulation from the European Union nor the UK Data Protection Act 2018. It is a question of policy. Government must act to rationalise the policy on access to data for public health research.
Michel Coleman, Professor of Epidemiology and Vital Statistics, London School of Hygiene & Tropical Medicine
Audits
There are now six cancer audits that provide more detailed information about cancer treatment in individual cancers (Table 7).
Table 7: Cancer audits
|
Name |
Year first reported |
|
National Lung Cancer Audit |
2005 |
|
National Head and Neck Cancer Audit |
2006 |
|
National Bowel Cancer Audit |
2006 |
|
National Oesophago-Gastric Cancer Audit |
2008 |
|
National Prostate Cancer Audit |
2014 |
|
National Audit of Breast Cancer in Older Patients |
2016 |
Audits are able to provide information at institutional level, and have proved to be a powerful lever to change behaviour. The level of detail in the data, and the fact that data are often supplied by clinicians, has enabled clinical audits to gain trust in the clinical community. A prominent example is the Lung Cancer Audit, led by Mick Peake:
The work on developing a National Lung Cancer Audit really illustrated to the cancer registry world that we needed more than 5-year survival 10 years after the event. We need data on stage, performance status and treatment. We recorded whether a patient had been discussed at an MDT meeting, which had never been looked at before. So, we produced a relatively limited dataset, which was not as comprehensive as it could have been, but it was deliberately meant to be a practically implementable dataset.
Another example is the Bowel Cancer Audit, which was able to chart how effectively new surgical techniques were being adopted across trusts.
If it hasn’t driven change, it has recorded change. So, I mean, the big changes, I think, are the uptake of laparoscopic surgery. Going from, in its infancy really, with a few enthusiasts, to laparoscopic resections in over 50% of cases.
Paul Finan, Professor of Colorectal Surgery, University of Leeds
The challenge with some audits has been that they only happen once, then are no longer funded and don’t get repeated. In breast cancer, an audit of mastectomy was run in 2011 but not repeated. There was a further one, the Breast Cancer Clinical Outcomes Measure Project, which ran for 3 years. The current audit, the National Audit of Breast Cancer in Older Patients, run out of the Healthcare Quality Improvement Partnership, is a 3-year project started in 2016. Although the findings of all these audits have been useful, Fiona MacNeill believes more can be done:
The breast audits are a massive amount of work but have improved and standardised best practice across the UK. They mainly focus on process and activity but we need to look more at outcomes as this is what matters to patients. Data collection is expensive so we must use established mechanisms such as HES, which reflects what happens in surgery reasonably well. Results can be provided every quarter (or whatever) to the teams delivering the care so any change in practice, technique or use of a new device can be measured quickly to ensure patients are not harmed.
Fiona MacNeill, Consultant Breast Surgeon, Royal Marsden NHS Foundation Trust
Significant gaps in clinical audit coverage are also clear – most cancer types aren’t currently covered by any audit and, even where audits exist, none consistently include PROMs.
4-5 Research
The two major developments in research over the past two decades have been the expansion of clinical research (trials of new therapies and techniques) and the expansion of health services research (to better understand patterns of access and interventions).
Clinical research
Before 2000, there were already active programmes of cancer research across the UK, funded by both government and the voluntary sector. Efforts to coordinate these research projects and funding streams began in 1999, with the creation of a Cancer Research Funders Forum, and in 2000, the NHS Plan announced the creation of a National Cancer Research Network (NCRN) – as a ‘model for enhancing recruitment into and management of trials of treatments’. The cancer research network was to have an ‘extra’ £5m a year by 2001/02. Figure 32 shows the initial increase in number of patients with a cancer diagnosis recruited into clinical trials in England between 2000/01 and 2005/06. Further peaks of recruitment can be seen in 2011/12 and 2017/18.
Figure 32: Recruitment of patients with a cancer diagnosis into clinical studies in England, split by interventional and observational study types
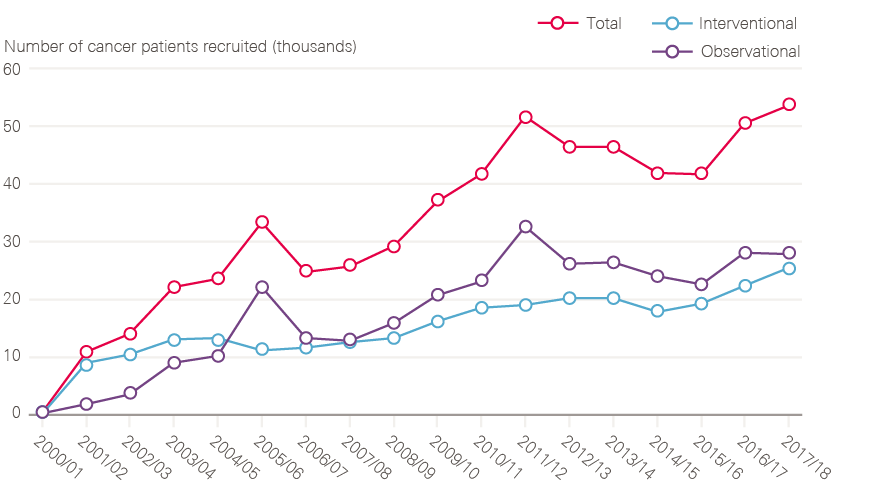
Source: Data provided by NIHR Clinical Research Network (CRN), October 2018.
The NHS Cancer Plan put more flesh on these ideas: the NCRN would map onto the existing cancer networks, and provide research nurses, data analysts, information systems and medical staff sessions to support research over a larger range of organisations than had been possible before. To have strategic oversight of cancer research as a whole, the NHS Cancer Plan set up the National Cancer Research Institute: rather than a bricks-and-mortar institute, this was instead a partnership of all the funding bodies, and its role was to keep track of cancer research as well as flag (and remedy) gaps in the evidence base.
The expansion of research was seen as very successful from the perspective of the clinical research community, getting research into smaller hospitals, and engaging teams who might not otherwise have been connected into research:
The NCRN idea was a very powerful one and it gave clinicians in networks some reward for their participation in network business in kind of a way. Every clinical career needs something that reaches the parts that the day job doesn’t reach. That could be education, research, private practice, you know, it could be medical politics. There are lots of things it could be, but one of them was research. The NCRN and the other research networks did actually press that button quite well. Clinicians in ordinary DGHs [district general hospitals] were empowered to do it.
Bob Haward, Professor of Cancer Studies, University of Leeds
The result was a rapid expansion of patients enrolled into clinical trials from the early 2000s. Professor Peter Selby believes this has had a measurable impact on patient outcomes, for example in colorectal cancer:
The provision of research infrastructure in the NHS quadrupled patient participation in clinical research over 5 years. Most importantly, we have followed through and we’ve looked to see whether that original idea is substantiated, to see if increased participation would improve health outcomes. The best clinical epidemiology studies in 209,000 patients suggest that it does, and that it’s causal.
Evidence is now emerging to quantify the effect of research participation on cancer survival, for example in colorectal cancer. As well as benefitting patients by giving them access to new therapies, the expansion of clinical trials was also seen as having brought improved quality of care in their wake:
The quality standards that get applied in trials then get applied into general practice into non-trial settings. So, it’s a massive lever for quality improvement. Eventually, it even gets into small places that don’t do trials. That’s why networks are quite important, I mean, in the sense of transferring what was going on in the bigger sense and to DGHs.
Adrian Crellin, Consultant Clinical Oncologist, Leeds
The funding role has been maintained, partly through the NIHR, which has been able to retain its own budget.
Health services research
The Department of Health (first through the NHS Research and Development Programme and subsequently through the NIHR), and Cancer Research UK also funded important health services research, particularly in relation to public awareness of cancer, the impact of cancer screening, primary care and cancer, and early diagnosis. Key outputs from this research include: better understanding of the public’s knowledge and beliefs about cancer; symptoms experienced by cancer patients who present to GPs and how they differ from age-matched controls; and the impact of different approaches to improve the uptake of screening.
Until the early 2000s very little health services research had been done on primary care and cancer:
We did a lot to really encourage the primary care academic community and the role of primary care in cancer control in a way that previous cancer plans had not addressed at all, it was all very acute-based.
Sara Hiom, Director of Early Diagnosis and Cancer Intelligence, Cancer Research UK
Primary care research on cancer is now an active field of research with high-quality researchers. This research has, for example, led to the development of evidence-based guidelines on which patients should be investigated or referred to hospital with possible cancer (NICE guideline 12), based on the research led by Professor Willie Hamilton which uncovered the difference between cancer symptoms in primary and secondary care:
It was £220,000 well spent I think. It really did show, beyond all reasonable doubt, that there was a difference between the symptom patterns in primary care and the symptom patterns in secondary care. Cancer has got into the GP mind-set much, much more in the last 20 years. I’m not saying it wasn’t there, but when I first stumbled into the [research] field in the year 2000 for instance, I didn’t know that we had crap cancer figures compared with the rest of the world.
Willie Hamilton, Professor of Primary Care Diagnostics, University of Exeter
4-6 Workforce and the professional bodies
The cancer workforce is one of the most complex in health care. Patients need input from a wide range of professionals:
- GPs
- diagnosticians (radiologists, radiographers, endoscopists, pathologists and biomedical scientists)
- surgeons, who specialise in different organ systems or parts of the body
- nurses, including CNS, chemotherapy nurses, cancer ward staff and nurse practitioners
- physicians (haematologists and dermatologists)
- oncologists (clinical and medical)
- therapy radiographers and physicists
- pharmacists
- palliative care nurses and doctors
- allied health professionals (eg physiotherapists).
A few of these professionals work on cancer exclusively (medical and clinical oncologists, haemato-oncologists and specialist cancer nurses), but most work across a spectrum of conditions. This complexity makes planning inherently difficult, further complicated by the roles played by professional groups, such as Royal Colleges and specialist societies, who tend to make the case for an increase in their respective workforce, without necessarily considering the impact on the wider system.
At the time of the NHS Cancer Plan, the need for additional staff for cancer was already recognised, and was one of the four priorities announced in October 1999 on the appointment of the new National Cancer Director. In 2000, the NHS Cancer Plan promised an ‘extra 1,000 cancer specialists’ by 2006. This was met ahead of target according to the NAO, with 974 extra consultants in post by 2004. There has been growth in all the specialties since, in excess of the growth in cancer incidence of 30% over the same period (Table 8).
Table 8: Numbers of consultants working in clinical specialties, 1999–2016
|
Clinical specialty |
1999 – full-time equivalent (FTE) consultant numbers (from NHS Cancer plan) |
2016 – FTE consultant numbers (figures from HEE Cancer Workforce Plan) |
Percentage change |
|
Clinical radiology |
1,507 |
2,805 |
+86% |
|
Histopathology |
836 |
1,164 |
+39% |
|
Gastroenterology |
no data |
1,065 |
|
|
Clinical oncology |
305 |
686 |
+125% |
|
Medical oncology |
110 |
358 |
+225% |
|
Haematology |
510 |
759 (NHS Health Careers) |
+49% |
|
Palliative care physicians |
94 |
no data |
|
|
Therapeutic radiographers |
1,453 (Cancer Reform Strategy)* |
2,563 (Census of the Radiotherapy Radiographic Workforce in the UK, 2016) |
+76% |
|
Diagnostic radiographers |
11,036 (Cancer Reform Strategy)* |
13,626 |
+23% |
Note: The NHS Cancer Plan and the Health Education England (HEE) Cancer workforce plan do not use the same definitions of ‘core’ cancer workforce. The NHS Cancer Plan doesn’t include gastroenterologists, while the HEE plan does but excludes haematology and palliative care.
* Data from 2000.
Some of the targets set in the NHS Cancer Plan exceeded the speed at which workforce capacity could be grown, so new approaches to using staff were needed. Expanding the breast screening programme from five to seven rounds in a woman’s lifetime (combined with two-view mammography) by 2004 involved a 40% increase in workload. There was no realistic prospect of increasing breast radiologist numbers by this amount within the time frame. A collaboration between the National Cancer Director, the screening programme, the Royal College of Radiologists, and the Society and College of Radiographers resulted in a new workforce model. The ‘four-tier model’ for radiographers (who are not medical graduates) consisted of: assistant practitioner, radiographer, advanced practitioner and consultant radiographer. Agreement on this new structure meant that trained radiographers could perform tasks previously done by radiologists, which would have previously been seen as unacceptable.
Expanding or changing the scope of professional roles has not been straightforward. A similar approach was needed for the rollout of flexible sigmoidoscopy bowel cancer screening. Although there have been examples of training nurses to perform procedures such as flexible sigmoidoscopy and colonoscopy to investigate possible bowel cancer, it has proved difficult to roll these out nationally. Underlying this, according to some people we interviewed, was the professional conservatism of gastroenterologists: ‘It gets in the way of their professional power’, according to one consultant.
Another complicating factor in relation to the diagnostic workforce as a whole has been the existence of private practice alongside the NHS, which can result in perverse incentives:
Skill mix is quite difficult simply because it takes you ages to train someone and then they go off into other organisations, including the private sector. I mean, we did this two or three times when I was at Hillingdon and Mount Vernon, you know, we trained someone up, we trained two, three I think, nurse endoscopists and planning radiographers and they then went off elsewhere. Of course, in the private sector, they can earn a lot more in much less-stressful circumstances.
Professor Jane Maher, Joint Chief Medical Officer, Macmillan Cancer Support
Engaging with the professional societies and bodies was one of the functions of the National Cancer Director, the cancer policy team and National Cancer Action Team. This was important for keeping abreast of developments in their respective clinical fields, gathering intelligence about current and future recruitment trends, and negotiating the boundaries of professional competencies when new roles were needed. There were very mixed views about how the professional groups and Royal Colleges functioned, with a criticism that they had a tendency to push their professional interests centre stage, rather than frame their position in terms of what was good for patients.
The Royal Colleges have been somewhat professionally centred. They are interested in good professional training and experience. In the Association of Cancer Physicians, we wrote a strategy about how you make outcomes for cancer patients better. ‘What is it that medical oncologists can do to make that happen?’ rather than, ‘How do we want to develop medical oncology?’ These are different perspectives for a strategy and, though I don’t think it has worked 100%, we will persevere.
Peter Selby, Professor of Cancer Medicine, University of Leeds
Some of those interviewed believe that there has been a change over the past few years, as Royal Colleges have understood the need to reframe the way they present their positions – for example the Royal College of Radiologists – as part of the National Radiotherapy Advisory Group, from 2006:
It was just whining before. So, starting to actually make structured whining into something that was talking politics and justifiable business cases, quantifying, playing a very much more intelligent and, I suppose, political NHS management thing. Whingeing and shroud waving, which is what it had always been before was actually useless, frankly, which is why it got ignored.
Adrian Crellin, Consultant Clinical Oncologist, Leeds
The role of the professional bodies is only one component of workforce planning, which has always been challenging across the NHS, not just cancer. Despite the increases in staff initiated from 2000, workforce shortages have once again become a serious problem in cancer services. This is explained by rising demand and rising complexity in screening, diagnostic and treatment technology, making it harder to predict the correct rate of workforce growth to meet that demand. But some of the gaps, for example in endoscopy, have been in evidence for some time:
We’ve never been successful, and we continue not to be successful, in planning the workforce, and more generally our capacity to deliver change. We have a perpetual under-supply in key areas. Goodness knows how many times I have talked about endoscopy over the years. A problem we’ve known about for years and years and we still haven’t fixed it. We’re a long way from having it sorted, and patients’ lives are being impacted as a result.
Sir Harpal Kumar, former Chief Executive, Cancer Research UK
The current financial pressures on acute trusts have also contributed to the workforce problems, as trusts lack resources to fund the posts for new positions, or plan ahead.
There’s a culture of ‘make do and mend’, being too busy for strategic thinking at an acute trust level and you only build a business case when the thing in front of you is broken. So, no forward thinking.
Professor Erika Denton, Consultant Radiologist, Norfolk and Norwich University Hospitals, and National Clinical Director for Diagnostics, NHS England
The acute financial pressure on the NHS has exacerbated workforce shortages across the NHS. The first phase of a cancer-specific workforce strategy has now been produced by Health Education England and the NHS England cancer team, which aims to ensure that there are enough staff to deliver the current cancer strategy until 2021. Fixing the workforce problem has not been helped by the complexity of workforce planning, which has been split across different bodies following the 2012 Act, according to the National Cancer Director, Cally Palmer:
On workforce, I think we need more coordination and less fragmentation in delivering workforce transformation. There is an incredible success story in cancer delivery in the NHS but we must do more on the future cancer workforce. Part of the problem is a long timeline in training and developing people and we need to be more fleet of foot.
4-7 Funding
Viewed from the perspective of other clinical disease areas, the steady improvement in cancer services since 2000 might be simply explained: cancer is perceived to have been generously funded, with above-average increases compared with other diseases.
From 1997, relatively small pots of funding were made available for local cancer services to implement the reforms recommended in the Improving Outcomes Guidance (IOG) documents. Each IOG was allocated £10m per annum, and was distributed via the 34 cancer networks (ie approximately £300,000 per network). Using the networks to disburse the funding acted as an incentive for trusts to collaborate with each other and the nascent networks, as funds were released in return for credible proposals on how the money was to be used, for example on new medical posts that might be shared across trusts. Some of the more advanced networks were able to use their share of the £10m to leverage other funding during those years. Mark Baker was Director of the Cancer Network in Yorkshire at the time:
It was used quite intelligently, to draw in matching funds, or more often through charities and local commissioners. So, our third of a million became a million. Of course, we weren’t counting much, in those days. So, no one really knew what it cost to treat cancer, and no one had much idea of what was done to people with cancer, and when we got our fifth linac, it came with a revenue tail of £800,000 or whatever it was, and nobody quite knew what was going to be done with it. So, these were pretty archaic days in terms of cancer treatment.
Andy McMeeking was a manager in Sussex in the late 1990s, and remembers the process of providers coming together to use the money, for example to boost CNS, or fund a specialist surgeon to work across two sites.
There was a period of time we were told you had this money, and then a reasonable period of time when you decided how you were going to bid for it, and I think everyone got a slice of it. You didn’t have to bid against people, it was, there is some money, you know, this is what you should be thinking about. So, the expectation of delivering the new set of standards seemed a bit more achievable because there was something there to help you do it.
The main injection of funding arrived with the NHS Cancer Plan. A commitment was made to provide an additional £570m by 2003/04, against a backdrop of increased funding for the NHS as a whole. Most of this funding was allocated for capital equipment (CT scanners, MRI scanners and linacs), expansion of the consultant workforce and new drugs that were anticipated to be funded by NICE.
The Department of Health conducted a series of audits of cancer networks to understand progress in spending this money. Although progress was initially slow, the NAO concluded that more than £400m had been spent by 2004 on 68 MRI scanners, 177 CT scanners, 83 linacs and more than 700 items of breast screening equipment since April 2000. There were an additional 975 consultants in post by 2004, according to the NAO.
After 2003, no large-scale central funding specifically for cancer was made available again until the commitments following the 2015 cancer strategy (with the exception of the Cancer Drugs Fund). Indeed, the Cancer Reform Strategy (2007) made it clear that funding should come from PCT baseline budgets. This meant that cancer had to compete with other priorities. Since 2015, as well as £200m of funding for cancer services, capital funding of £130m has been allocated to renewing radiotherapy machines by 2018, of which £46m had been spent on 26 new machines by the end of the 2017/18 financial year.
For most of the period under analysis, cancer funding was channelled through PCTs. After 2001, it became mandatory for PCTs to fund drugs approved by NICE. Since 2013, chemotherapy and radiotherapy have been paid for centrally, as part of specialised commissioning by NHS England. Spending on chemotherapy represents the largest proportion of this spending, which has grown rapidly, by 50% in 3 years.
Table 9: Growth in specialised services expenditure, cancer
|
2013/14 |
2014/15 |
2015/16 |
2016/17 |
|
£2.2bn |
£2.8bn |
£3.1bn |
£3.3bn |
Source: Hansard, 14 June 2018. Cancer: Medical Treatments and Research: Written question – 151135. Available at: www.parliament.uk/business/publications/written-questions-answers-statements/written-question/Commons/2018-06-07/151135/ (accessed on 20 November 2018).
Other relatively small amounts of central funding were allocated over time for specific programmes. These include:
- initial rollout of cancer screening programmes, and expansion of existing programmes
- funding for public awareness programmes on cancer
- training programmes for new approaches to the treatment of colorectal and breast cancer surgery, which involved MDTs
- an advanced communication skills training programme, through which several thousand senior cancer clinicians received training
- the Cancer Network Development Programme
- the National Cancer Peer Review Programme
- additional funding for cancer registration and dataset development.
Central funding was able, in some instances, to accelerate the adoption of new techniques, by identifying clinicians (and specialist bodies) who were ready to train their peers and other team members. An example is sentinel node surgery in breast cancer, according to Fiona MacNeill:
Sentinel node was very slow to be taken up in the UK, and Bob Mansel was the visionary and driver. At the time I was the breast surgery tutor at the Royal College of Surgeons (England), so we linked, and we established a national training programme for all breast surgeons that rolled out over a period of 2 years. I think [the Department of Health] provided about £250,000. When you think what was achieved for such a small amount of money, I am very proud to have been part of the team that transformed practice and improved the lives of thousands of women.
Fiona MacNeill, Consultant Breast Surgeon, Royal Marsden NHS Foundation Trust
The national cancer teams also saw increases in funding, although it has proved difficult to trace the amounts in the official accounts. One of the senior officials from the time remembers the broad amounts rising considerably over the decade (although they were still small compared with spending on services and drugs):
The NCAT [National Cancer Action Team] budget including the NCIN went up to approximately £30m in the 3 years after the 2007 strategy. Previously it was at £7m, having been £3m when I started in 2002. The sums always included the network allocations. With that money we were able to fund many programmes that changed the landscape on cancer service delivery.
Anonymous
Understanding whether cancer consumed an increasing proportion of the NHS budget is difficult to establish. The introduction of programme budgeting in 2003, which required the NHS to report expenditure by disease area, allowed some sense of scale in cancer spending at an aggregate level (although at a PCT level the data were unreliable). For much of the following decade, spending on cancer accounted for roughly 6% of overall NHS expenditure. Programme budgeting data are no longer available at an aggregated level, although local commissioners are still given data on the breakdown of their spending.
In reality, it is difficult to accurately estimate what has been spent on cancer services. The most recent NAO report, published in 2015, estimated that £6.7bn was spent on NHS cancer services in 2012/13 (but flagged the absence of good data on cost and efficiency in relation to cancer). The NAO estimate is significantly at variance with figures for the subsequent years, released in response to a written question in parliament in 2018, which gives spending on specialised commissioning and CCG spend, neither of which amount to the NAO’s 2012/13 estimate (Table 10).
Table 10: Combined specialised commissioning and CCG spend on cancer by year, England
|
Year |
Combined specialised services spending and aggregate CCG expenditure on cancers and tumours in £m |
|
2013/14 |
5,024,641 |
|
2014/15 |
5,337,607 |
|
2015/16 |
5,814,013 |
|
2016/17 |
5,921,224 |
Source: Hansard, 14 June 2018 Cancer: Medical Treatments and Research: Written question – 151135. Available at: www.parliament.uk/business/publications/written-questions-answers-statements/written-question/Commons/2018-06-07/151135/ (accessed on 20 November 2018).
A theme that was raised by interviewees was that, although there was more funding available between 2000 and 2010 than after 2015, it was often the smaller pots of funding – the ‘low millions’– that were able to mobilise clinicians and managers, and create a sense of a community looking to improve services, whether through peer review, training, or network development programmes (assisted by the Modernisation Agency).
I think it is having pots [of money] which are small but significant enough to make people think that change is possible, so that you can excite people.
Mike Birtwistle, former adviser to the National Cancer Programme
Perhaps unsurprisingly, contrasts were drawn between this period and the more contingent nature of additional funding now, in a much tighter environment. Funding to cancer alliances is released in return for progress against the 62-day waiting target, and it has become a source of frustration to those trying to make sustainable improvements locally, according to one senior manager:
The ‘solution’ to deliver 62 days in contrast now relies on short-term money that comes along in increasingly panicky pots, primarily looking at waiting list initiatives which may improve one part of a pathway… but leads to blocks in another part of the pathway. The money comes mid to late year to be used in 4 months if you are lucky. It’s all very reactive and panicky and not at all along the lines of the cancer strategic spend that was initiated as part of the original cancer plan.
Anonymous
4-8 Levers: targets, commissioning and incentives
There is a risk that the preceding narrative might be seen as describing some sort of heyday, a time of engaged, informed local clinicians and managers systematically improving cancer services with the help of good research and data, aided by a following wind of comparatively generous funding and a well-endowed central team in the Department of Health. But the experience of the cancer reform work between 2000 and 2013 also reveals a tension between a collaborative approach and the pressure from government to demonstrate improvement within defined time frames.
An example is the eventually successful implementation of the 62-day waiting time target. The NHS Cancer Plan had set the target to be achieved by 2005. One asset in delivering this was the Cancer Services Collaborative, which worked with local cancer networks and trusts to understand and redesign their pathways, through large-scale, facilitated events. Andy McMeeking worked with the National Cancer Action Team from 2000:
The cancer services collaborative started building a groundswell of bottom-up improvement. Clinicians popped up who were very enthusiastic, and there were some real leading lights, quite willing to challenge their peers. That really helped make changes happen.
But as the National Cancer Action Team and the Department of Health began to build up a database of reliable waiting time data, it became apparent that the target was not on course to be met:
I remember, we were all pulled into a room in about 2004, when we were starting to measure cancer waits but we definitely weren’t on the trajectory to get to 95% [to hit the waiting time target]. We were at around 75% or so. There was lots of good work the collaborative was doing, in terms of improvement, and I think there was a feeling that we might get there, but there was also someone in the room who clearly recognised they didn’t think we were going to get there and we needed something, an additional focus.
Andy McMeeking, former Associate Director, National Cancer Action Team
That additional focus came from outside the National Cancer Action Team, in the form of intensive support teams, overseen by senior NHS managers who brought in some operational clout.
[X] appeared, scared us all, but actually had a fantastic grip on the detail as well as how do chief execs operate, and how do you get trusts moving and to respond to something. Then he got involved, and the Intensive Support Team mobilised and [became] operational, and that was just a totally different focus.
Andy McMeeking, former Associate Director, National Cancer Action Team
I think the ‘Prime Minister’s Delivery Unit Review’, as it was called, did help to bring that more quantifiable picture together and it started to say, ‘Let’s now be really clear which organisation, or which network, or which pathway is giving us the biggest problem, and let’s put the data… ’ whereas in the collaborative we were able to review clinical pathways and redesign the end-to-end patient process, but without national data systems and systematic data we became quite unscientific and were unable to measure the national impact of any change. Blobs on charts are OK for demonstrating localised change cycles but not change on a national footprint.
Janet Williamson, former Director, Cancer Services Collaborative
No single approach to meeting the 62-day target was sufficient, but collectively all were necessary. The Cancer Services Collaborative engaged clinicians with the challenge and showed what enthusiasts could achieve. There was robust measurement and central coordination from the National Cancer Action Team, and intensive support was offered for struggling teams. The target was achieved almost on schedule.
Local commissioning
Local commissioning as a lever for improvement was conspicuous by its absence from many of the interviews. This is partly a function of scale (most PCTs were much smaller than cancer networks), but also the timing of change in cancer, as commissioning bodies have been subject to extensive reorganisation during most of the period of analysis.
As set out already, cancer networks were the main vehicles for implementation from the early 2000s. Cancer, perhaps uniquely as a condition, contains patient pathways that cross many organisational boundaries, from primary, secondary through to tertiary care, and the networks covered large populations of between 1 and 3 million people. In the 2000s, PCTs were part of networks, but often delegated to a lead PCT, that worked on behalf of several other commissioners. Networks were also charged with carrying out planning functions in relation to services and workforce, which effectively duplicated what PCTs were doing.
But the lack of engagement with commissioning became a more obvious problem in the run up to the 2012 reforms, when it became clear that PCTs were going to be abolished. As well as an exodus of experienced people, the creation of CCGs as statutory bodies was equated to a loss of leverage, in the view of the former National Clinical Director, Sean Duffy, who took over the role in 2013:
The current mechanism of regulation through NHSI [NHS Improvement] for providers and NHSE [NHS England] for commissioners has clearly not worked and keeps the two important parties apart when both are really necessary to the solutions that fall out of pressures in performance. With the dismantling of the command and control structures post the Lansley reforms, together with the legislative framework of the Health and Social Care Act of 2012 that recognised the ‘independence’ of CCGs, it has felt that there has been both lack of grip and teeth in contending with deterioration in performance.
Not all interviewees agree with this interpretation. Leverage from the centre over CCGs could be powerful, but since 2013, CCGs were under financial pressure and overloaded with priorities, and unable to respond to anything other than a top priority. One senior civil servant reflected:
I spent some time with a CCG to understand better how they worked, and at one point I said, ‘Why don’t you do any work on X?’ The CCG chief exec laughed and said, ‘I have to focus on the things I’m going to be beaten up for not doing or things that I can see will save money. There is not enough time in the day to pursue clever ideas.’
For those campaigning for a substantial shift in action to improve survival rates locally, nothing will change while the system (and aligned financial incentives) prioritises waiting times above outcome measures. John Baron MP, until recently Chair of the APPG on Cancer, has long campaigned for a shift in approach from NHS England:
The reason I say we’ve got further to go is that the money is still attached to the process target, and I’ve spoken to too many CCG chairs who say as long as that’s the case, the 1-year [survival] outcome indicator will always be the poor cousin.
Financial incentives
The National Cancer Programme evolved in an era when financial incentives, in various guises, were developed and deployed to generate higher-quality and/or more activity in both primary and secondary care. These incentives included:
- the Quality and Outcomes Framework (QOF) to incentivise general practice to improve the quality of care, particularly for long-term conditions (from 2004)
- the development of a national treatment-based tariff (payment by results) and competition between hospitals for patients, (patient choice) (from 2004)
- the Commissioning for Quality and Innovation (CQUIN) scheme for incentivising specific quality and efficiency improvements (from 2009).
Although some ‘best practice tariffs’ and CQUINs are now in use in relation to cancer care, they are relatively recent. It was striking that, among those we interviewed, these policy levers were perceived to have played very little part in driving improvement or rewarding innovation in cancer services.
I think the NHS finds it impossibly difficult to really reward innovation – high-quality, state-of-the-art care. The reward systems and management attention are much more focused around managing to budgets. When your primary metric is: ‘Did you meet budget or not?’, it doesn’t encourage innovation. Which is not to say there aren’t some reward efforts, for example CQUINs, QOFs, etc, but they’re so small in the grand scheme of things, that they don’t really provide a compelling incentive for change, whereas NHS leaders get severely reprimanded if they don’t meet budget.
Sir Harpal Kumar, former Chief Executive, Cancer Research UK
Attempts to develop a QOF indicator for cancer (beyond keeping a register of patients with cancer) were unsuccessful (until 2012 when a QOF indicator was added for holding a review with cancer patients within 3 months of diagnosis). In the hospital sector, the presence of payment by results was more often seen as an unintentional brake on progress. For example, the payment by results tariff seemed unable to incentivise trusts to maintain and staff diagnostic equipment (see section 3.4.3), or hampered innovations such as risk-stratified follow-up. Risk-stratified follow-up was set out in the 2015 cancer strategy as part of a more personalised approach to supporting patients after treatment of cancer. It can involve a departure from traditional outpatient follow-up (paid for per attendance), by investment in other kinds of support for patients. All cancer types should be moving to stratified follow-up by 2020, but some charities are reporting that the existing financial incentives are acting as a block to this:
Getting the funding flows to work is difficult, because the incentives are not always right, and the commissioners might say they want the whole cost of outpatient appointments back, when actually some is needed to fund the support worker. The way the money flows work in the NHS can be very frustrating, especially when something which seems like a ‘no-brainer’ improvement, being better for patients, as well as saving money for the system overall, gets stuck because the tariff payment system doesn’t keep pace with the innovation.
Angela Culhane, Chief Executive of Prostate Cancer UK
4-9 Politicians
Pledges to improve services for specific diseases now seem commonplace in party election manifestos, but this is a relatively recent phenomenon. Before 1987, when better breast and cervical screening services were promised, manifestos of the two main parties generally signalled very general improvements in the NHS, such as commitments to increase staff numbers or build new hospitals. In 1997, the Labour manifesto promised a faster route for breast cancer patients into treatment, even going as far as specifying the time span of 2 weeks. The pledge had its origins in the 1996 Labour Party conference, as the former Shadow Health Secretary, Chris Smith, remembers:
We were coming up to the party conference in September that year and I knew I needed to find something that was going to be an eye-catching initiative. I already had a commitment in the bag, which I was able to make at the party conference to ban all advertising of tobacco products but I needed something else. It seemed to me that cancer was probably the most high-profile of all areas of disease, it was the one that most people feared most and it was also probably the most serious of all the bits of illness that the health service had to try and deal with. The very clear message that I was getting from other people around the world of health was that the most important thing for cancer, for better success in cancer, was early diagnosis. That identifying the problem early would mean that you would get better outcomes. That was why I then felt my way towards the you-will-be-seen-in-2-weeks commitment that I gave in my speech at the party conference.
As we described above (in section 1), it took the best part of 2 years for the new Labour government to generate bold plans for NHS reform, including cancer and other diseases, which were underpinned by substantial new investment. This arrived in April 2002 in the form of a 1p in the pound rise in National Insurance, the proceeds of which were to be directed to the NHS:
You can’t underestimate the importance of these decisions to raise taxes to pay for health care. This was a very difficult decision, by the way I don’t think that it’s very easy to introduce a huge tax rise. It was the biggest peacetime tax rise; it was £9bn devoted entirely to the National Insurance system and the health services.
Gordon Brown, former Chancellor of the Exchequer and subsequent Prime Minister
New finance supported plans for the NHS, which, when they did emerge, were very visibly championed, first by Tony Blair and subsequently Gordon Brown in their roles as Prime Minister. Looking back, most people we interviewed felt that this high-level political backing had been helpful:
We were very lucky to have the Labour government. People criticise Tony Blair, but I think he was tremendously important in terms of the change in thinking, and the ability of doctors to influence politicians for better health care.
Phil Quirke, Professor of Pathology, University of Leeds
Nevertheless, this profile came with side effects, particularly the intense command-and-control style of government that is associated with the Blairite period, and his delivery machinery, known as the Prime Minister’s Delivery Unit. Tony Blair explained how that machinery brought a welter of performance information into Number 10, especially in relation to how well the NHS was managing waiting times:
I was getting, literally, weekly updates on what was happening. I think, you know, people constantly underestimate that importance of, sort of, laser-like focus on the priorities that you have, because it’s the only way that government, in the end, responds and gets things done.
Tony Blair, former Prime Minister
This laser-like focus on cancer had, inevitably, downsides. These include opportunity costs, in terms of other diseases that were perceived to have less political heft behind them. Although Blair was careful to have only ever framed cancers as ‘a’ top priority, not ‘the’ top priority, there was nonetheless a perception that cancer has been pushed, relentlessly, to the top of any party’s political agenda on the NHS.
Cancer has established a positioning where you can’t afford not to pay attention to cancer because people will challenge you about that. Diseases like Alzheimer’s and other forms of dementia aren’t always in that space, despite costing more each year than cancer.
Jeremy Hughes, former Chief Executive, Breakthrough Breast Cancer
Another downside of close prime ministerial involvement is built into the democratic process. A change of government will inevitably bring a new set of priorities. Although cancer has remained prominent, there has not subsequently been the same degree of personal prime ministerial involvement after 2010. David Cameron was more publicly associated with pushing forward the Cancer Drugs Fund, while Theresa May has focused, until very recently, more on mental health.
As well as very senior ministerial attention, cancer has also had an active and influential advocate in the House of Commons, in the form of the APPG on Cancer. Formed in 1999, the APPG has had three chairs over the period. Since 1999 the APPG has run an annual conference each winter known as Britain Against Cancer.
I think it’s now certainly one of the largest, if not the largest gathering in the UK, of the cancer community. You get the speakers in, you get the top flight, you get the Secretary of State, Shadow Secretary of State.
John Baron MP, Chair of APPG on Cancer, 2009–2018
The APPG also meets ministers regularly, and places oral and written questions on cancer:
Health Questions is a good example of where we try and organise ourselves so we get a cancer question on the Order Paper. The Speaker knows us well enough now.
John Baron MP, Chair of APPG on Cancer, 2009–2018
Underneath this, according to several of our interviewees, has been the failure to effectively communicate to politicians in government how long it really takes to deliver change, or, in the words of Professor Peter Selby, how ‘grindingly relentless’ you need to be to make change happen in complex systems:
The politics of improving cancer services are complex. The government changes colour and it has to have a new policy owned by that government. Politics has to be like that. In a democratic society, we probably have to do things that way. If you want to create something that transcends the political process, then professional power and patient power are the two resources you’ve got.
4-10 Charities and the patient voice
One of the great assets of British society is that you have charities [that] are about changing the world. We are there to push boundaries, to be challenging. We can see the results over the years.
Jeremy Hughes, former Chief Executive, Breakthrough Breast Cancer
The ability of cancer charities to campaign and lobby on behalf of patients has changed beyond recognition since the 1980s. Some of the earliest campaigning activity emerged around breast cancer and tobacco control (with Cancer Research UK and Action on Smoking and Health among the key players). Charities such as Breakthrough Breast Cancer lobbied for the creation of breast screening services, which appeared in both the Labour and Conservative manifestos in 1987. By the mid-1990s, the breast cancer charities were working together and, inspired by ‘pink ribbon’ campaigns in the US, had persuaded celebrities, including models, to wear campaign T-shirts to lobby for greater public awareness of early diagnosis. The message was not always popular as Baroness Delyth Morgan, Chief Executive of Breast Cancer Now remembers:
It wasn’t comfortable. People didn’t want to hear it. [Clinicians] disbelieved it and I actually had a few, who were incredibly aggressive towards us about [it] saying, you know, ‘Why would we want to fill up our clinics with worried well, when it doesn’t make any difference?’
But charities such as Breakthrough Breast Cancer were determined to influence politicians, and party conferences were an obvious new vehicle for this:
It was just about creating a noise. I suppose, because other people weren’t doing it, there weren’t any other health stands there or anything. The big cancer charities weren’t there [in the 1990s].
Baroness Delyth Morgan, Chief Executive, Breast Cancer Now
Although the cancer charities may have been influencing politicians, it took longer for them to become an integral part of policymaking. The Calman–Hine report was drafted largely by experts. Similarly, the NHS Cancer Plan was put together by a small, expert team, although the ideas were tested out with charities and other stakeholders before publication.
By the time of the Cancer Reform Strategy in 2007, this had changed markedly. Not only were charities integral to the creation of the reform strategy, they were also given leading roles in implementation. Cancer Research UK co-chaired the initiative on early diagnosis (National Awareness and Early Diagnosis Initiative), functioned as the secretariat, organised the subgroups and brought other charities together, as well as assisting the National Cancer Action Team to think through the overall direction of strategy. Sara Hiom, Director of Early Diagnosis and Cancer Intelligence, Cancer Research UK recalled:
If all these other subgroups were the ones that were looking to deliver the plan as was, our core group was doing the horizon scanning and thinking about what was coming next, and that was so important. That was sort of a gathering of minds where we chewed the cud and looked ahead and looked at what the evidence was, and what we should be doing with it.
Cancer Research UK (formed through the merger of Cancer Research Campaign and Imperial Cancer Research Fund in 2002) was already a major funder of clinical research. The charity’s ability to fund research (funding a new stream of research in primary care) alongside pilots, meant they could step in more quickly than the statutory services:
Take something like the Denmark model of a multidisciplinary diagnostic centre. We’ve known about Denmark’s work in this area for 7, 8 years, probably. We’ve not been quick to move forward in this country. NHS England is now piloting some models. Those pilots would probably not have happened if Cancer Research UK hadn’t pushed them forward as part of the ACE programme.
Sir Harpal Kumar, former Chief Executive, Cancer Research UK
Macmillan Cancer Support has also been a major player in cancer, both as a provider of services and as a campaigning group, taking a particular lead on the survivorship initiative. The combined lobbying power of the major charities was also seen as beneficial from inside the Department of Health:
Macmillan and Cancer Research UK did such a good job at keeping the political pressure on – it kept Number 10 very interested in improving cancer services and outcomes.
Jane Allberry, former Deputy Director, Department of Health
Behind the ‘big two’ charities, other charities have also played a crucial role, and have evolved considerably over the past two decades. These include charities for prostate cancer and bowel cancer, as Deborah Alsina, Chief Executive of Bowel Cancer UK said:
There has been an enormous change over the last 10 years in terms of people’s awareness of the disease. I also think charities like mine have a big role to play here, we’ve done a huge amount, you know. Last year between the two charities we probably had 3,500 pieces of press coverage. We’re going out to put this on the agenda very proactively.
There remain significant imbalances within the charity sector, however. For a few years the Rarer Cancers Foundation was a highly effective advocate for action on earlier diagnosis and improved access to treatments for rarer cancers, but this activity proved to be unsustainable and the charity wound up its operations in 2016. In 2006, 15 charities representing the rare and less common cancers were brought together in a coalition, named Cancer 52, (52 signifying the proportion of cancers outside the ‘big four’ of breast, colorectal, lung and prostate). Cancer52 has now expanded, and brings together 100 charities, but according to its Chief Executive Jane Lyons, still struggles to find the resources to work as effectively as their larger counterparts:
We have two main asks…we need to generate funding to keep our engine room running so we can carry out our core mission of raising the voice of rare and less common cancers, sharing information with our near 100 cancer charity members and attending meetings as a representative of those cancers. The second ask would be to write our own strategy for what we need for rare and less common cancers in the next cancer plan or strategy and make sure that we generate more focus on these cancers in the next iteration of the NHS Plan.
The combined power of the cancer charities has been crucial in keeping momentum on cancer after the national cancer team was effectively abolished after 2013. Viewed from the perspective of other disease areas, for example stroke, the formidable lobbying of the cancer charities all but guaranteed its inclusion in the Five year forward view, and omitting cancer would have been impossible.
The Five year forward view document was hugely important. If your condition didn’t feature in the Five year forward view, it didn’t get into the planning guidance or the CCG Outcomes Indicator Set and therefore didn’t get prioritised for local action and funding. Stroke was nowhere in the Five year forward view. This has mattered because momentum has started to stall in all areas, including acute service reconfiguration, rehabilitation and long-term support. Four years ago, the Stroke Association as the UK’s only stroke support charity didn’t have the power or voice to change this, whereas the cancer charities were more mobilised and effective in speaking with a loud voice.
Juliet Bouverie, Chief Executive, Stroke Association
While charities played a powerful role in representing the views of patients, they were not the only route. The cancer networks also had patient representatives, who were often vocal in pressing for change. While it lasted, peer review represented another vehicle for patient involvement, although it was initially resisted by some clinicians, as Ruth Bridgeman remembers:
There was conflict, which I find hard to believe now, [about] the patients being part of the teams, which clinicians found really difficult to accept, and it was always something that we were advised to watch by the hospital management. It was really interesting how quickly clinicians thought that was a great idea. I think what surprised everybody, including myself, to be honest, was how supportive the patients were of their clinical teams, so it became a much stronger bond after you’d been to a service, even if the service hadn’t been talking to their patients, they then engaged patients much more after that.
Outside these sort of formal routes for involvement, many of the clinicians and managers interviewed for this report reflected on how difficult it seemed for patients as a whole to act as a lever for improvement, for example by using published data to demand access to the best or most innovative treatments:
You might come in [as a patient] and ask the question, and you’ll get the response from the consultant, ‘Great practice. We get good results.’ The real challenge to be a patient, and to really challenge that, you have got to be super human at a time when you are feeling very vulnerable.
Teresa Moss, former Director National, Cancer Action Team
Clinicians, especially those familiar with patient lobbying in other countries, also wondered whether some aspects of this might be culturally rooted in the British psyche:
Our patients are incredibly trusting and just assume that everybody, the NHS will do its very best for them, which on the whole it does. Absolutely. But this has the down side that surgeons can be very slow to implement more up-to-date techniques or improvements in care delivery which means there are large variations in the delivery of best practice and even evidence-based care. Patients can be powerful drivers of care improvements. In England we have a surprising number of late stage diagnoses of cancer: the reasons for this are complex but one reason may be that our patients worry about ‘wasting’ what they are constantly told is a limited resource that could be used for someone else more deserving. We encourage women to be breast aware and present with any symptoms, yet in the rapid diagnostic clinic patients say to me, ‘Oh, I’m so sorry to have wasted your time,’ when you tell them that everything’s okay. I say, ‘You have not wasted my time, it’s with great pleasure that I am able to tell you that you have normal breasts and please, never, ever, be worried about coming to see me again because it is not a waste of my time to tell you your breasts are normal.’
Fiona MacNeill, Consultant Breast Surgeon, Royal Marsden NHS Foundation Trust
The best-evidenced manifestation of this reticence is the findings of the International Cancer Benchmarking Partnership research, which identified a similar reluctance to waste a clinician’s time, in this case the GP.
Patients don’t like to bother the doctor – we needed more work to understand what that meant. Was it that they were frightened of what the doctor might tell them? Was it that they couldn’t face the hours of trying to get through on the phone? Was it that they were insufficiently informed about ‘alarm symptoms’, if you like? We needed to understand what that meant, and I’m not convinced we yet understand what that means.
Amanda Ramirez, Professor of Liaison Psychiatry, King’s College, London
More research is evidently needed if policy is to be based on assumptions about patient attitudes and behaviour. The PIVOT study investigated patients’ desire to be tested for cancer, even if the risk of finding cancer was low. Professor Willie Hamilton led the study, which compared how much patients wanted to be tested for cancer faced with variable risks (ie whether the risk of finding cancer was 10%, 5%, 2% or 1%), which fed into the development of NICE Guideline 12. He said: ‘There was just a desire to be tested full stop. That as soon as you mentioned the C word, people said, “Test, test, test, test, test.”’
4-11 The media
We interviewed several journalists for this report, both print and broadcast. All were candid about the complex motivations that lie behind the selection and promotion of stories in general. This includes appealing to the demographic that buys that particular newspaper, listens to or watches that particular news programme, and, in the case of newspapers, the political affiliation of the editors or owners. A recent study looked at the press coverage of the Cancer Drugs Fund, from 2010 to 2015, and found substantial variations between newspapers in how much coverage was given to the Cancer Drugs Fund (and how positive or negative it was), and between different tumour types, with breast cancer over-represented, and lung cancer under-represented compared to their disease burden and mortality.
Whereas policymakers or clinicians might, from the outside, assume that some sort of systematic process is followed to decide when a story is to run on the front page, inside page or not run at all, in reality it is often shaped by gut instinct at pressurised editorial meetings. As two long-standing health reporters put it:
The news desk is staffed by an extremely primitive life form, you know? It has a very limited attention span and, unless you can get your line into 15 seconds, your top line, for the news list in the morning you’ll be lost.
Jeremy Laurance, former Health Editor, The Independent
The media’s a bizarre mix of competition and pack mentality.
Nick Timmins, Journalist
The appetite for political stories, human interest and a search for novelty may be constants in what shapes the media output, but in relation to health stories, our correspondents agreed there have been some important underlying shifts. Cancer still commands headlines now and has done during recent decades. Nick Timmins, formerly of the Financial Times, remembers poor-quality reporting, mostly relating to cancer research, from the 1970s onwards:
30–40 years ago cancer was the great story, but in a different way. Everyone was looking for the cure for cancer. You’ve got to remember [Ronald] Reagan’s war on cancer, 30–40 years ago – the ‘Big C’ and all that. As though cancer was just one disease. And that was reflected in media coverage over here. You’d get a study showing that some compound reduced tumour size in six rats, and the headline in some of the papers would be ‘cure for cancer, it’s just around the corner’. There was loads and loads of that.
But it took longer for the media to look at how well the NHS was treating specific conditions. The appetite for stories grew, especially as evidence began to emerge from the late 1980s, from the EUROCARE studies of the UK’s relatively poor performance. When Jeremy Laurance, former Health Editor of the Independent, did an audit of his own stories in the 1990s, at the beginning of the decade, stories about heart disease vastly outnumbered cancer. But, by the end of the decade, this had reversed, for a variety of reasons, not all of them noble:
Partly that is because heart disease was falling and breast cancer was rising, but I think that it was also that heart disease was associated, basically, with old men and breast cancer, rightly or wrongly, we associated with young women. Also the breast cancer lobby really got its act together during the 1990s and we had all the October Breast Awareness Months, we had fun runs, and we had advertising.
Throughout this period the increasing number of celebrities willing to ‘go public’ with their cancer stories played a part in raising the profile of cancer in the media, in conjunction with the various cancer charities. Early breast cancer stories such as Kylie Minogue (2005) were followed by the death of reality TV star Jade Goody in 2009 from cervical cancer, the latter almost certainly saved hundreds of lives as it prompted large numbers of women to attend cervical screening. More recently, celebrities with other forms of cancer have emerged with compelling testimonies, including those on prostate cancer from Bill Turnbull and Stephen Fry.
Bill Turnbull’s decision to go public about his prostate cancer and the Daily Mail’s campaign made a real impact. Everyone learned from the success of the breast cancer campaign which demonstrated the difference that could be made to funding and the difference which could be made in terms of empowering patients so that they don’t feel ashamed and embarrassed.
Nick Robinson, Presenter, Today Programme; former Political Editor, BBC
Not all cancers are equal. Both journalists and charities remarked how much harder it has been to generate coverage on bowel cancer, even now:
News editors don’t like talking about it [bowel cancer] and they think people don’t want to read about it over breakfast… it does come down to that.
Chris Smyth, The Times
Nevertheless, the combination of the increasing profile of celebrities with cancer – most recently with the late Baroness Jowell – coupled with growing awareness that cancer was no longer inevitably a death sentence, shifted the attitudes of editors, in both print and broadcast media.
What’s more, I think that TV networks realised these stories attracted people to watch, rather than turned them off. The case of Tessa [Jowell] showed that people connect with a story, they find it very powerful and moving and they want to know more.
Nick Robinson, Presenter, Today Programme; former Political Editor, BBC
There was a lively debate about the extent to which the media’s interest in cancer had been at the expense of other, equally debilitating, diseases. There has been a growing interest in covering mental health stories and dementia, with some campaigners drawing on the experience of working in cancer. Jeremy Hughes, formerly of Breakthrough Breast Cancer, now with the Alzheimer’s Society, reports how he responds regularly to media reports of small pieces of research with small sample sizes:
Many of the tabloid media stories are taking research out of context and suggesting, for example, that if you eat broccoli twice a day, you won’t get dementia. I’ve seen the same sort of stories around cancer. I am at pains to respond: ‘This is a small research study – interesting, but much more to be considered.’ However, what is positive is that the reason the editors put it on the front page is that they know their readers are interested. So, it’s a similar thing with cancer. You know, there is a public interest that has been created over the last 20 years. It is about moving from ‘Nothing can be done’, to ‘Something can be done, differences can be made.’
Set against this view was a perception that the public’s interest in cancer was declining precisely because many cancers are becoming increasingly survivable. Nevertheless, the prominence of cancer services in the NHS as a political issue will keep it in the public eye, if nothing else, according to the BBC’s Nick Robinson:
Part of what drives politics is addressing people’s anxiety and fear. What we know is that cancer [survival rates] have improved – even though it remains a source of huge fear – because it’s no longer the C-word and is no longer unmentionable. Whereas I suspect with heart disease and strokes, there’s more a sense of, ‘Well, what will be will be.’ You know, ‘I might be unlucky and drop dead with a heart attack.’
There was near universal condemnation of the impact of the 2012 Health and Social Care Act on many aspects of the cancer system. The primary observation made by many interviewees was the loss of expertise, from the central team through to the networks. This includes perspectives from charities:
Our take here is quite simply, after the Lansley reforms, the system was stripped of policy, insight, service improvement resources, whatever or whoever they might be, and some of that was in cancer networks. Everyone says, ‘Oh, not all networks work perfectly.’ Well, they didn’t, but there were people in there who knew how things worked and who could do things. In the Department of Health, you had policy advisers, you had the Cancer Action Team. So, you had a whole army of people who were devoted to improving cancer outcomes and making it work. So, if you wanted to introduce a bowel cancer screening programme, you had people who could do that, who would know about it, know people, think about what’s the right way to go about it and get an implementation plan and do it. So, virtually all of that disappeared almost overnight, and it has taken time for elements of it to be rebuilt.
Baroness Delyth Morgan, Chief Executive, Breast Cancer Now
The best way of describing 2012 to 2013/14, was just sort of blindfold in a fog, groping around, trying to find bits of the old world and bring them back together again. I mean, the whole NCAT [National Cancer Action Team] was dissolved, there was hardly anybody at the Department of Health any more with a cancer focus, the change of guard was just really, really depressing because the cancer networks were broken up. We started, you know, so many from scratch. People who had decades or more experience in this area of cancer policy just took the opportunity to leave.
Sara Hiom, Director of Early Diagnosis and Cancer Intelligence, Cancer Research UK
More specifically, interviewees reported negative impacts of moving public health out of the NHS locally. A senior clinician spoke to us anonymously:
I think there has been nothing good come out of Lansley, I think there has been a lot of destruction. I have been in the business for a long while [and] I think I have never seen such an impact in my life. You know, and that’s what we’re trying to rebuild, a connection between the different parts of the system. Talk to any public health doctor that is now working in public health, in local authorities, that has been a martyrdom as far as they’re concerned because they enjoyed the concept of being close to the NHS when they were part of PCTs.
The shift of cancer data to Public Health England also caused disruption for health services researchers:
It all, kind of, fell to pieces. So, then we all, kind of, everything stopped for quite some time. We got moved out in to the university, we couldn’t access data. The whole carry on. Massive fights in Public Health England about what data went where, who was in charge of it. The split of the registries from the analytical function. Loss of huge capacity, you know, there’s such an acquired knowledge and huge knowledge in the system that just got dissolved.
Eva Morris, Professor of Cancer Epidemiology, University of Leeds
While the disruption was undeniable, there were mixed views about the degree to which momentum has been rebuilt. Some remain confounded by the post-2012 structures, one of whom is Mick Peake:
You know, you’ve got the STPs [sustainability and transformation partnerships], you’ve got the CSUs [commissioning support units], you’ve got the CCGs, you’ve got the alliances, you’ve got the regions. They don’t overlap. I don’t know quite what the STPs do. They’re all doing different things, for example. Who makes the decisions is completely obscure, even when you sit on a [Vanguard] board which I’ve been doing now for over a year, it’s not clear to me who finally, at a local level, influences the decision making. This is then complicated by specialised commissioning which is totally separate. I just don’t see any coherence.
Mick Peake, Professor of Respiratory Medicine and former Cancer Services Collaborative Lung Cancer Lead
The fragmentation of the NHS in successive health reforms looks, at least from the outside, to make it very much harder to make a major strategic policy in a disease area operate well, because it is not clear how it could be driven, how it can be monitored, how the dialogue about it can energise people and make things happen.
Bob Haward, Professor of Cancer Studies, University of Leeds
It is difficult to disentangle criticism of the reorganisation from the impact of the funding squeeze.
I’ve been nowhere near the Department of Health in a very long time, and in Mike Richards’ period that was totally different. We were in there, we were influencing people, and they listened. These days, they don’t want to listen, because it might mean they have to spend some money, and that is not only inappropriate but missing out on an important source of informed advice.
Phil Quirke, Professor of Pathology, University of Leeds
Discussion
This report has presented an account of change in cancer services over the past two-and-a-half decades. Drawing on data and testimony from many of the people involved, it has explored the evolution of the national cancer strategies up to 2015, and highlighted aspects of their constituent policies, from screening to living with and beyond cancer.
One of the objectives for this report was to try to identify which elements of the national approach to improving cancer in England were successful and less successful, and suggest reasons as to why. We knew, before embarking on the report, that this endeavour would be imperfect from a research perspective. We were unable to find any comprehensive evaluations of the cancer strategies in the research literature. Earlier Health Foundation analysis of the evidence base underpinning strategies to improve quality in the NHS in England (A clear road ahead ) noted that progress on the cancer strategies, like the other nationally focused programmes on mental health or coronary heart disease, that date from the same period, was primarily assessed through official publications (from the Department of Health, or regulators such as the NAO or the Commission for Health Improvement) and by some of the disease-specific charities.
There is no counterfactual of what might have happened in the absence of the NHS Cancer Plan and its successors. The close tracking of England’s cancer policy by the devolved nations makes it difficult to use the natural experiment of the UK’s four nations in any meaningful way. Independent academic analyses of data on outcomes (1 and 5-year survival rates) have argued for progress (or lack of it) as evidence of the impact of the cancer strategies but are unable to shed light on the impact of the different components of the strategies themselves.
In drawing out learning in this discussion, we are primarily (and unavoidably) reliant on the seasoned judgement of those who were closely involved in managing, implementing and expanding the evidence base of the many components of the cancer strategies: the senior clinicians, managers, researchers from the NHS and voluntary sector.
A consistent theme that emerged from many of the interviews was the creation of a broad community for change through a national cancer strategy. It is possible to distinguish separate components of this, that in combination, were perceived as having created a sense of momentum, particularly among clinicians.
An evidence base, credible enough to command clinical support, that encompasses service guidance as well as clinical guidelines
The NHS Cancer Plan was built on firm foundations laid by the Calman–Hine report. A critically important component of these was the creation of service guidance, based on syntheses of the best available evidence. The strength of these enabled change to be pushed through, often in the face of clinical resistance. Calman–Hine implied changes in who clinicians worked with (ie the MDT) and what sort of work they should do (ie centralising some procedures, ceasing doing others).
Changes of this nature, which reach deep into the working practices of a large group of clinicians, some of whom had high levels of autonomy, attract challenge and resistance. But the testimony of those charged with rolling out the Calman–Hine recommendations suggests that this was offset by the clarity of the Improving Outcomes Guidance, and their scope. By going beyond clinical guidelines (which is generally applicable to individual practice) to encompass how services might be configured to maximise improvement, the guidance also provided a sense of direction for teams as well as individual clinicians.
Mechanisms/infrastructure to bring clinicians together across organisational boundaries, equipped with capability to improve
As important as the clarity of the guidance itself, was the vehicle for their implementation: the cancer networks. At their best, the combination of adequately funded cancer networks and the cancer collaboratives were able to mobilise a coalition-of-the-willing to pilot new ways of working, and share learning with peers. While some of this activity was aligned with a ‘managerial’ agenda (ie redesigning pathways to meet waiting time targets), much of the activity was not, and represented a mechanism to engage clinicians (and acknowledge success) ‘outside the management mainstream’ in Professor Bob Haward’s words. The networks, supported by the Cancer Services Collaborative, used improvement methodologies and were able to fund time for clinicians to meet and learn together across teams and organisational boundaries, and include patients. Between 2000 and 2013 they provided a stable forum for clinical focus on cancer while there was flux in other areas (for example the creation of PCTs and expansion of foundation trusts).
Although a period of central ‘grip’ was applied in the mid-2000s to speed up progress towards meeting a waiting times target, the more voluntary approach of the networks and collaboratives may well have laid the groundwork for a more aggressively managerial approach to work.
Visible leadership
The network development programme (which brought together networks several times a year) functioned as a mechanism to connect local leaders (including patient representatives) directly to the National Clinical Director, which enabled a two-way exchange of information, as well as a space for networks to share experience and learning with each other.
Regular feedback from the networks, whether positive or negative, was one strand of soft intelligence that fed into a central leadership team that had a comprehensive overview of the quality of care being delivered. Data from registries, audit, NHS trusts, screening and research all flowed into the National Cancer Action Team. This needed the infrastructure of a team behind it, but also a clinical leader with a mandate to act on it, and engage with the full range of stakeholders in an inevitably complex landscape of professional bodies, charities, and the research and academic community. Communicating the rationale for change so that it can be related back to those delivering services was vital, but also time-consuming, and required the capacity for the leadership to be physically present at as many professional fora as possible. Another important function was the ability of this team to face inwards, and understand the development of other system-level policies, and their potential interaction with the cancer strategy. This also served the purpose of keeping cancer in the minds of the senior NHS leadership, and ministers. The central team also acted as radar for future developments in research and technology.
A clear and powerful patient voice
In the case of cancer, the big charities acted as a powerful vehicle for patients’ perspectives, that fed into the development of strategies, shaped research and became increasingly savvy with the media. Cancer has some unusually large charities, (Cancer Research UK and Macmillan Cancer Support) but some of the smaller charities, for instance for teenage cancers, were often able to punch above their weight. The national cancer strategies also opened up spaces for patients to be heard outside the charities. Patients were increasingly incorporated into cancer networks and peer review, and their presence in these was increasingly welcomed by professionals.
Data was the golden thread through all of this
Even though cancer data were already rich compared with other disease areas in the late-1990s, it has developed markedly since then, both in scope and the capacity to be linked to get a picture of what happens to patients across different organisations. It has taken time and there are still gaps. Patient experience of services is captured well; their quality of life after treatment is still not reported on a national basis. Nevertheless, an increasing amount of data on outcomes and processes of care that flowed into the central team from the early 2000s enabled oversight of progress on implementation, and was able to support both research and improvement locally.
5-1 Learning for future national improvement programmes?
Previous Health Foundation analysis has summarised (and contributed to) research on what needs to be in place to improve quality, applicable to two very distinct levels of the health system. The attributes of national, overarching quality strategies have been described and appraised (A clear road ahead, Constructive comfort), while there is an extensive and vibrant literature on what needs to be in place at an organisational, network or team level, to improve quality and spread good practice (some of it also summarised by the Health Foundation)., This leaves a gap where national programmes such as the cancer strategy are concerned: should they be thought of as scaled-down national strategies, or scaled-up improvement approaches?
5-2 The cancer strategy as a ‘vertical’ improvement programme
One approach might be to think of national condition or disease-specific improvement programmes as ‘vertical’ versions of a national quality strategy, that is, they should aim to have the same coherence and scope. In previous work, we have analysed the quality strategies for the NHS in England as a whole against examples of frameworks designed to shape comprehensive approaches to quality. In A clear road ahead, we used the Juran trilogy and the NHS Quality Framework, adapted from the 2008 High Quality Care for All.
Figure 33: The Juran Trilogy
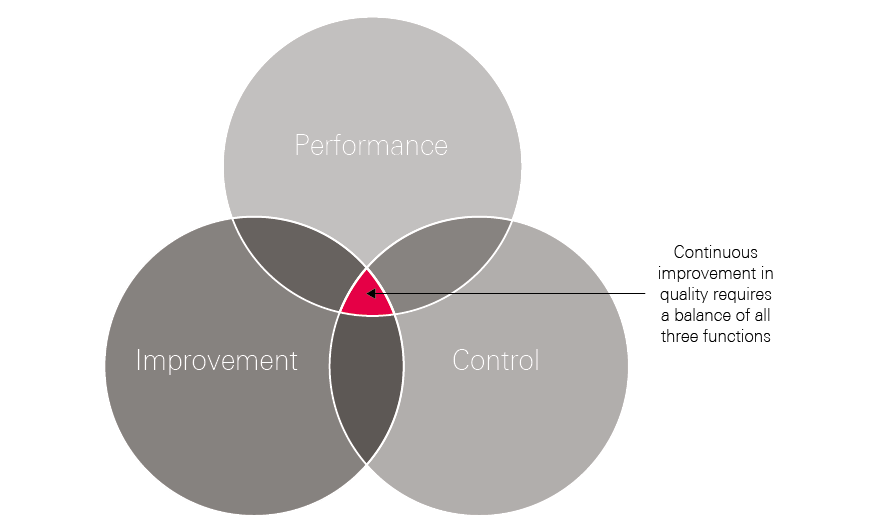
The Juran Trilogy suggests the need for a balance between planning (to set direction), improvement (through meaningful support to professionals and organisations) and the appropriate use of control mechanisms. Applying the insights from the analysis of the cancer plans set out in this report, the national cancer plans, central team, networks and data, enabled improvement and planning to take place between 2000 and 2015. But control was perhaps a weaker element, given the reliance on central grip for waiting time compliance, limited regulation once peer review had subsided, and the difficulties of establishing commissioning as a lever to improve cancer outcomes at local level. The National Cancer Action Team also lacked the metrics for monitoring or performance-managing outcomes, or even proxies for outcomes (eg stage).
Another conceptual approach is to apply the NHS Quality Framework (set out below), a framework that describes the functional capabilities needed to enable quality to improve at a national level.
NHS Quality Framework
-
Set direction and priorities
Setting clear quality priorities and an agenda for quality improvement and desired outcomes and performance data.
-
Bring clarity to quality
Setting standards for what high-quality care looks like across all specialties.
-
Measure and publish quality
Harnessing information to improve quality of care through performance and quality reporting systems that provide feedback to providers of care at systemic, institutional or individual levels, and information to users and commissioners of services for accountability and choice.
-
Recognise and reward quality
Recognising and rewarding improvement in the quality of care and service through financial and non-financial recognition (eg enhanced reputation or prestige).
-
Safeguard quality
Using regulation to improve health care, to guarantee minimum acceptable standards and to reassure the public about quality of care.
-
Build capability
Improving leadership, management, professional and institutional culture, skills and behaviours to provide quality assurance and improvement.
- Stay ahead
Developing research, innovation and planning to provide progressive, high-quality care.
If these functions are applied to our analysis of the national cancer strategies and implementation over this period, then many of the components were either in place, or developing between 2000 and 2015 (Table 11).
This assessment suggests that the National Cancer Programme succeeded in having activity in all seven functions of the quality framework, even if not evenly spread or perhaps running concurrently. Nevertheless, there are gaps, as many of our interviewees reflected. Some of these gaps relate to the limited reach of the efforts on cancer services, mainly directed at secondary and tertiary care, with action to include primary care beginning much later in the 2000s. The definition of ‘quality’ as encompassing ‘living with and beyond cancer’ has also taken much longer to develop and implement.
Table 11: Assessment of the NHS Cancer Plan/strategies against the NHS Quality Framework
|
Set direction and priorities |
Articulated in NHS Cancer Plan and subsequent strategies. |
|
Bring clarity to quality |
Improving Outcomes Guidance fulfilled this for tumour groups; some areas still underdeveloped, such as living with and beyond cancer. |
|
Measure and publish quality |
Good data on many outcomes; stage data only recently available; more progress needed on quality of life; more data needed to be made available at clinical team level. |
|
Recognise and reward quality |
Networks and peer review provided a route for recognition; financial incentives remained underdeveloped/ineffective, for example to encourage trusts to invest in diagnostic capacity. |
|
Safeguard quality |
Peer review fulfilled this for a while; the official regulator did not look at the quality of cancer services specifically, and has only very recently started to focus on this. |
|
Build capability |
Cancer Services Collaborative, cancer networks, nationally funded training programmes. |
|
Stay ahead |
National Cancer Action Team, at full capacity, had the resources to horizon scan. |
In A clear road ahead, our 2016 review of the NHS quality strategy for England as a whole, we suggested that the system had become over-reliant on ‘control’ or regulatory approaches to improving quality, particularly in the wake of the Francis Inquiry into the failings at Mid Staffordshire NHS Foundation Trust, a trend that may have since been exacerbated as the NHS as a whole has grappled with maintaining performance against waiting time targets in the context of constrained budgets. One of the lessons from this review of the cancer programme is – perhaps – that investing in the infrastructure for improvement – networks, collaboratives, data, a central team – may be more than just a luxury, if clinicians are to be mobilised to improve on a large scale.
5-3 Finishing the business: focus on early diagnosis?
At a much more simplistic level, it is possible to identify a set of ingredients that have to fall into place to improve the treatment for patients, whether in cancer, or any other conditions:
- Belief (at all levels of the system) that there is a problem that needs to be addressed.
- An understanding of what the drivers of that problem are.
- Data to accurately monitor the drivers and the outcomes of interest.
- Interventions to address the problem, with evaluation built in.
- The resources to supply the interventions, for example, workforce or capital investment.
- Support and encouragement for implementation (local capability and national support).
- Accountability for improvement.
One of the most striking observations made by those people involved with improving cancer, is how long it has taken to assemble the full list of ingredients. Looking back over the past 2 decades in relation to cancer in England, although national strategies since 1995 have repeatedly described the problem to be solved (poor cancer survival) (1), some of the subsequent ingredients listed have only very recently fallen into place. Take, for example, the problem of late diagnosis. By the late 1990s there was a belief among politicians, policymakers, patient groups and a critical mass of clinicians that outcomes for cancer were relatively poor compared with other countries, and that something needed to be done. But it took the best part of a decade to develop both belief (1) and an understanding (2) of how important a role late diagnosis was playing in England’s poor cancer outcomes, and insight into the factors that might be inhibiting patients from coming forward, and general practitioners from referring.
It is only in the past few years that data (3) have been collected systematically across the country on stage of cancer at diagnosis for each patient, a metric crucial to monitoring progress in the various interventions being tried, including earlier rapid diagnosis and expanded screening programmes. But although many of the factors are now in place for accelerating progress in early diagnosis, austerity and the disruption in the wake of the 2012 NHS reorganisation has disrupted other key components, for example, the capability and accountability for making change happen at local level. As we have described in this report, this is due to the dismantling of cancer networks, and fragmentation of many of the structures above them, between NHS England, Public Health England and other arm’s-length bodies. Although the wheels are now turning again in the form of cancer alliances and integrated care systems or sustainability and transformation partnerships, momentum was lost at national and local level and has had to be rebuilt.
Our report highlights the importance, above all, of the human infrastructure that needs to be in place to wield the soft power that is crucial to engage and motivate clinicians and managers across a complex service. Many of the ingredients listed require attention to be given to beliefs and behaviours, as well as alongside the evidence and skills to implement change. Without these, the injection of resources (5) may not be effective.
The remainder of this discussion presents a set of cancer-specific recommendations relating to the title of this report, Unfinished Business: An assessment of the national approach to improving cancer services in England 1995–2015. In October 2018, the Prime Minister announced that a new cancer strategy would form part of the NHS Long Term Plan. Drawing attention once more to the lagging survival rates for cancer in England compared with other countries, Theresa May set out an ambition to increase the proportion of patients diagnosed at early stage from one in two to three in four by 2028. This should help to eliminate the gap in survival rates between England/UK and other comparable countries. The Prime Minister spoke about reducing the age for starting bowel screening to 50 years and investing in scanners and rapid diagnostic centres.
This is the same ambition that was set nearly 20 years ago, and will be especially challenging, as the proportion of patients being diagnosed at early stage has remained almost static between 2015 and 2017.
Whole system change will be needed. We know that patients in the UK are uniquely worried about bothering their GP; GPs in the UK are much less likely to investigate or refer patients than those in comparable countries and hospitals are feeling swamped by current levels of referrals (and are failing to achieve the 62-day standard).
Actions
- Bowel screening: The change to Faecal Immunochemical Test (FIT) testing should lead to increased participation rates but this needs to be accelerated. Endoscopy capacity also needs to be increased considerably. This could be done by increasing the non-medical endoscopy workforce. Current endoscopy capacity could also be released by introducing FIT testing in primary care for patients with low-risk colorectal symptoms. This has recently been shown to be safe and effective in a paper from Denmark, published in the British Journal of Cancer. However, it will require a major shift in primary care practice. Lowering the age of first bowel screening to 50 (as per the Prime Minister’s conference commitment) will improve outcomes, but will require further expansion of capacity.
- Early detection of lung cancer : The recently announced results of the NELSON trial are very encouraging, showing a 26% reduction in lung cancer mortality among men at high risk of lung cancer who underwent serial low-dose CT scans. Importantly, the proportion of patients who were diagnosed with operable (early stage) disease increased to 67%. We need to ensure that the findings from these studies are translated to benefits for patients as soon as possible.
- NICE Guideline implementation: NICE Guideline 12 should be fully implemented. This guideline recommends that GPs should investigate patients who have symptoms which indicate a 3% or higher risk of cancer. However, these guidelines have not yet been fully implemented and efforts are being made to increase GP awareness. Some, but not all, CCGs have changed their referral templates to comply with the guidelines and tools are being developed to assist GPs in assessing levels of risk. Much more work will be needed to change GP practice (and raise public awareness about symptoms of possible cancer).
- Rapid diagnosis centres: The government should be ready to act quickly to spread learning from the Accelerate, Coordinate, Evaluate (ACE) Programme (run by Cancer Research UK), as evidence emerges of benefit to patients with non-specific symptoms. Although a primary aim would be to diagnose cancer earlier, these centres would also facilitate earlier diagnosis of other significant conditions. These could (and possibly should) be located outside acute hospitals for convenience for patients, and so that diagnostic facilities are not competing with those needed for emergency care pathways.
- 62-day standard: It will be important to continue to measure the timeliness of investigations and treatment within hospitals, though modifications of the 62-day standard should be considered as new pathways evolve.
- Diagnostic workforce and equipment: More patients will undoubtedly need to be investigated. This will require more CT, MRI and endoscopy facilities and an increase in the associated diagnostic workforce. Changes in skill mix need urgent consideration, as does exploring the potential of outsourced reporting (if necessary to other countries) and artificial intelligence (AI).
- Prevention and personalised care: The push for earlier diagnosis should not be at the expense of investment in prevention (which will require reversing cuts to public health budgets as well as cross-government effort on the causes of obesity, smoking and excess alcohol consumption) or further progress in supporting cancer survivors after treatment. Success in early diagnosis will mean more people living after cancer: enabling their wellbeing and health is crucial.
- Funding and accountability: Decisions will be needed on where accountability lies for earlier diagnosis (and thus improved survival) as this will require concerted efforts from public health, primary and secondary care. Integrated care systems might be given responsibility for this, but whichever bodies are funded (whether cancer alliances, sustainability and transformation partnerships or integrated care systems) will need to produce credible plans and have progress transparently monitored.
-
Monitoring: Key metrics will include:
- uptake of screening (especially bowel) and outcomes
- uptake of ‘case finding’ for lung cancer and outcomes
- GP awareness and compliance with NICE Guideline 12
- referrals to diagnostic centres and conversion rates
- stage at diagnosis (by cancer site and age)
- 1- and 5-year survival
- emergency presentations
- 2-week wait, and 62-day standard compliance (or modifications)
- reduction in unwarranted variation of any of the above.
- Progress reports: Public Health England’s National Cancer Registration and Analysis Service (NCRAS) should be charged with producing regular (monthly or quarterly) reports on progress, both nationally and locally.
- Attitudinal change: Perhaps the greatest challenge will be making these changes work with the grain of the current NHS gatekeeping model. This will require: giving the public faster and easier access to primary care and/or diagnostic services and encouraging them to present earlier when they have symptoms; encouraging GPs to lower their thresholds for investigating and referring patients; ensuring that commissioners do not block referrals and that hospital clinicians and managers welcome, rather than discourage, referrals (subject to reducing current capacity restraints). All of this will require building support for the changes across the NHS as well as providing the necessary funding. Some of this funding will need to be used for building capability and supporting cancer alliances to work with other local NHS partners to improve services.
Conclusion
If there is one overriding insight from this review of the National Cancer Programme over the past 20 years it is complexity, not just of the disease and growing treatment options, but the intrinsic complexity of driving change across many different professional groups and organisations, all of them subject to multiple, competing demands from other parts of the health system. Any condition-specific improvement effort needs to be constructed with this complexity in mind, with a realistic grasp of what it takes to generate momentum and support professionals and patients to make lasting change.
I think it is so easy to lose sight of the absolute requirement to be grindingly relentless about delivering improvements in outcomes for patients and those at risk of cancer. It takes decades to bring about lasting change. Any step forward you make, you’ve got to defend rigorously. Then further steps forward have to be made carefully based on what has worked. You cannot afford to slip back. In an inevitably changing political and economic environment, you will slip back easily. If you want to create something that transcends political power, then your ideas and commitment, professional power and patient power are the resources you’ve got.
Peter Selby, Professor of Cancer Medicine, University of Leeds
Appendix: List of interviewees
Nick Adkin – Former Head of Tobacco Programme, Department of Health
Jane Allberry – Former Deputy Director, Department of Health
Mr Bill Allum – Consultant Upper Gatrointestinal surgeon, Royal Marsden NHS Foundation Trust
Deborah Alsina – Chief Executive, Bowel Cancer UK
Prof Mark Baker – Former Cancer Network Director, Yorkshire
John Baron MP – Chair of APPG on cancer, 2009–2018
Charlotte Beardmore – Director of Professional Policy, Society of Radiographers
Mike Birtwistle – Former adviser to the National Cancer Programme
Tony Blair – Former Prime Minister
Heather Blake – Director of Support and Influencing, Prostate Cancer UK
Juliet Bouverie – Chief Executive, Stroke Association
Ruth Bridgeman – Former National Programme Director, National Cancer Peer Review Programme
Gordon Brown – Former Chancellor of the Exchequer and subsequent Prime Minister
Dr Helen Campbell – Portfolio Manager for Department of Health and Social Care Research Networks, Cancer Research, and Clinical Research Facilities
Chris Carrigan – Former Head of the National Cancer Intelligence Network
Prof Peter Clark – Chair NHS England Chemotherapy Clinical Reference Group
Prof Michel Coleman – Professor of Epidemiology and Vital Statistics, London School of Hygiene & Tropical Medicine
Dr Adrian Crellin – Consultant Clinical Oncologist, Leeds
Angela Culhane – Chief Executive, Prostate Cancer UK
Prof Erika Denton – Consultant Radiologist, Norfolk and Norwich University Hospitals, and National Clinical Director for Diagnostics, NHS England
Prof Stephen Duffy – Professor of Cancer Epidemiology, Prevention and Screening, Queen Mary University of London
Prof Sean Duffy – Former National Clinical Director
Prof Tim Elliott – Professor of Immunology, University of Southampton
Mr Paul Finan – Professor of Colorectal Surgery, University of Leeds
Prof Adam Glaser – Professor of Paediatric Oncology, University of Leeds
Emma Greenwood – Director of Policy and Public Affairs, Cancer Research UK
Prof Willie Hamilton – Professor of Primary Care Diagnostics, University of Exeter
Prof Bob Haward – Professor of Cancer Studies, University of Leeds
Nigel Hawkes – Health Editor, The Times, 2000–2008
Sara Hiom – Director of Early Diagnosis and Cancer Intelligence, Cancer Research UK
Jeremy Hughes – Former Chief Executive, Breakthrough Breast Cancer
Sir Harpal Kumar – Former Chief Executive, Cancer Research UK
Julie Lees – Deputy Director of the Transforming Cancer Services Team in London
Miss Fiona MacNeill – Consultant Breast Surgeon, Royal Marsden NHS Foundation Trust
Prof Jane Maher – Joint Chief Medical Officer, Macmillan Cancer Support
Prof Sir Alex Markham – Professor of Medicine, University of Leeds, and former Chief Executive, Cancer Research UK
Jeremy Laurance – Former Health Editor, The Independent
Jane Lyons – Chief Executive, Cancer52
Prof Yoryos Lyratzopoulos – Professor of Cancer Epidemiology, University College London
Prof Anne Mackie – Director of Programmes for the UK National Screening Committee
Dr Kathy McLean – Executive Medical Director and Chief Operating Officer, NHS Improvement
Andy McMeeking – Former Associate Director, National Cancer Action Team
Baroness Delyth Morgan – Chief Executive, Breast Cancer Now
Prof Eva Morris – Professor of Cancer Epidemiology, University of Leeds
Teresa Moss – Former Director, National Cancer Action Team
Cally Palmer – National Cancer Director
Stephen Parsons – Former Director, National Cancer Action Team
Julietta Patnick – Former Director of National Screening Programmes
Prof Heather Payne – Consultant Clinical Oncologist, University College Hospital, London
Hilary Plant – Joint Clinical Lead for Supportive Cancer Care and Head of the Macmillan Support and Information Centre at University College London Hospitals
Prof Mick Peake – Professor of Respiratory Medicine and former Cancer Services Collaborative Lung Cancer Lead
Prof Phil Quirke – Professor of Pathology, University of Leeds
Prof Amanda Ramirez – Emeritus Professor of Liaison Psychiatry and Psycho–Oncology, King’s College, London
Nick Robinson – Presenter, Today Programme; Former Political Editor, BBC
Joanne Rule – Former Chief Executive, Cancerbackup
Prof David Sebag–Montefiore – Professor of Clinical Oncology and Health Research, University of Leeds
Duncan Selbie – Chief Executive, Public Health England
Prof Peter Selby – Professor of Cancer Medicine, University of Leeds
Amanda Shewbridge – Macmillan Nurse Programme Lead for Living With and Beyond Cancer for the South East London Accountable Care Network
Prof Karol Sikora – Former Professor of Clinical Oncology, Hammersmith Hospital
Lord Chris Smith – Former Shadow Secretary of State for Health
Chris Smyth – Health Editor, The Times
Nick Timmins – Journalist
Dr Fiona Walter – Reader in Primary Care Cancer Research, University of Cambridge
Lindsay Wilkinson – Former Head of Cancer and End of Life Care Policy, Department of Health and former Head of Healthcare, Macmillan Cancer Support
Janet Williamson – Former Director, Cancer Services Collaborative
Fran Woodard – Executive Director of Policy and Impact, Macmillan Cancer Support
Sarah Woolnough – Executive Director of Policy and Information, Cancer Research UK
References
- Juul JS, Hornung N, Andersen B, Laurberg S, Olesen F, Vedsted P. The value of using the faecal immunochemical test in general practice on patients presenting with non-alarm symptoms of colorectal cancer. Br J Cancer 2018;119(4):471.
- Hansard. Cancer Treatment: written answers. Hansard: 1999 (https://api.parliament.uk/historic-hansard/written-answers/1999/may/20/cancer-treatment).
- Steimle S. UK’s Tony Blair announces crusade to fight cancer. J Natl Cancer Inst. 1999; 91(14): 1184–5.
- Department of Health. The NHS Cancer Plan. The Stationery Office Ltd: 2000.
- Allemani C, Matsuda T, Di Carlo V et al. Global surveillance of trends in cancer survival 2000–14 (CONCORD-3): analysis of individual records for 37,513,025 patients diagnosed with one of 18 cancers from 322 population-based registries in 71 countries. The Lancet. 2018; 391(10125): 1023–75.
- Department of Health. A Policy Framework for Commissioning Cancer Services: A Report by the Expert Advisory Group on Cancer to the Chief Medical Offices of England and Wales: Guidance for Purchases and Providers on Cancer Series. Department of Health: 1995.
- Department of Health. Smoking kills: A white paper on tobacco. The Stationery Office: 1998.
- Department of Health. Saving Lives: Our Healthier Nation. The Stationery Office: 1999.
- Berrino FCR, Esteve J, Gatta G et al. Survival of Cancer Patients in Europe: The EUROCARE-2 Study. IARC Scientific Publication No 151: 1999.
- BBC. Cancer surgery postponed four times. BBC News. 11 January 2000. (http://news.bbc.co.uk/1/hi/health/598555.stm).
- Timmins N. The Five Giants: A Biography of the Welfare State 3rd Edition ed. London William Collins 2017.
- National Audit Office (NAO). Tackling cancer in England: Saving more lives. 2004.
- NAO. Tackling Cancer: Improving the patient journey. 2005.
- NAO. The NHS Cancer Plan: A Progress Report. 2005.
- Department of Health. Waiting times for cancer. Progress, lessons learned and next steps. 2006.
- Department of Health. Cancer Reform Strategy 2007.
- Abdel-Rahman M, Stockton D, Rachet B et al. What if cancer survival in Britain were the same as in Europe: how many deaths are avoidable? Br J Cancer. 2009; 101(S2): S115.
- Department of Health. Improving Outcomes: A Strategy for Cancer. Department of Health: 2011.
- NAO. Progress in improving cancer services and outcomes in England. 2015.
- NHS England. Five Year Forward View. 2014.
- NHS England. Achieving world-class cancer outcomes: a strategy for England 2015–2020. 2015.
- NHS England Board Paper: Cancer Programme Update (www.england.nhs.uk/wp-content/uploads/2018/09/04-pb-26-09-2018-cancer-programme.pdf).
- Office for National Statistics (ONS). Cancer registration statistics, England, 2016. 2018. (www.ons.gov.uk/peoplepopulationandcommunity/healthandsocialcare/conditionsanddiseases/bulletins/cancerregistrationstatisticsengland/final2016).
- Public Health England. Chapter 2: Major causes of death and how they have changed. In Health profile for England: 2017. 2017.
- Cancer Research UK. Cancer survival statistics. (www.cancerresearchuk.org/health-professional/cancer-statistics/survival#heading-Zero).
- Exarchakou A, Rachet B, Belot A et al. Impact of national cancer policies on cancer survival trends and socioeconomic inequalities in England, 1996–2013: population based study. BMJ. 2018; 360: k764.
- Islami F, Goding Sauer A, Miller KD et al. Proportion and number of cancer cases and deaths attributable to potentially modifiable risk factors in the United States. CA Cancer J Clin. 2018; 68(1): 31–54.
- NHS Digital. Health Survey for England, Adult Health Trends 2016. 2016. (https://files.digital.nhs.uk/publication/m/0/hse2016-adult-trends.pdf).
- Cancer Research UK. Tobacco statistics (www.cancerresearchuk.org/health-professional/cancer-statistics/risk/tobacco#heading-Three).
- Doll R, Hill A. Smoking and carcinoma of the lung. BMJ. 1950; 2(4682): 739.
- Finch DB, Bibby J, Elwell-Sutton T. Taking our health for granted. The Health Foundation: 2018 (www.health.org.uk/taking-our-health-for-granted).
- NHS Digital. Statistics on Smoking England 2018. 2018. (https://files.digital.nhs.uk/0C/95F481/stat-smok-eng-2018-rep.pdf).
- Department of Health. Towards a Smokefree Generation: A Tobacco Control Plan for England. 2017.
- Brown KF, Rumgay H, Dunlop C et al. The fraction of cancer attributable to modifiable risk factors in England, Wales, Scotland, Northern Ireland, and the United Kingdom in 2015. Br J Cancer. 2018; 118(8): 1130.
- Bhaskaran K, Douglas I, Forbes H et al. Body-mass index and risk of 22 specific cancers: a population-based cohort study of 5.24 million UK adults. The Lancet. 2014; 384(9945): 755–65.
- Cancer Research UK. Obesity and cancer: Information for Health Professionals. (www.cancerresearchuk.org/health-professional/awareness-and-prevention/obesity-and-cancer-information-for-health-professionals).
- NHS Digital. Health Survey for England 2016. 2017. (https://digital.nhs.uk/data-and-information/publications/statistical/health-survey-for-england/health-survey-for-england-2016).
- UK Health Forum. Tipping the scales: Why preventing obesity makes economic sense. 2016.
- National Cancer Registration and Analysis Service (NCRAS). Routes to Diagnosis. (www.ncin.org.uk/publications/routes_to_diagnosis).
- NHS Breast Screening Programme. AgeX Trial. (www.agex.uk).
- Public Health England. Annual HPV vaccine coverage 2016 to 2017: by local authority, local team and area team. 2017. (www.gov.uk/government/statistics/annual-hpv-vaccine-coverage-2016-to-2017-by-local-authority-local-team-and-area-team).
- Lancucki L, Sasieni P, Patnick J et al. The impact of Jade Goody’s diagnosis and death on the NHS Cervical Screening Programme. J Med Screen. 2012; 19(2): 89–93.
- NHS Digital. Cervical Screening Programme, England 2011–12. 2012. (https://digital.nhs.uk/data-and-information/publications/statistical/cervical-screening-programme/cervical-screening-programme-england-2011-2012).
- Landy R, Pesola F, Castañón A et al. Impact of cervical screening on cervical cancer mortality: estimation using stage-specific results from a nested case–control study. Br J Cancer. 2016; 115(9): 1140.
- Peto J, Gilham C, Fletcher O, Matthews FE. The cervical cancer epidemic that screening has prevented in the UK. The Lancet. 2004; 364(9430): 249–56.
- Cancer Research UK. Bowel cancer statistics. (www.cancerresearchuk.org/health-professional/cancer-statistics/statistics-by-cancer-type/bowel-cancer).
- Public Health England. NHS Screening Programmes in England. 2017.
- Atkin WS, Edwards R, Kralj-Hans I et al. Once-only flexible sigmoidoscopy screening in prevention of colorectal cancer: a multicentre randomised controlled trial. The Lancet. 2010; 375(9726): 1624–33.
- Richards M, Westcombe A, Love S et al. Influence of delay on survival in patients with breast cancer: a systematic review. The Lancet. 1999; 353(9159): 1119–26.
- Ramirez A, Westcombe A, Burgess C et al. Factors predicting delayed presentation of symptomatic breast cancer: a systematic review. The Lancet. 1999; 353(9159): 1127–31.
- Robb K, Stubbings S, Ramirez A et al. Public awareness of cancer in Britain: a population-based survey of adults. Br J Cancer. 2009; 101(S2): S18.
- Power E, Connor K and Crawford C (Cancer Intelligence Team). Cancer Awareness Measure 2017. Cancer Research UK: 2017. (www.cancerresearchuk.org/sites/default/files/cam_2017_key_findings_201808.pdf).
- Forbes L, Simon A, Warburton F et al. Differences in cancer awareness and beliefs between Australia, Canada, Denmark, Norway, Sweden and the UK (the International Cancer Benchmarking Partnership): do they contribute to differences in cancer survival? Br J Cancer. 2013; 108(2): 292.
- Public Health England. Be Clear on Cancer campaign resources. (https://campaignresources.phegov.uk/resources/campaigns/16-be-clear-on-cancer/resources).
- Spurgeon P, Barwell F, Kerr D. Waiting times for cancer patients in England after general practitioners’ referrals: retrospective national survey. BMJ. 2000; 320(7238): 838–9.
- NHS Digital (https://digital.nhs.uk/data-and-information/data-tools-and-services/data-services/general-practice-data-hub/workforce) for number of GPs in England (39,896 in March 2018) and CRUK for cancer incidence – comes to around 7.5 per GP.
- NICE. Suspected cancer: recognition and referral. NG12. 2015. (www.nice.org.uk/guidance/ng12).
- Banks J, Hollinghurst S, Bigwood L et al. Preferences for cancer investigation: a vignette-based study of primary-care attendees. The Lancet. 2014; 15(2): 232–40.
- Vedsted P, Olesen F. Are the serious problems in cancer survival partly rooted in gatekeeper principles? An ecologic study. Br J Gen Pract. 2011; 61(589): e508–e12.
- Rose PW, Rubin G, Perera-Salazar R et al. Explaining variation in cancer survival between 11 jurisdictions in the International Cancer Benchmarking Partnership: a primary care vignette survey. BMJ Open. 2015; 5(5): e007212.
- Swann R, McPhail S, Witt J et al. Diagnosing cancer in primary care: results from the National Cancer Diagnosis Audit. Br J Gen Pract. 2017: bjgp17X694169.
- Department of Health. Waiting times for cancer. Progress, lessons learned and next steps 2006.
- Commission for Health Improvement. National Service Framework Assessments No 1: NHS cancer care in England and Wales. 2001.
- Lewison G, Aggarwal A, Roe P, et al. UK newspaper reporting of the NHS cancer drugs fund, 2010 to 2015: a retrospective media analysis. J R Soc Med. 2018:0141076818796802.
- NCRAS. National Radiotherapy Data Set.
- National Radiotherapy Advisory Group. Radiotherapy: developing a world class service for England: Report to Ministers from National Radiotherapy Advisory Group. 2007. (http://webarchive.nationalarchives.gov.uk/20130124035706/www.dh.gov.uk/prod_consum_dh/groups/dh_digitalassets/@dh/@en/documents/digitalasset/dh_074576.pdf).
- All-Party Parliamentary Group for Radiotherapy. Manifesto for Radiotherapy: Improving cancer survival with a modern world-class radiotherapy service. 2018 (https://docs.wixstatic.com/ugd/4fcdc3_57c6bd1cdc254e388097fdba9ad566fd.pdf).
- NAO. Investigation into the Cancer Drugs Fund. Department of Health and NHS England: 2015. (www.nao.org.uk/wp-content/uploads/2015/09/Investigation-into-the-Cancer-Drugs-Fund1.pdf).
- Maddams J, Utley M, Møller HJ. Projections of cancer prevalence in the United Kingdom, 2010–2040. Br J Cancer. 2012; 107(7): 1195.
- Fallowfield L, Jenkins V, Farewell V et al. Efficacy of a Cancer Research UK communication skills training model for oncologists: a randomised controlled trial. The Lancet. 2002; 359(9307): 650–6.
- Commission for Health Improvement/Audit Commission report on cancer care. International Journal of Health Care Quality Assurance. 2002; 15(2/3): III.
- Breast Cancer Care. Secondary breast cancer: Part four: Nursing care. April 2017 (www.breastcancercare.org.uk/sites/default/files/secondary-nursing-report.pdf).
- Macmillan Cancer Support. Specialist adult cancer nurses in England: A census of the specialist adult cancer nursing workforce in the UK, 2014. 2014.
- Department of Health. The National Cancer Survivorship Initiative Vision. 2010.
- Downing A, Morris EJ, Corrigan N et al. High hospital research participation and improved colorectal cancer survival outcomes: a population-based study. Gut. 2017;66(1):89–96.
- NHS England. Annual report and accounts 2017–18. 2018.
- NAO. Progress in improving cancer services and outcomes in England 2015. 2015.
- Hansard. Cancer: Medical Treatments and Research: Written question – 151135. 2018.
- Conservative Party. The Next Moves Forward: Conservative Party Manifesto, 1987. 1987.(www.conservativemanifesto.com/1987/1987-conservative-manifesto.shtml).
- Labour Party. New Labour, New life for Britain: Labour Party Manifesto 1997. 1997.
- Molloy A, Martin S, Gardner T, Leatherman S. A clear road ahead. Health Foundation: 2016.
- Allcock C, Dormon F, Taunt R, Dixon J. Constructive comfort: accelerating change in the NHS. The Health Foundation: 2015. (www.health.org.uk/sites/health/files/ConstructiveComfortAccelerating ChangeInTheNHS.pdf).
- Horton T, Illingworth J., Warburton W. The Spread Challenge: How to support the successful uptake of innovations and improvements in health care. 2018.
- The Health Foundation. Effective networks for improvement: Developing and managing effective networks to support quality improvement in healthcare. 2014.
- Department of Health. High quality care for all: NHS next stage review final report. Stationery Office: 2008.