Key points
- £17.1bn was spent on public provision of adult social care in England in 2015/16 in net returns. Just under half of this (£8.2bn) was spent on services for people aged 65 and over.
- Real terms public spending was £1.1bn lower in 2015/16 than in 2009/10, with an average fall of 1% a year in real terms, despite there being almost a million more over people over 65. Spend per head has fallen from £349 to £313 in the same period - a fall of 1.8% per year.
- This has led to many local authorities changing their eligibility criteria so that only those with severe need are eligible for funding, compared with meeting high or moderate needs in some areas in 2009/10.
- There has been a freeze in the cash-terms level of the capital means test thresholds at £14,250 and £23,250, rather than increasing them in line with inflation.
- This is effectively a 12% real-terms decrease in the thresholds. In addition, lower payments to providers of care services, which has led to greater instability in the provider market.
- Social care is facing high growth in demand and cost pressures, which are projected to rise by around £12.2bn a year up to 2030/31, growing at an average rate of 3.7% a year. This is a combination of a growing and ageing population (the population over 75 in England is projected to double in the next 30 years), more people living longer with long-term conditions, and the rising costs of providing care services.
- The budget is unlikely to rise in line with pressures. We estimate a budget for social care using current plans to 2017/18, estimated spending powers for local authorities to 2019/20, and gross domestic product (GDP) growth to 2030/31. Under these assumptions we would see growth in social care spending of 2.1% a year. This would leave a funding gap of £1.5bn in 2020/21 and £6.1bn by 2030/31.
- This is based on maintaining the eligibility criteria at the level observed in 2015. Over 400,000 fewer older people accessed publicly funded social care in 2013/14 than in 2009/10 – a drop of 26%.
- Improving access under the current system to higher levels observed in 2009/10 would require additional funding; in 2017/18 £24.3bn would have been needed – 36% higher than the current plan of £17.9bn. To get back to this level in 2021/22 would require spending to rise to £27bn, and to £38.7bn by 2030/31.
Alternative models of funding
- In this programme of work, the Health Foundation and The King’s Fund have considered the implications of introducing changes to the way social care is funded in England. We have assessed the feasibility, costs and public opinion of alternative models, as set out in our previous working paper. In this report we build upon the working paper to model the costs associated with continuing the current system; introducing free personal care as exists in Scotland; or raising the means test for receiving publicly funded care (the ‘floor’) and introducing a cap on total lifetime costs, as proposed in the Conservative Party manifesto for the 2017 general election.
- For the cap and floor model, the total additional cost above current pressures would be around £4.0bn in 2020/21 (taking account of the reduced spending on domiciliary care). This figure would rise to £5.8bn by 2030/31. The overall funding gap would be £5.5bn in 2020/21 and £11.9bn in 2030/31.
- Introducing free personal care would cost an extra £5.5bn in 2020/21 and £7.9bn by 2030/31. This would increase the estimated funding gap to £7bn in 2020/21 and £14bn in 2030/31.
Raising funding
- The additional funding required for social care is large. There are several options to raised the funds in a sustainable way without cuts to other public services. For example, adding 1p to the main rate, higher rate and employers’ National Insurance contributions (NICs) by 2030/31 would raise enough to fund the introduction of the cap and floor model. If at the same time means testing was introduced to winter fuel payments, this could be enough to introduce free personal care. Alternatively, adding 2p to the basic, higher and top levels of income tax, or 3p to VAT, would provide more than enough to fund either the cap and floor or free personal care, and would be sufficient to improve access and quality close to the levels seen in 2009/10.
- An alternative approach is to only increase tax paid by those earning the highest incomes. Funding the current model in 2030/31 would require a 4p increase in the higher rate of income tax, or 7p in the top rate. Improving access back to levels seen in 2009/10 would need a 9p increase in the higher rate of income tax, or 18p in the top rate by 2030/31. Introducing the cap and floor model would require an extra 7p or 14p in the pound respectively. For free personal care, an extra 8p or 16p would be required.
- Older people are more likely to benefit from improvements in the model for public funding of social care, so some argue that they should bear the cost through changes in taxes and benefit. This could be done by extending NICs beyond retirement age, changing the eligibility for winter fuel payments or changing the ‘triple-lock’ protection for pensions. In a best-case scenario, where the maximum saving and revenue are realised, around £10bn could be raised through these initiatives by 2030/31. This may allow pressures under the current system to be met, but would not provide sufficient additional funding to fully meet either of the alternative models explored.
- Wealth taxes are generally regarded as a progressive option as the proportion of tax increases with total wealth. Options exist that could fund at least part of an improved social care system, such as changes to inheritance tax or adding a new council tax band. However, such measures can prove controversial as many people’s homes have risen dramatically in value while their incomes have not.
- It is likely that additional revenue will need to be raised for adult social care services even without a change in the model. The question for government is whether, given that additional tax revenue will be required to protect the range and quality of care services, it would be better to aim for a sufficiently large increase in taxation to be able to provide a better model of care to those facing the burden of the cost.
Table 0.1: Summary of cost of options for funding social care
|
Current system |
Reforms |
||||
|
Maintaining at 2015/16 levels |
Restoring to 2009/10 levels |
Cap and floor |
Free personal care |
||
|
2020/21 |
Total cost |
£21bn |
£27bn |
£25bn |
£26bn |
|
Increase from 2015/16 spend |
£4bn |
£10bn |
£8bn |
£9bn |
|
|
Additional cost above current system |
N/A |
£6bn |
£4bn |
£6bn |
|
|
Estimated budget |
£19bn |
||||
|
Funding gap |
£1.5bn |
£8bn |
£5bn |
£7bn |
|
|
2030/31 |
Total cost |
£29bn |
£39bn |
£35bn |
£37bn |
|
Increase from 2015/16 spend |
£12bn |
£22bn |
£18bn |
£20bn |
|
|
Additional cost above current system |
N/A |
£9bn |
£6bn |
£8bn |
|
|
Estimated budget |
£23bn |
||||
|
Funding gap |
£6bn |
£15bn |
£12bn |
£14bn |
|
Note: Figures do not sum due to rounding, specifically when comparing free personal care and cap and floor models. Figures are rounded for ease of reading and to reflect uncertainty in the estimates.
* Unless otherwise specified, all financial data in this report have been adjusted to 2018/19 prices, using HM Treasury GDP deflators – a whole economy measure of inflation as of March 2018. Figures for public spending on social care are net spending rather than total spending, as we exclude income to local authorities from client contributions.
Introduction
It is widely accepted in policy and political circles that the current model for public funding of adult social care needs urgent review. Fewer people are receiving publicly funded care despite a growing level of need, and there are serious concerns over the quality and stability of providers of care services.
Public funding for adult social care fell by 6% in England between 2009/10 and 2015/16 – an average of 1.0% a year. New funding was then announced in the 2015 Comprehensive Spending Review. This included a new precept that allowed councils to add 2% onto council tax to pay for social care services, which later raised to 3% for 2017/18 and 2018/19. Additional funding from central government was also provided through the Improved Better Care Fund (IBCF). Subsequent announcement later increased this, so that over £2bn of additional funding was available in 2017/18, rising to £3.6bn by 2019/20. As a result, public spending on adult social care is expected to rise by an average of 2.5% a year between 2015/16 and 2019/20.
But concerns go beyond the level of funding available, with the current model seen as overly complex and not fit for purpose. The previous and current governments committed to a green paper to look at the model through which adult care is funded – this is due to be published in 2018. It will need to address fundamental questions on the kind of system required, including its quality, coverage and eligibility of services; the balance of responsibility between the government and the individual; the level of public resource required; and how funding should be raised.
In this report we model the future pressures that the current system of publicly funded adult social care will face, then estimate the additional public cost of improving access under this system, and under two alternative systems set out in a previous working paper. We then provide options for funding the additional costs, above an assumed budget, through changes in the level of national and local taxes or benefits.
The report is underpinned by a programme of work by the Health Foundation and The King’s Fund on the wider implications of different models, and public views on the current and alternative approaches to social care funding. The objective of this work is not to put forward a recommendation, but to set out in detail a range of potential options to support those tasked with developing a new approach.
The current system
A person’s eligibility for public funding for adult social care is currently based on a needs test, which assesses their ability to perform certain tasks, and a means test, which assesses their ability to pay for their own care via income, savings or other assets.
The needs test
Historically the eligibility threshold for adult social care has been set by local authorities, depending on available funding, level of local need and local priorities. The Care Act 2014 introduced a national minimum eligibility threshold, intended to be similar to the level of ‘substantial’ need under the previous ‘fair access to care services’ criteria. This requires local authorities to provide support to those who, as a result of an impairment or illness, cannot achieve at least two outcomes in their daily life, resulting in an impact on their wellbeing. Local authorities can elect to provide care to people with a lower level of need. Assessments of need must be carried out by appropriately trained assessors.
The means test
The means test is set nationally for England. Those with assets below £14,250 who meet the needs test are eligible for publicly funded care. Those with assets over £23,250 must meet the full cost of their care, until the value of their assets falls below £23,250. Those whose assets are worth between £14,250 and £23,250 are expected to contribute £1 a week for every £250 of assets above £14,250.
The test is applied differently depending on the type of care received. If a person who owns their home requires care in a residential or nursing home, the value of their home is considered in the means test. However, if they are receiving domiciliary care (ie services in their own home) the value of their home is excluded from the means test.
If a person who is eligible for publicly funded care also receives an income, they are required to contribute their income towards the cost of their care, except for a specified level of income protection. A person receiving funded care in a home is entitled to a personal expenses allowance of at least £24.90 per week. A person receiving care in other settings is entitled to a Minimum Income Guarantee. Its level depends on a person’s circumstances, for example a single person older than 25 but not old enough to be eligible for pension credit (currently rising to 66) is entitled to keep at least £91.40 per week – over the age at which pension credit could be claimed this rises to at least £189.00 per week.
The case for change
The current system has its origins in the 1948 National Assistance Act, which legislated for the National Assistance Board and for local authorities to make provision for the welfare of ‘disabled, sick, aged and other persons’. The Act established a separation between care services and the NHS that remains today, although the boundaries of this split have shifted over time.
Since 1948 there have been huge changes to demographics in England, which have placed increasing pressure on the social care system. The nature of personal wealth has also changed. In 1961, 44% of properties were owned by the person living in them; by 2016 this had risen to 62%. This has resulted in far more people having assets above the thresholds of the means test. In the last 20 years, 12 separate government commissions have sought to reform the system of social care funding, but one have delivered major change.
Funding is falling in real terms, while demand is growing
Many of the current issues of access to and provision of services stem from a long period of real-terms cuts in public spending in the face of rising demand. Between 2009/10 and 2015/16, spending by local authorities on adult social care services in England fell by £1.1bn, at an average of 1.0% a year. Social care funding in England was at its highest point in real terms in 2009/10, at £349 per head of the population. In 2015/16 England spent £313 per head – a fall of 1.8% a year.
In part, these cuts were a result of holding the value of the means test in cash terms. The last increase was in 2010/11, when the lower capital limit rose from £14,000 to £14,250, and the upper limit increased from £23,000 to £23,250. It has not changed since then, so, accounting for inflation, the thresholds will be 12% lower in real terms in 2018/19 than they were in 2010/11.
Over 400,000 fewer people accessed publicly funded social care in 2013/14 than in 2009/10 – a drop of 26%. At the same time, the number of people requiring care rose, as people are living ever longer and the complexity of their needs has increased. The number of people aged 85 and over rose from 950,000 in 2001 to 1.3m in 2014, and is expected to rise to 2.1m by 2030. Equally, younger people with disabilities are also living longer: life expectancy for a person with Down’s syndrome has increased from 23 in 1983 to 60 in 2018.
Taking these trends into account, to continue to offer the same quality and quantity of social care support to everyone in need would require increases in real-terms spend per head of population. Arguably some of the fall in spending per head is due to the success of re-ablement initiatives; however, there is little evidence that local authorities that spend the most on short-term services have a corresponding decrease in spend on people requiring long-term care. Furthermore, spending on prevention and early intervention continues to fall according to social care directors.
Pressures on providers and local authorities
Pressures on providers have been so great that, in its 2016 annual report, the Care Quality Commission (CQC) warned that adult social care was ‘approaching a tipping point’. It highlighted growing concerns for the stability of the provider sector, with a growing number of providers handing back services to local authorities. These had become undeliverable due to rising costs, including the rising minimum wage, while funding pressures reduced the fees that local authorities were willing or able to pay. Concerns over the stability of the provider sector have continued, with 37% of councils reporting in 2017 that they had contracts handed back within the previous six months.
The funding pressures facing adult social care were acknowledged in the 2015 Comprehensive Spending Review, and in subsequent government announcements. Additional funding was made available through a national IBCF and with the introduction of the council tax precept. This provided some breathing space for councils, many of which would otherwise have come close to financial collapse in 2017 according to the Association of Directors of Adult Social Services (ADASS). However, even with the new funding, spending is still expected to lag behind rising demand and cost pressures, with the system facing an estimated funding gap of £1.5bn by the end of the decade.
But the level of funding is not the only concern for the way social care is publicly funded. Prior to 2010 public funding for care services was rising. Spending increased by an average of 0.9% a year between 2004/05 and 2009/10 in real terms, yet there were still serious concerns over the model through which services were funded. Since 1997 there have been 12 government white papers, green papers and other consultations and five independent reviews of social care funding.
There is no protection against huge personal costs of care
A major concern with the current model is that public funding is only available to people with very modest means. The level of the means test has not changed in cash terms since 2010/11, so will be 12% lower in 2018/19 in real terms. The cost of care is therefore increasingly falling on individuals and families, who face the risk of losing almost all their savings and assets to pay for their social care in older age.
The current system offers no protection to people against catastrophic lifetime costs, despite an estimated one in 10 older people facing care costs of more than £100,000 over their lifetime. There is also no private insurance market to allow people to protect themselves against this potential cost. This is in part because predicting potential high cost is difficult with the data available, thus discouraging private companies from offering policies at an affordable level. Part of the rationale for introducing a cap on lifetime private spending in the Care Act 2014 was to provide a maximum liability to insurers to enable them to offer affordable policies, which would help people to protect themselves against potentially high care costs.
The system is very complex
Other concerns surround the complexity of the system. Many people do not understand what is available to them, or believe that care is fully provided by the state on the same model as the NHS. There are also concerns around equity of access, with historical differences between the level and quality of service provided by different local authorities.
Additionally, reductions in public funding have led to higher fees for self-payers to cover the costs of people funded by local authorities.,
† Unless otherwise specified, all financial data in this report have been adjusted to 2018/19 prices, using HM Treasury gross domestic product (GDP) deflators – a whole economy measure of inflation as of March 2018. Figures for public spending on social care are net spending rather than total spending, as we exclude income to local authorities from client contributions.
‡ These include activities such as eating, bathing, showering, dressing and toilet hygiene.
§ Local authorities may choose to set a higher level for the personal expenses allowance, but it cannot be lower than this.
¶ For more information see the Health Foundation (2018). Approaches to social care funding. Available at: www.health.org.uk/sites/health/files/Approaches-social-care-funding_1.pdf
** Short, intensive treatment, usually delivered in a person’s home following illness or injury to reduce the need for long-term care.
†† These updated projections for pressures are lower than previously reported (see: http://www.pssru.ac.uk/pub/DP2900.pdf), and those used in our previous reports (see: http://www.health.org.uk/publication/autumn-budget). This reflects a number of changing including fewer people currently receiving services, lower estimate population growth, and lower projected growth in national wealth (measured using GDP). See accompanying report Social care funding options: How much will they cost? for more information.
Current funding pressures
Total net public spending on adult social care was £17.1bn in 2015/16, in 2018/19 prices. Of this, around half was spent on adults of working age – those aged 18–64. The remainder, worth an estimated £7.7bn, was spent providing services to people aged 65 and over. Of this, £2.7bn was spent on providing domiciliary care for 248,385 people, at an average annual cost of £10,898 per user. And £3.4bn of funding was used to provide residential care for 156,840 people, at an average annual cost of £21,664 per user. The remaining £1.5bn was used to cover the cost of other activities including commissioning services, and for providing means and eligibility assessments.
Services are provided by an estimated 20,300 organisations, delivering care from around 40,400 establishments. The majority are in the private or not-for-profit sectors. Some of this care is paid for through private arrangements and some is commissioned and arranged by local authorities. As a result, comprehensive national data on all social care activity and funding are limited.
Researchers at the Personal Social Services Research Unit (PSSRU) have developed a cohort-based microsimulation model to project future social care activity and costs based on data that are available. This model is considered state of the art in analysis of English social care and is widely used in this area of research. The PSSRU model estimates that cost and demand pressures for publicly funded adult social care will rise by an average of 3.7% a year in real terms between 2015 and 2030. This is slightly lower for younger adults, at 3.6% a year, compared with 3.7% a year for people aged 65 and over.
These projections are lower than previously reported, and lower than those used in previous reports from the Health Foundation and The King’s Fund. This reflects a number of changes including fewer people receiving services, lower estimated population growth, and lower projected growth in national wealth (measured using gross domestic product – GDP).
A recent clarification of the law means that staff must be paid at least minimum wage during sleep-in shifts, which is not included in the PSSRU modelling. The calculations in this report account for this by including an additional cost in back pay of £400m in 2017/18, and an additional £100m cost pressure in future years.
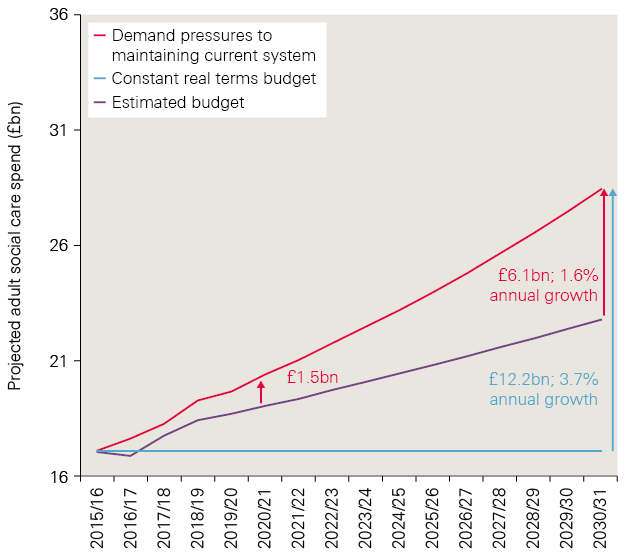
Including these, total demand and cost pressures are estimated to rise by an average of 3.7% a year, from £17.1bn in 2015/16 to £29.3bn in 2030/31. This is an increase of £12.2bn – around three-quarters of the current budget (see Figure 1).
Box 1
The PSSRU has created a model of adult social care activity and funding based on the current system in England. Using this, it projects total spending on both young adults and older people in need of publicly funded social care. This model has been used by the Department of Health and the Office of Budget Responsibility (OBR) to inform policy in the area.
Importantly, the PSSRU’s model is a projection of the current system under the latest available data and does not make specific forecasts about the future. The projections indicate the costs of the system based on the specific assumptions and trends in population and activity presented below:
- The growth in population by age and gender changes in line with Office for National Statistics (ONS) 2016-based principal population projections.
- Real GDP rises in line with OBR projections. Unit costs of care also increase as per OBR assumptions of productivity and marital status rates change in line with the Government Actuary’s Department 2008-based marital status and cohabitation projections, except that they remain constant for people with learning difficulties.
- There is a constant ratio of single people living alone to single people living with their children or with others, and of married people living only with a partner to married people living with partner and others.
- Prevalence rates of disability in old age and learning difficulties remain unchanged by age group.
- Home-ownership rates and the proportion of older people receiving privately funded care change in line with projections produced by the University of East Anglia CARESIM model (a microsimulation model of finances for the over 65 year olds).
- The proportions of people receiving informal care, formal community care services, residential care services and disability benefits remain constant for each sub-group by age, disability and other needs-related characteristics.
- The proportion of the costs of publicly funded care met by older service users through user charges also changes in line with projections from the CARESIM model.
- The supply of formal care will adjust to match demand and demand will be no more constrained by supply in the future than in the base year.
- PSSRU do not assume any productivity gains in their projection modelling.
- Staff pay is assumed to rise in line with OBR projections for rises in average earnings.
The estimated budget
There is not a nationally set budget for social care in England. Instead, spending is determined by each local authority, based on the size of their total budget and decisions on how much to allocate to social care versus the other public services they provide. There are currently some restrictions to this. Recognising the scale of the financial pressure on social care, the government has made additional central funding available to be spent on social care services through the IBCF. It also introduced a new social care precept for council tax, which means that councils could increase council tax by an additional 2–3% alongside normal increases, provided the money raised was spent on providing social care services. This meant that an additional £2bn was available for social care services in 2017/18, rising to £3.6bn by 2019/20. The actual and expected adult social care budget, and the IBCF and council tax precept are presented in Table 1.
Table 1: Actual and expected adult social care budget breakdown 2015/16 to 2019/20
|
Actual |
Expected |
||||
|
2015/16 |
2016/17 |
2017/18 |
2018/19 |
2019/20 |
|
|
Budget for social care excluding IBCF and precept |
£15.2bn ££15.2bn £14.4bn £13.8bn £13.5bn £13.3bn |
£14.4bn |
£13.8bn |
£13.5bn |
£13.3bn |
|
Additional funding through IBCF and precept |
£0bn |
£0.4bn |
£2.1bn |
£3.2bn |
£3.6bn |
|
Adult social care funding incl. IBCF and precept |
£15.2bn |
£14.9bn |
£15.9bn |
£16.6bn |
£16.9bn |
|
NHS health transfer budget |
£1.9bn |
£2.1bn |
£2.0bn |
£2bn |
£2bn |
|
Total adult social care budget |
£17.1bn |
£16.9bn |
£17.9bn |
£18.6bn |
£18.9bn |
Between 2015/16 and 2016/17 public funding by councils for social care fell by 2.2%, from £15.2bn to £14.9bn. The latest plans show that spending for 2017/18 is expected to increase by 6.6% compared with 2016/17, to £15.9bn – this includes the additional £2bn described above. A further £2bn is also transferred from the NHS budget.
Estimating the budget beyond 2017/18
There are no official figures for social care spending beyond 2017/18, so we have estimated the funding that may be available. For 2018/19 and 2019/20 there are published estimates for the core spending power that will be available to local authorities, from which adult social care spending is allocated. This has been used to estimate the likely growth in funding for social care over the same period. This also assumes that the transfer from the NHS budget remains constant in real terms.
This core spending power includes the funding available from the social care precept and through the IBCF. As this must be spent on adult social care, it has been subtracted from the core spending power estimates, with the remainder being the amount that local authorities can choose to allocate to social care or other services. This remaining core spending is expected to fall by 2.5% in 2018/19, and by 1.1% in 2019/20. With no other information, we based our calculations on the assumption that social care spending excluding the precept and IBCF would fall by the same amount – from £13.8bn in 2017/18 to £13.3bn by 2019/20. The combined value of the precept and IBCF – worth £3.6bn in 2019/20 – is then added back on to this figure, resulting in a total spend of £16.9bn in 2019/20. Again, the additional £2bn from the NHS transfer is included, based on the assumption that it stays constant in real terms.
The budget is therefore estimated to rise by 4.5% in 2018/19 and by 1.8% in 2019/20. This would be an average increase of 2.5% a year between 2015/16 and 2019/20 in real terms, making a total of £18.9bn.
With no official estimates for social care or council core spending power beyond 2019/20, we have adopted the same approach as the OBR – to assume that total government spending, and therefore spending on social care – will rise in line with GDP growth. This provides a reasonable estimate for the funding that might be available for care services, but the true funding gap would clearly be heavily dependent on the actual outturn. The most recent estimate for GDP growth between 2019/20 and 2030/31 is 1.9% a year in real terms, which would see total spending rising by an average of 2.1% a year between 2015/16 and 2030/31, from £17.1bn to £23.3bn. This would be a slower rate of growth than the 2.5% estimated for between 2015/16 and 2019/20, but greater than the fall of 1.0% a year between 2009/10 and 2015/16.
Funding gap
With pressures expected to rise at an average of 3.7% a year, spending on services would need to rise by a total of £3.6bn between 2015/16 and 2020/21, and by £12.2bn by 2030/31. However, if the budget grows by 2.1%, as assumed in our calculations, this would leave a gap of around £1.5bn in 2020/21, rising to £6.1bn by 2030/31. Therefore, even maintaining quality and access via the model of public funding as it was in 2015/16 would need public funding for social care to rise faster than the growth in national wealth (as measured by GDP).
Figure 1: Adult social care funding pressures, 2015/16 to 2030/31
Scope for improvements in access and quality
The PSSRU projections are based on the system of care provided in 2015/16. So closing this funding gap would mean that the system is able to keep pace with growing pressures from rising costs demand and demand from this point. However, it does not allow for any improvements in the level of access to publicly funded care, or the quality of care that people receive.
However, there is a significant question over whether continuing at this level of care provision is publicly acceptable. Recent budget pressures mean that public funding for adult social care has fallen by 6% between 2009/10 and 2015/16, at an average of 1.0% a year. This has led to:
- many local authorities changing their eligibility criteria so that only those with severe need are eligible for funding, compared with meeting high or moderate needs in some areas in 2009/10
- a freeze in the cash-terms level of the capital means test thresholds at £14,250 and £23,250, rather than increasing them in line with inflation. This is effectively a 12% real-terms decrease in the thresholds
- lower payments to providers of care services, which has led to greater instability in the provider market.
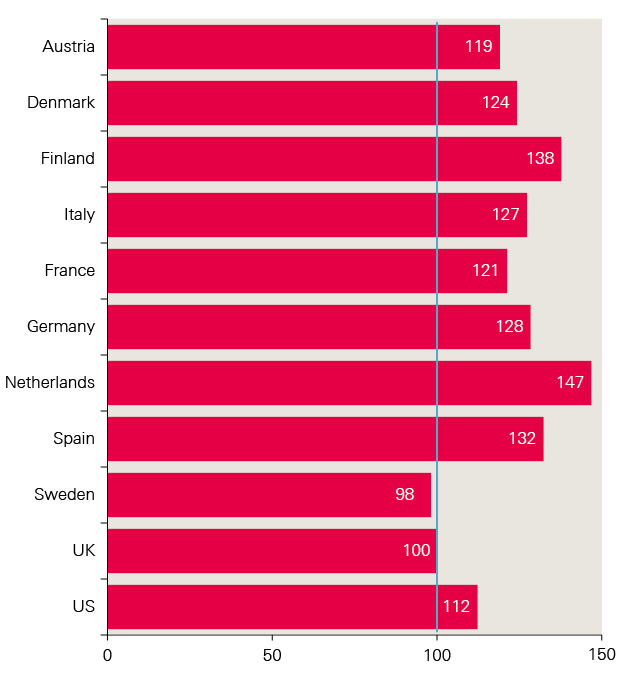
There may be some scope for reducing pressures through improvement to the productivity of service delivery. Our estimates are based on a model which assumes no growth in productivity over the 15 years modelled, which is consistent with estimates for observed productivity from the ONS. However, there may be scope for improvement. Recent research from the National Institute of Economic and Social Research, published by the Joseph Rowntree Foundation, estimates that productivity among providers of social care in the UK is lower than in nine out of 10 comparison countries (Figure 2).
Figure 2: Relative productivity levels for social care in 2015, UK=100
While improving productivity is desirable and would reduce long-term cost estimates of funding need, it would likely require substantial upfront investment in new models of delivering care. The level of potential growth in productivity is likely to allow for only marginal improvements in access and quality. With major concerns commonly raised over the current stability of the provider sector,, it is likely any productivity growth would only support market stabilisation. Service users would therefore not see an improvement in quality – they would just not see any further decline.
Major improvements to access and quality
There is a strong argument that continuing to meet these pressures will still leave a high level of unmet need, and risk a collapse of the provider sector. Even if the model of funding is not to be changed, additional funding is likely to be required over and above our estimates to return to the level of access and quality provided in 2009/10.
To estimate the additional cost of returning to the previous level of quality, we have applied the 3.7% average growth in projected cost pressures from 2009/10, to provide an estimate for what the budget would have been if these pressures had been met through the current decade and out to 2030/31.
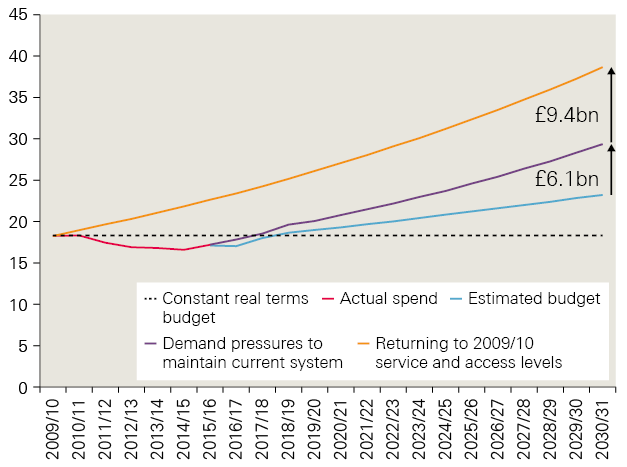
In this case, funding in 2017/18 would have been £24.3bn – 36% higher than the current plan of £17.9bn. To get back to this level in 2021/22 would require spending to rise to £27bn, and to £38.7bn by 2030/31. Based on the current plan, this would increase the estimated funding gap from £1.5bn to £7.8bn in 2020/21, and from £6.1bn to £15.4bn in 2030/31.
Figure 3: Estimated additional cost of providing the same level of service as in 2009/10, 2009/10–2030/31 (2018/19 prices)
In reality, there has been a range of improvements in how services are provided, in order to protect provision and quality as much as possible with falling budgets. Maintaining these improvements would clearly be desirable if additional funding is available, and doing so with a return to previous levels of funding may see service quality rise beyond the levels seen in 2009/10.
While funding at this higher level would undoubtedly lead to improvements for people who are eligible for care, it would not address the substantive concerns over the adequacy of the current model, which pre-date the current period of austerity. The alternative options for social care funding are explored in the following chapters.
‡‡ This is taken from NHS Digital analysis, which has a slightly higher figure for public spending on over 65 year olds of £8.2bn compared to figures quoted in Public Expenditure Statistical Analysis (PESA). This report uses the NHS Digital spending estimates as they are nationally recognised figures. Net spending is used instead of gross spending, removing private contributions for services users that are not funding from taxation.
§§ Direct payments (which are generally not payable long-term residential care at present) plus publicly funded domiciliary care.
¶¶ Figures do not sum due to rounding.
*** Based at the London School of Economics and Political Science.
††† Data on social care use in 2015/16, as well as the projections used, are from an update to PSSRU (2015). Projections of Demand for and Costs of Social Care for Older People and Younger Adults in England, 2015 to 2035. Available at: www.pssru.ac.uk/pub/DP2900.pdf. These data were provided by the PSSRU.
‡‡‡ This includes the increase in the national living wage – as a large number of social care workers are paid at or close to minimum wage, they benefit from the increases announced in the 2015 Comprehensive Spending Review.
§§§ Therefore projections are using a lower base level of publicly funded social care activity, which in turn leads to lower modelled growth.
¶¶¶ Growth in real-terms wages for an economy is linked to growth in the economy, so a lower rate of economic growth will result in lower growth in wages.
**** Now known as the Department of Health and Social Care.
†††† Excluding this £2bn, the budget for social care would fall from £14.5bn in 2016/17 to £13.8bn in 2017/18.
‡‡‡‡ It is ultimately the decision of local authorities how much to spend on social care for their population, though there are estimates for the relative need for care services (Institute for Fiscal Studies (2018). Adult social care funding: a local or national responsibility? Appendix A. Available at: www.ifs.org.uk).
§§§§ For example, if actual spending by local authorities is higher than we project, the funding gap would be smaller, and vice versa.
Summary of five alternative options
The previous chapter provides estimates for the funding needed to meet pressures on publicly funded social care under the current system. However, as discussed in Chapter 1, there is almost universal agreement among politicians and policymakers that the current system is not fit or purpose.
In February 2018, the Health Foundation and The King’s Fund published a working paper setting out five alternative approaches to funding adult social care in England, with a detailed description of the relative strengths and weaknesses of each against a defined set of attributes. The paper did not offer a comprehensive list of possible models. Rather, the five were selected on the basis that they reflect the solutions most commonly raised in the debate around social care funding. They are summarised here, but are explained in more detail in the paper.
Improving the current system
This approach would mean retaining the current system for funding social care, with no fundamental change in the sources of funding (public and private), or the eligibility criteria (needs and means tests) that determine who receives publicly funded care.
However, it does envisage smaller, incremental changes to the system to ‘top up’ funding on a short-term basis. This is broadly in line with the approach taken in recent years, with measures including additional funding to support integration with the NHS through the iBCF, and additional tax-raising powers for councils via the social care precept introduced in 2015. It also considers other incremental changes that could be introduced to improve issues such as eligibility for funding, for example the reintroduction of an annual increase in the means test in line with inflation.
Importantly, as this approach would mean retaining the existing funding structure, there would be no need for a transition or implementation phase. The financial and political cost of change, and therefore this benefit, have often been underestimated.
The cap and floor option
The Conservative Party manifesto proposed two key changes to the means test for social care:
- the existing ‘upper’ and ‘lower’ thresholds would be replaced with a single threshold, set at £100,000 – much higher than the current upper threshold of £23,250
- savings and property assets would be included in the means test for both residential and domiciliary care, rather than for residential care only, as is the case currently.
Subsequently, a cap on the lifetime costs of care was added to the package, which would mean that no one would need to pay above a certain level. The level of the cap has not been specified, although the Care Act 2014 would have set the cap at around £75,000. This was initially postponed from 2016 to 2020, before being postponed indefinitely. However, the Health and Social Care Minister confirmed that the forthcoming green paper on care for older people will include a cap on lifetime spending as an option.
These proposals relate to the nature/scope of the government’s offer on social care. They are not a means of generating additional funding, although including assets in the means test for domiciliary care would reduce public spending, and the Conservative Party manifesto proposed means testing the winter fuel allowance and directing the proceeds to social care.
Free personal care
Free personal care (FPC) has been offered in Scotland since 2002. Under this model, personal care is provided to anyone aged over 65 based solely on need and not their ability to pay. Personal care includes personal hygiene, continence, diet, mobility, counselling, simple treatments and personal assistance to perform normal daily activities.
The approach varies depending on whether the individual receives personal care in their own home, or in a care home:
- Those receiving care at home are not charged for any personal care services. The package offered varies on a case-by-case basis. Net expenditure on domiciliary care services for older people in Scotland in 2015/16 was £196 per week per user in 2018/19 terms. Of this, £161 was spent on free personal care.
- For those who receive care in a residential home, the local authority contributes to the cost of their personal care (at a flat rate), directly to the care provider. As of April 2015, this contribution is £171 for personal care, plus an additional £78 per week for nursing care services should they be needed. This payment does not cover accommodation costs, which are subject to a means test. This is currently mandated by the Scottish government, so cannot vary across different local authorities.
- In addition, Scotland has committed to the extension of Free Personal Care to all under 65s who require it by 1st April 2019.
This system relates to the nature and scope of the government’s offer on entitlement for social care, but is not a means of generating funding.
This approach would mean bringing health and social care funding together into a joint budget at both national and local level. While this would mean a different approach to the management of social care funding, it is not a means of generating additional funding for social care.
This model would encourage synergies between the provision of health and social care, but would not in itself mean that their delivery would be more integrated, or that there would be a more aligned approach to entitlement to health and social care. However, current fundamental differences for health and social care may necessitate some changes to the funding and eligibility criteria for social care to make a joint budget more viable.
This approach would mean a dedicated tax to fund social care services. This approach could take different forms, ranging from ‘full’ hypothecation, where spending on social care was linked directly to the revenue generated from the tax, to ‘soft’ hypothecation, where the tax would be symbolically linked to social care, but in practice the revenue raised would not be ring-fenced. Social insurance is a common form of hard hypothecation used internationally.
Because this approach is very different from that taken in the heath sector and other public services, introducing this system would involve a significant shift in fiscal policy.
The approach relates to the way in which social care funding is generated, but would not determine the nature and scope of the government’s offer on social care. As such, using a hypothecated tax would also not necessarily affect the costs to the public purse of social care. This is because it could be introduced without changing the number of people who are eligible for care, or the amount of care that is offered to those people.
Cost implications
These five options address different aspects of the funding challenge, such as the way public funding is provided, how funding for the system is raised, and how the budget is managed. They are not mutually exclusive. They also have different implications for how funding is generated and who will receive it. In some cases, their introduction would make a large difference to public funding. For example, the Conservative Party manifesto proposal and FPC would both require increases in public spending to make sure there is no serious decline in quality of services.
Other options would have minimal if any direct change to the level of public funding. Combining the health and care budget would not necessarily lead to changes in the size of the combined budget, and a hypothecated tax would only raise funding if it was set at a level to increase the total national tax revenue.
In the remaining chapters, we explore the estimated additional costs associated with introducing FPC, and a cap and floor model as proposed in the Conservative Party manifesto. Finally, we present potential changes to national tax and benefits that could be used to fill the likely funding gap under the current system, provide improvements to the current system, and fund the additional costs of alternative models.
For the new models, we have only modelled changes to funding for people aged 65 and over. We have assumed that funding for people of working age is fully publicly funded, as this is true for most people aged 18–64 receiving care.
Cost of ‘cap and floor’ model
Ahead of the 2017 general election, the Conservative Party manifesto proposed three major changes to the approach to means testing under the current system:
- raising the means test to a single floor of £100,000, thereby abolishing tariff income and ensuring that users always retained at least £100,000 in assets
- including the value of a user’s own home within the means test for those in both residential and domiciliary care: currently, the home is included in the means test for residential care only, not domiciliary care
- introducing a cap on the lifetime costs of care, although the level of the cap was not specified.
The additional cost would in part be paid for by introducing means testing for the winter fuel allowance.
We estimate that the introduction of the cap and floor model would cost an additional £3.2bn in 2015/16. In addition, we estimate that while the number of people provided with publicly funded domiciliary care falls, this fall will be less than the increase in the number of people receiving publicly funded residential care. The remainder of this chapter explains how we arrive at this figure.
Number of eligible people
Although these changes would affect all adults, the majority of people aged 18–64 who need care do not have significant assets or savings, so qualify for publicly funded care under the current system. Changes have therefore been modelled for people aged 65 and over, and estimates have been made of the cost of providing these additional services.
An estimated £7.7bn was spent providing services to people aged 65 and over in 2015/16 (Table 1). Of this, £2.7bn was spent on domiciliary care for 248,385 people, including people with a direct payment at an average annual cost of £10,898 per user. And £3.4bn was spent on residential care for 156,840 people, at an average annual cost of £21,664 per user. The remaining £1.5bn was used to cover the cost of other activities including commissioning services, and providing means and eligibility assessments.
Table 2: Estimates of activity and costs of social care in 2015 for people aged 65 and over, 2018/19 prices
|
People |
|
|
Direct payment users |
43,055 |
|
Domiciliary care |
|
|
Publicly funded |
205,330 |
|
Privately funded |
100,746 |
|
Care home residents |
|
|
Publicly funded |
156,840 |
|
Privately funded |
149,671 |
|
Expenditure on older people’s publicly funded social care |
Total net spend |
|
Domiciliary care |
£2.7bn (£10,898 average per person) |
|
Residential care |
£3.4bn (£21,664 average per person) |
|
Assessment and other |
£1.5bn |
|
Total |
£7.7bn |
Note: PSSRU numbers for publicly funded adult social care are lower than activity numbers of 873,000 that are quoted by NHS Digital for 2015/16, which is for all adults. In addition, PSSRU uses the number of individual social care users on a specific day (the last day of the financial year), while NHS Digital refers to the number of individual users over the course of the whole year.
Estimating the number of people eligible for publicly funded social care
To estimate the total number of people eligible for publicly funded social care in England, we used data from the English Longitudinal Study of Ageing (ELSA). This contains information on financial and estimated housing assets of the older population, as well as information on need for social care. We used the ELSA records of activities of daily living (ADLs) to estimate social care need. If respondents reported to be struggling with two or more ADLs then we include them as having a need for social care.
We then separated people into one of 10 groups based on their assets, each of which are affected differently by this cap and floor approach. These groups and their numbers for 2015/16 are recorded in Table 3. As no value for the cap was proposed in the Conservative Party’s manifesto, £75,000 has been used as a close approximation to the figure included in the Care Act 2014. The total amount paid by councils will also depend on an individual’s income. For estimates in this report, we apply the same assumption used by the 2013 impact assessment for introducing a cap – that people will still be required to pay a contribution towards their cost of livingthat are equal to their income.
Calculating how many people use social care
In Table 3 the population has been separated into two groups, as housing assets are excluded from the means test for domiciliary care, but included for residential care.
Table 3: ELSA numbers for assets and need for social care
|
Assets included |
Eligible, current system |
Eligible, Conservative offer |
% of England population (65+) |
% of England population (65+) with ≥2 ADLs |
Number of people (thousands) (65+) with ≥2 ADLS |
|
|
Financial only |
<£14,250 |
Publicly funded domiciliary care |
N/A – under this new model, there is no circumstance where only the financial savings are considered for the means test. |
51.8% |
13.9% |
1,402 |
|
£14,250–£23,250 |
Some funded domiciliary care |
6.1% |
1.3% |
129 |
||
|
<£23,250 |
57.9% |
15.2% |
1,531 |
|||
|
>£23,250 |
Not eligible |
42.1% |
6.6% |
662 |
||
|
Total |
100.0% |
21.8% |
2,192 |
|||
|
Financial and housing |
<£14,250 |
Publicly funded residential care |
Publicly funded domiciliary and residential care |
12.9% |
5.2% |
519 |
|
£14,250–£23,250 |
Some publicly funded residential care |
Publicly funded domiciliary and residential care |
1.4% |
0.5% |
54 |
|
|
<£23,250 |
14.3% |
5.7% |
572 |
|||
|
£23,250–£100,000 |
No public funding until assets fall to £23,250 |
Publicly funded domiciliary and residential care |
18.0% |
4.5% |
451 |
|
|
<£100,000 |
32.3% |
10.2% |
1,023 |
|||
|
£100,000–£175,000 |
No public funding until assets fall to £23,250 |
No public funding until assets fall to £100,000 |
23.5% |
4.6% |
459 |
|
|
>£175,000 |
No public funding until assets fall to £23,250 |
Capped privately funded social care at £75k |
44.2% |
7.1% |
710 |
|
|
Total |
100.0% |
21.8% |
2,192 |
By comparing the figures in Table 3 with PSSRU’s estimates for use of social care for 2015, we estimate that, of those people aged 65 and over with high need (two or more ADLs) and who are eligible for public funding, 16.2% use domiciliary care services. Of these same people, 27.4% are care home residents. For the modelling, we assumed that the remaining 56.4% do not use publicly funded services, relying instead on informal care, purchasing private services or receiving no care.
Of people aged 65 and over with high need who are not eligible for public funding, we estimate that 15.2% use privately funded domiciliary care services, 9.2% are privately funded care home residents, and 75.5% receive informal care or no care.
Table 4: Share of people 65 and over with two or more ADLs who have their needs met through official channels (PSSRU estimates)
|
% share |
|
|
Domiciliary care |
|
|
Publicly funded (including direct payment users) |
16.2% |
|
Privately funded |
15.2% |
|
Care home residents |
|
|
Publicly funded |
27.4% |
|
Privately funded |
9.2% |
Users of domiciliary care
The single value for the asset threshold, or ‘floor’, has very different implication for users of domiciliary and residential care. Under the current system, only financial assets are considered in the means test for domiciliary care, while housing assets are included in the test for residential care. The proposal will include housing assets in the means test for both types of care, while raising the threshold significantly to £100,000.
Using ELSA, we estimate that 1.5 million people aged 65 and over have financial assets worth less than £23,250, excluding the value of their house, and need help with two or more ADLs (see Table 3). These people are currently eligible for public funding for domiciliary care. Including housing assets in the assessment and increasing the threshold to £100,000 would reduce the number of eligible people to 1 million.
Under the current system, 16.2% of people aged over 65 in need of care and eligible for public funding use domiciliary care. We assume that this ratio will remain the same, even as the number of people who are eligible changes. So, of the 1 million people who are eligible and in need of care under this model, 156,840 people would receive publicly funded domiciliary care. We estimate that the average annual cost for these people would be £10,898 per person (see Table 2), so the total cost of publicly funded domiciliary care would be £1.8bn (Table 5). This is smaller than the current estimate of £2.7bn.
Table 5: Costs of domiciliary care under the Conservative offer, 2018/19 prices
|
Financial and housing assets |
Eligible |
Number of people in need (thousands) |
% use |
Costs (£m) |
|
<£14,250 |
Publicly funded domiciliary and residential care |
519 |
16.2% |
917 |
|
£14,250–£23,250 |
Publicly funded domiciliary and residential care |
54 |
95 |
|
|
£23,250–£100,000 |
Publicly funded domiciliary and residential care |
451 |
798 |
|
|
Total publicly funded |
1,023 |
1,810 |
||
|
£100,000–£175,000 |
Capped privately funded social care at less than £75k |
459 |
15.2% |
442 |
|
>£175,000 |
Capped privately funded social care at £75k |
710 |
189 |
|
|
Total cost of cap |
1,169 |
630 |
||
|
Total cost |
2,440 |
|||
The government would, under this model, also introduce a cap on the total private cost that an individual would pay for social care over the course of their life. We have assumed this lifetime cap may be set at around £75,000. In its impact assessment, Parliament analysed a similar cap. The proportion of people whose lifetime care costs exceeded £72,000 was estimated to be 16%. In order to estimate a cap for social care costs, we assume that, at any given point in time, 16% of the population in need of social care have lifetime costs of more than £75,000.
Using ELSA, we have estimated that 710,000 people have total assets of over £175,000. On average 15.2% of these will be using domiciliary care, of which 16% will have reached lifetime costs of £75,000 or more and are now eligible for public funding. Again, this is at an estimated cost of £10,898 per year – totalling £189m.
In addition, the floor of £100,000 means that anyone with assets of between £100,000 and £175,000 will not reach the cap to costs before they reach the floor. Therefore, they would become eligible for publicly funded social care costs before they have paid up to the level of the £75,000 cap. Here we assume that social care users have assets that are uniformly distributed between £75,000 and £100,000. With this assumption, on average 42% of the social care costs for people in this group will be funded by the government (this is the uniform average between 16% and 100%). From ELSA, we estimate that there are 459,000 people in need of social care with assets between £100,000 and £175,000. Of these, 16% have already hit their cap in care costs. As this group hit the floor, 42% of costs will be publicly funded. And 15.2% of people use privately funded domiciliary care, of which the state will fund 58% (16% + 42%). This will cost an estimated £442m.
The total cost of the cap for domiciliary care is therefore £575m, meaning that the domiciliary care under the Conservative Party offer will cost £2.4bn – around £270m less than it does currently (£2.7bn).
Users of residential care
For potential residential care home users, the Conservative Party manifesto offer is much more generous. Under the current system, anyone with total assets (including housing) of less than £23,250 is eligible for publicly funded residential care; under the proposed model that limit increases to £100,000. Using ELSA, we estimate there are 572,000 people aged over 65 in need of social care who have less than £23,250 in assets including housing – there are 1 million with assets under £100,000. This almost doubles the number of people who would be eligible to receive publicly funded residential care should they need it. The costs associated with this change are depicted in the first three rows of Table 6.
Again, we assume that the proportion of people who need care and are eligible for public funding who use a care home does not change from the current rate. This is 27.4% of the relevant population, suggesting that 280,437 people would receive publicly funded residential care. At £21,664 per person, this would cost a total of £6.1bn (Table 6).
Table 6: Costs of residential care under the cap and floor option, 2018/19 prices
|
Financial and housing assets |
Number of people in need (thousands) |
% use |
Costs (£m) |
|
|
<£14,250 |
Publicly funded domiciliary and residential care |
519 |
27.4% |
3,078 |
|
£14,250–£23,250 |
Publicly funded domiciliary and residential care |
54 |
320 |
|
|
£23,250–£100,000 |
Publicly funded domiciliary and residential care |
451 |
2,678 |
|
|
Total publicly funded |
1,023 |
6,075 |
||
|
£100,000–£175,000 |
Capped privately funded social care at less than £75k |
459 |
9.2% |
533 |
|
>£175,000 |
Capped privately funded social care at £75k |
710 |
227 |
|
|
Total cost of cap |
1,169 |
760 |
||
|
Total cost |
6,835 |
|||
We make the same assumptions on the cost of the cap as in the case of domiciliary care: that 9.7% of people in need of social care use privately funded residential care. This leads to a total cost of the cap of £760m. Compared with the current system, which saw £3.4bn spent on residential care in 2015, the Conservative Party option would cost £6.8bn per year.
Changing the offer of publicly funded social care can lead to behavioural changes in its users. In Scotland, the introduction of FPC created unexpected levels of increased demand for domiciliary care. The Conservative Party option is generous to potential residential care users. We might therefore expect its introduction to create additional demand for publicly – and to some extent privately – funded residential care. Demand is assumed in the base case to be 27.4% of eligible people with need for publicly funded care, and 9.2% for privately funded care. So, for example, if demand for both of these services was to increase by 10% (to 19.2% and 37.4% respectively), the costs of providing residential care would increase by £2.2bn from £6.1bn to £8.3bn, while the cost of the cap would increase by £800m from £760m to £1.6bn.
The risk of increased demand for publicly funded services should be considered when evaluating options for funding social care.
All users of social care
Combining the fall in spending on domiciliary care with the increase in costs for residential care would see the total cost of public spending rise by £3.17bn, or 41%, from £7.7bn to £10.8bn (Table 7).
It is clear from this analysis that changing the size of the floor or cap would have a significant impact on the number of people eligible to receive public funding, and therefore the affordability of the social care system. Changes to this system will have implications for public finances, as well as the finances of social care users and their wellbeing and access to care. To properly understand the effects of a modified ‘cap and floor’ system, the sort of analysis performed here must be repeated in each possible case.
Table 7: Estimated change in costs from the Conservative Party offer, 2018/19 prices
|
Current system |
Cap and floor system |
Estimated change |
|
|
Domiciliary care |
£2.7 |
£2.4 |
-£0.3 |
|
Residential care |
£3.4 |
£6.8 |
£3.4 |
|
Assessment and other |
£1.5 |
£1.5 |
– |
|
Total |
£7.7 |
£10.8 |
£3.2 |
Note: ‘Assessment and other’ costs are costs associated with the financial assessment anyone must undergo if they apply for public funding. In addition, there are costs associated with care reviews and case management.
††††† Those with assets between £14,250 and £23,250 are expected to make some contribution to their care. This contribution, or ‘tariff income’, is calculated on the basis of £1 per week for every £250 of assets above the £14,250 minimum.
‡‡‡‡‡ Direct payments (which are generally not paid for long-term residential care at present) plus publicly funded domiciliary care.
§§§§§ Figures do not sum due to rounding.
¶¶¶¶¶ Figures do not sum due to rounding.
****** Under the current system we have estimated that 572,000 people over the age of 65 have more than two ADLs, and financial assets (including housing) of less than £23,250. These people are eligible and in need of social care and, according to PSSRU's estimates, 156,840 people use publicly funded residential care; therefore, 27.4% of publicly funded social care needs are met through residential care.
†††††† Eligible service users may elect to fully fund their own care, but we are not able to estimate the extent of this.
‡‡‡‡‡‡ In practice, it may be the case that more of this 16% are in residential care than in domiciliary care; however, we have no data on which to substantiate this. We therefore apply the 16% to both types of user.
§§§§§§ 16% will have their social care costs covered by the lifetime cap.
¶¶¶¶¶¶ People with assets of £100,001 will essentially have 100% of their costs covered by the floor.
******* Numbers from the table do not add up due to rounding.
††††††† 27.4% of 1,023,000 people.
‡‡‡‡‡‡‡ Some older people, ineligible for fully funded care, may have been putting off entering a care home due to fear of high costs. The fact that catastrophic costs would be limited may reduce these fears and encourage uptake of privately funded residential care.
§§§§§§§ Figures do not sum due to rounding.
Cost of free personal care
Free personal care has been offered in Scotland since 2002. Under this model, personal care is provided to anyone aged 65 and over based on need alone, rather than ability to pay. The assessment for receipt of personal care includes personal hygiene, continence, diet, mobility, counselling, simple treatments and personal assistance.
The approach varies depending on whether an individual receives personal care in their own home, or in a care home:
- Those receiving care in their own home are not charged for any personal care services. The package offered varies on a case-by-case basis. The net expenditure on domiciliary care services for older people in 2015/16 was £196 per week per person in 2018/19 terms. Of this, £161 was spent on free personal care.
- For those who receive care in a residential home, the local authority contributes to the cost of their personal care (at a flat rate), directly to the care provider. As of April 2015, this contribution is £171 for personal care, plus an additional £78 per week for nursing care services should they need them. This payment does not cover accommodation costs, which are subject to a means test.
Given that personal care is available to anyone who needs it, Scotland has had to scale back its offer since its introduction in 2002. When free personal care was first introduced, domiciliary care included ‘mopping and shopping’; since 2002 additional care of this nature (housework, laundry, shopping or lunch clubs) is charged for. Free personal care provides a minimum level of social care to all people in need, regardless of their level of income, savings and assets.
We estimate that the introduction of free personal care would cost an additional £4.3bn, based on 2015/16 data. In addition, we estimate that the number of people provided with publicly funded domiciliary care and residential care both increase as a result of free personal care. The remainder of this chapter explains how we arrive at this figure.
Method
We took multiple approaches to estimating the cost of free personal care – each provided a similar estimate. To estimate the cost implications of introducing free personal care in England, we have made use of Scotland’s free personal care numbers. Free personal care in England would involve offering care not just to those in need who already receive residential or domiciliary care, but to everyone – it would also increase demand for social care services.
Domiciliary care
In Scotland, 46,910 people receive free personal care in the home, which is 4.8% of the Scottish population aged over 65. The cost of free personal care provided in the home was £161 per person per week in 2015/16, which is an annual cost of £8,363. Free personal care in Scotland is a more restricted version of publicly funded domiciliary care than that in England, where the average annual cost is £10,898. The version in England is a slightly more comprehensive service, including housekeeping, which free personal care does not cover.
In England, 349,131 people received privately or publicly funded domiciliary care in 2015/16, of whom 100,746 were privately funded (see Table 2). This was 3.5% of the population over 65. If we assume that the difference in the proportion of people receiving care in the home is due to unmet demand, then we might expect this figure to rise to 4.8% on the introduction of free personal care. If the same level of care remains available, the costs associated with this would be £5.2bn – a £2.5bn increase to the cost of domiciliary care. However, if it was restricted to the same free personal care services covered in Scotland, of £161 per week the increase would be £1.3bn.
Residential care
People living in publicly funded residential care homes in England already receive personal and nursing care as part of their package. The introduction of free personal care would therefore not affect this group.
However, under this model, people aged over 65 receiving privately funded residential care would receive a financial contribution towards their free personal care. In England 149,671 people paid for their own residential care in 2015/16 – 1.5% of the population aged over 65. Free nursing care is offered on the basis of additional need beyond personal care, at £78 per week. In Scotland 9,890 people are paying for their own residential care costs and receiving free personal care contributions, of whom 61% are receiving the additional nursing care. We estimate that the cost of providing free personal care to privately funded residential care users in England would be around £231 per week, or £12,020 per year. This would lead to an additional cost of £1.8bn.
We estimate the cost of introducing free personal care in England, without transition costs, would have been £4.3bn per year in 2015/16 (in real terms).
Table 8: Estimated change in costs for free personal care, 2018/19 prices
|
Current system |
Free personal care |
Estimated change |
|
|
Domiciliary care |
£2.7 |
£5.2 |
£2.5 |
|
Residential care |
£3.4 |
£5.2 |
£1.8 |
|
Assessment and other |
£1.5 |
£1.5 |
– |
|
Total |
£7.7 |
£12.0 |
£4.3 |
Note: ‘Assessment and other’ costs are those associated with the financial assessment anyone must undergo if they apply for public funding. In addition, there are costs associated with care reviews and case management.
Alternative estimates of cost
Public Expenditure Statistical Analyses
Public Expenditure Statistical Analyses (PESA) is an annual publication of the national public spending on social care for older people, both in total and on a per capita basis for each of the UK countries. The Scottish social care system, with the exception of free personal care, is very similar to England. A simple estimation of the cost of introducing FPC in England would therefore be to apply the per capita cost of old age social care to the population of England aged over 65.
By simply applying the Scottish model for ‘Old Age – Personal Social Services’ to the population aged over 65 in England, there is a cost increase of £6.7bn. This is a movement from a spend of £819 per head to £1,513 per head. This figure includes the cost of the more generous means test bands in Scotland of £16,000 and £26,000.
Commission on the Future of Health and Social Care
The Barker commission estimated that free personal care ‘for critical and substantial need’ would cost an extra £3.1bn on top of the current system in 2015. The commission also estimated that if free personal care was made available for people with ‘moderate need’ as well as ‘critical and substantial’, it would cost an extra £7.9bn each year.
Range
We therefore estimate that introducing free personal care for people aged over 65 in England would cost between £3.1bn and £6.7bn, with a central estimate of £4.3bn.
¶¶¶¶¶¶¶ In this analysis, we assume that there is the same level of underlying need for social care in the English and Scottish older populations; in reality, there are likely to be differences.
******** If the net cost of domiciliary care in Scotland was applied (£196 per week), the cost increase would be similar at £2.2bn.
†††††††† In England, 1.7% of the population aged over 65 are in receipt of publicly funded residential care. In Scotland, this figure is 2.1%. This difference could be a result of different levels of need, but also the means test in Scotland is slightly less stringent (£26,000 and £16,000 including housing assets, as opposed to $23,250 and £14,250 in England).
‡‡‡‡‡‡‡‡ Free nursing care is currently provided by the NHS, so this may not require new public funding from taxation, but rather a movement of funding from the NHS’s budget (worth around £525m in 2015/16 in 2018/19 prices; for more see: https://www.whatdotheyknow.com/request/chc_fnc_and_agency_expenditure_2
§§§§§§§§ See: Scottish Government. Free Personal & Nursing Care Information. Available at: http://www.gov.scot/Topics/Statistics/Browse/Health/Data/FPNCInfo
¶¶¶¶¶¶¶¶ (£181+£82)*61.2%) + (£181*38.8%) = £231. This is the weekly cost of privately funded residential care users who receive free nursing care support, according to Scottish free personal care data. The £171 and £78 figures for personal and nursing care have been adjusted to 2018/19 terms.
********* Adjusted from 2012/13 in the Barker report to 2018/19 real terms here.
††††††††† The Barker Commission Report considers social care need in terms of the fair access to care services (FACS) guidelines.
Funding gap with the ‘cap and floor’ and with free personal care
In previous chapters we have estimated the additional costs of:
- continuing with the current model and level of provision
- improving provision under the current model
- introducing a cap and floor approach as proposed in the Conservative Party manifesto
- introducing FPC.
In Chapter 2 we compared the cost of the current model and improvements to the current model, returning to 2009/10 access and quality, to an estimated budget. In this section, we present the cost implications for changes to the model, on top of the demand pressures projected from PSSRU research, compared with the estimated budget to 2030/31, in order to show the total additional spending required.
We present pressures for the total social care system, including for people aged 18–64, although we have not assumed any additional cost for this age group beyond the demand and cost pressures modelled by the PSSRU. We have applied estimates to the initial model projections, rather than the estimates for improving the offer, on the assumption that additional funding will be used to either improve the current offer, or change the fundamental offer of the system. In both cases, the total number of people receiving publicly funded care is increased compared with the current system (Table 9) which contributes to their increase in cost.
Table 9: Estimated number of people aged 65 and over receiving publicly funded social care in 2015 under current system, compared with how many might receive care under the cap and floor or free personal care models
|
Estimated people aged 65 and over receiving fully publicly funded care in 2015/16 |
Current system |
Cap and floor |
FPC |
|
Domiciliary care |
248,000 |
166,000 |
480,000 |
|
Residential care |
157,000 |
280,000 |
157,000 |
|
Total |
405,000 |
446,000 |
637,000 |
Note: For the cap and floor we estimate that there would be an additional 93,000 people who receive level some public funding, due to either hitting the floor or the cap following some private spending on their care.
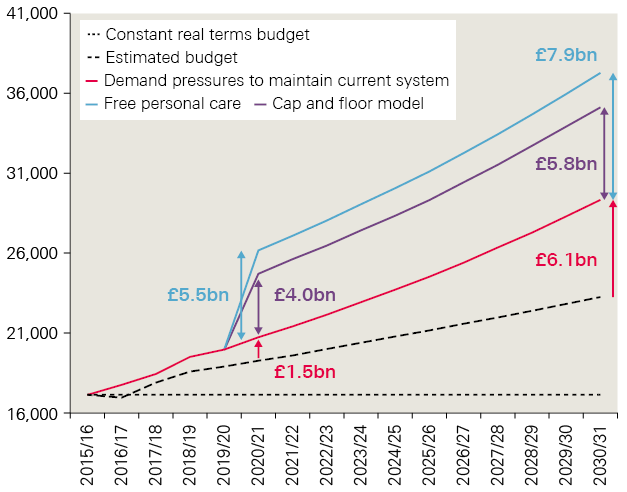
We estimated that the cap and floor model would cost an additional £3.2bn per year based on 2015/16 data. To project the demand pressures of introducing this new system by 2020/21, we apply the PSSRU’s projected growth in spending pressures. This would mean that the cap and floor model would cost an additional £4bn a year by 2020/21, over and above PSSRU’s estimated demand growth, and an extra £5.8bn a year by 2030/31.
Similarly, for the introduction of FPC, we estimate that it would cost an additional £4.3bn a year based on 2015/16 data. Using the PSSRU’s projections of demand, we estimate that this would rise to an additional £5.5bn a year by 2020/21, over and above PSSRU’s estimated demand growth, and to an extra £7.9bn a year by 2030/31.
These additions to the social care funding gap in 2030/31 are presented in Figure 4. For simplicity, the additional cost is shown as an increase in 2020/21, though in reality it would likely be phased in over a period of time, as social care users become used to the new system.
These estimates do not include the cost of implementing a new system. A 2013 impact assessment for introducing a cap on social care spending suggested that the financial cost associated with implementation would be small compared with the overall cost of the policy, so we have not attempted to include implementation costs here. This does not mean that such costs, including political costs, would not be large.
Figure 4: Increased funding gap for social care with the ‘cap and floor’and free personal care, 2018/19 prices
Note: we have presented the additional cost as an increase in 2020/21 for simplicity. In reality it would likely be phased in over a period of time.
Continuing with the current system for adult social care would require investment of £1.5bn in 2020/21 above the estimated budget to keep pace with rising demand and cost pressures. This would rise to an extra £6.1bn by 2030/31.
Introducing changes to the model to provide publicly funded care to more people would further increase the need for additional funding. Introducing the ‘cap and floor’ model could therefore increase the projected funding gap from £1.5bn to £5.5bn in 2020/21, and from £6.1bn to £11.9bn in 2030/31. Alternatively, introducing FPC could increase the projected funding gap to £7.0bn and £14.0bn respectively.
‡‡‡‡‡‡‡‡‡ It may be that a new approach is also introduced with improved eligibility criteria, which would further increase costs. This would require modelling beyond what we were able to include here.
§§§§§§§§§ For more detail see: the Health Foundation (2018). Approaches to social care funding. Available at: www.health.org.uk/sites/health/files/Approaches-social- care-funding_1.pdf
Tax and benefit options
It is clear from the scale of the growing pressures on adult social care that substantial additional funding will be required just to maintain the current system. Any changes to the funding model, such as those modelled in the preceding chapters, will require additional funding on top of this.
There are many options for how to raise additional funding. Factors to consider include whether to raise additional money through taxes or divert funding from other government budgets. Policymakers must also consider how to ensure fairness between and within generations and balance between people contributing to the (sometimes catastrophic) cost of their care or pooling that risk.
The effect of raising taxes
Table 10 shows indicative estimates for extra revenue that the government could expect to raise in the near and long term from an increase of 1 percentage point on several rates of existing taxes. In most cases the estimates are from IPPR’s (the Institute for Public Policy Research) microsimulation tax-benefit model based on the latest sample of 19,000 households from the 2015/16 Family Resources Survey. Using the model, it was possible to project forward different rates of earnings for individuals in the economy, estimate the effects on personal taxation and benefits, and rebuild an aggregate picture from the bottom up. We were then able to estimate the fiscal and distributional effects of different rates of taxation. Due to the limitations of the model the figures for VAT were calculated from HM Revenue and Customs 'ready reckoners' and estimates for wealth taxes and changes to winter fuel payments were sourced from existing literature as cited.
The modelled estimates provided here do not include any behavioural effects due to changes in taxes, with the exception of VAT which is taken from HMRC, and so include its standard behavioural assumptions. For example, increases in income tax may discourage some people from working, thus reducing the overall revenue raised. The estimates are therefore the upper bounds for the revenue that could be raised.
The model provides tax revenue figures for the whole of the UK, while our model of demand pressures represents adult social care in England only. We have therefore applied the Barnett formula to these figures to estimate the revenue which could be made available for English local authorities. The Barnett formula distributes increases in funding within England on devolved areas of spending to Scotland, Wales and Northern Ireland according to the proportion of that area of spending that is devolved (100% in the case of local government) and in line with the ratio of Scotland, Wales and Northern Ireland’s population to England’s. All figures have been further adjusted into 2018/19 prices.
Table 10: Estimated revenue raised from a 1 percentage point increase in key tax rates or from the introduction of a new tax cut, 2020/21 and 2030/31 (England share)
|
Policies |
2020/21 (£bn) |
2030/31 (£bn) |
||
|
Tax type |
Detail |
Source |
(2018/19 terms) |
(2018/19 terms) |
|
Income tax |
Basic |
Author analysis using IPPR model |
3.8 |
5.1 |
|
Higher |
IPPR model |
1.3 |
1.8 |
|
|
Top rate |
IPPR model |
0.4 |
0.9 |
|
|
Fiscal Drag (no uprating) |
IPPR model |
6.8 |
n/a |
|
|
National Insurance contributions (NICs) |
Extend 65+ |
IPPR model |
1.0 |
1.0 |
|
Main rate |
IPPR model |
3.5 |
4.4 |
|
|
Higher rate |
IPPR model |
1.0 |
1.6 |
|
|
Employers contribution |
IPPR model |
4.6 |
6.0 |
|
|
VAT |
Main rate |
HMT |
5.0 |
5.2 |
|
Council tax |
1% uniform increase |
DCLG/IPPR model |
0.5 |
Not available |
|
Winter fuel payments |
Abolish (Total cost of scheme in 2017) |
HMT |
2.1 |
Not available |
|
Means test, linked to pension credit |
IPPR |
1.8 |
Not available |
|
|
Tax as income |
IPPR |
0.1 |
Not available |
|
|
Pensions |
Double lock maximum scenario |
IPPR |
0.0 |
7.2 |
|
Wealth taxes |
Care duty 13% |
Strategic Society |
4.8 |
Not available |
|
Inheritance tax (10% increase) |
HMT |
1.5 |
Not available |
|
|
Higher council tax band |
Resolution Foundation |
9.0 |
Not available |
|
These estimates show that a 1 percentage point increase in the basic rate of income tax would raise £3.8bn in 2020/21, which could be made available for adult social care services in England. This would rise to £5.1bn by 2030/31. A similar increase in the main rate of National Insurance contributions (NICs) could raise £3.5bn a year by 2020/21 and £4.4bn by 2030/31.
Also of relevance when considering which taxes to raise, is the potential distributional impacts for people of different incomes. Figure 5 shows the impact on households by equivalised household income decile for 1 percentage point increases in the modelled taxes in Table 10.
Figure 5: How a 1 percentage point tax increase affects people with different levels of disposable income
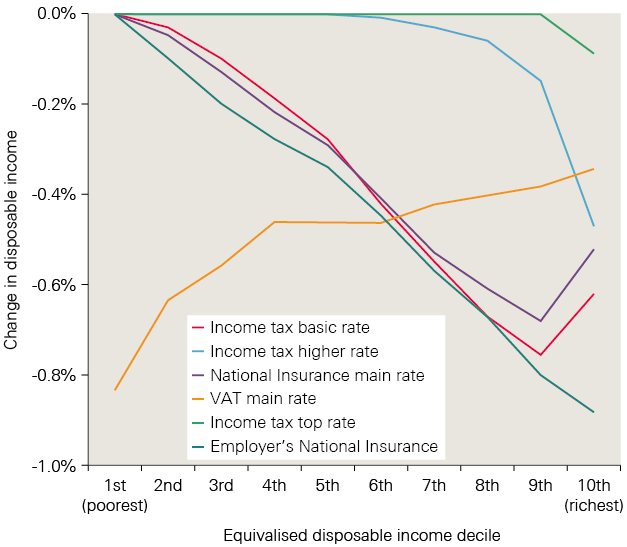
This shows that increases in income tax are progressive, with a 1 percentage point increase in the basic rate of income tax reducing income for the second poorest decile of households by 0.03%, and the second richest by 0.8%.
The top rates of income tax are clearly the most progressive, with over half of households in the lowest income bracket protected – but increases to these rates also raise less money in total. Increasing the basic rates of income tax and employee NICs raises more money, but also affects all households. Raising income tax is marginally more progressive than raising employee NICs; poorer households are less affected and richer households more affected. While VAT raises more tax for each percentage point increase than income tax or NICs, it is far more regressive and would result in a 0.8% fall in income for the poorest 10% of households, compared with a 0.4% fall in income for the richest 10% of households.
Who would be most affected by changes to tax?
Another consideration is which types of people are most affected by different tax options, beyond their level of income. Figure 6 shows that income tax and National Insurance affect households of working age more than older households. Funding additional spending on social care through an increase in National Insurance only would place the vast majority of the additional burden on people of working age. VAT spreads the burden between ages but has a greater proportionate impact on households on low incomes relative to annual income.
Figure 6: How a 1 percentage point tax increase affects different groups of people
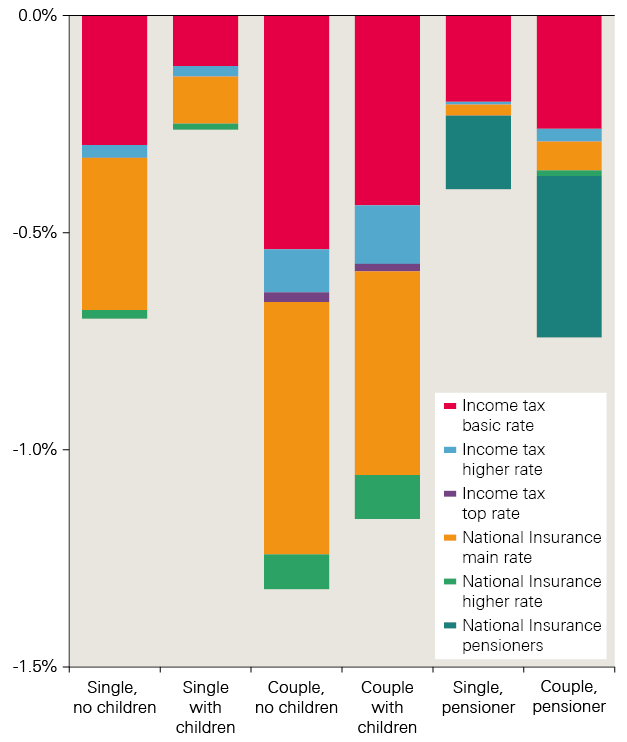
By contrast, extending NICs beyond pensionable age would only affect people who chose to work beyond this age (currently rising to 66). The level of employment among those aged over 65 has increased substantially in recent years. By November 2017, 10.4% of people aged 65 and over were in work – almost double the 5.5% in work when records began in 1992. Pensioners in work are currently exempt from paying employees’ NICs. This favourable treatment comes at a cost in terms of lost revenue, but removing this exemption might remove or reduce the incentive to remain in work post-retirement, which in turn could lead to increased needs for care: employment has an important role to play in protecting health and wellbeing in some older people.
¶¶¶¶¶¶¶¶¶ Ready reckoners provide estimates of the effects of tax changes on total tax receipts.
********** England's share of UK spending on local government is calculated to be 81.1%. This means that our figures are lower than those published by HMRC, which represents the UK as a whole.
†††††††††† Note that, following the Scotland Act 2016, council tax and winter fuel payments can be altered in England without any effect through the Barnett formula.
‡‡‡‡‡‡‡‡‡‡ For illustration, this would raise £4.9bn in cash terms for the UK, of which £3.8bn would be available in England.
§§§§§§§§§§ Equivalised income refers to household income that has been recalculated to take into account differences in household size and composition. For example, households with many members are likely to need a higher income to achieve the same standard of living as households with fewer members.
¶¶¶¶¶¶¶¶¶¶ As before, these figures show the impact of these tax increases without factoring in behavioural change, such as reduced consumption following a rise in VAT, or changes in working patterns due to increased income tax.
*********** Although measuring the distribution effects for VAT may be better done relative to annual expenditure.
Closing the funding gap
Based on the modelling in this report, keeping pace with rising demand and cost pressures using the current system for adult social care will require additional investment of £1.5bn a year by 2020/21. This will rise to an extra £6.1bn a year by 2030/31. Even with no change in the funding model for adult social care, national action will be required to make this funding available.
Introducing changes to the model in order to provide publicly funded care to more people would further increase the need for additional funding. The introduction of a cap and floor, as proposed in the Conservative Party manifesto, could increase the projected funding gap from £1.5bn to £5.5bn in 2020/21, and from £6.1bn to £11.9bn in 2030/31. Alternatively, introducing FPC could increase the projected funding gap to £7.0bn and £14.0bn respectively.
There are many options for how this additional funding could be made available. This section sets out four potential scenarios:
- taxing income
- taxing high earners
- taxing or redirecting spend on older people
- taxing wealth.
There are positive and negative implications of each, and no recommendation is made on the suitability of the options.
Taxing income
The government could look to a broad increase in NICs. Adding 1p per £1 to the main rate, higher rate and employers’ contribution to National Insurance by 2030/31 would raise enough to fund the introduction of the cap and floor model. If means testing was introduced to winter fuel payments at the same time, this could be enough to introduce FPC (Table 10).
Alternatively, adding 2p to the basic, higher and top levels of income tax, or 3p to VAT, would provide more than enough to fund either the cap and floor or FPC, and would be sufficient to improve access and quality close to the levels observed in 2009/10.
Another option available would be to exploit fiscal drag. This could raise significant sums through holding all tax allowances constant at 2017/18 prices. This could generate an extra £6.8bn for English adult social care in 2021 if there was no uprating of allowances and bandings (in this case on income tax). This might present a different approach to taxing income and is broadly progressive. However, this alone is not a realistic long-term solution, but more a political lever that could be used alongside other changes.
Taxing high earners
An alternative approach is to only increase tax paid by those earning the highest incomes, by increasing only the top rate of National Insurance and the top and higher rates of income tax. This approach would be progressive in nature but would require substantial increases in the rates. For example, just meeting the current funding pressures would require a 7p per £1 increase in the top rate of income tax in 2030/31.
Improving access back to levels observed in 2009/10 would need an 18p increase in the top rate of income tax in 2030/31, while introducing free personal care would require an additional 16p.
This would further increase the burden placed on a very small portion of the population. Currently the top 1% of earners account for 28% of all income tax paid to HMRC, and households earning the top 10% of incomes pay around 27% of total taxes.
Taxing or redirecting spend on older people
A common argument for how to raise funding for social care is that, as older people are the greatest benefactors of an improved care system, they should contribute towards funding any improvement to the model. This would likely involve raising taxes but also reducing spending on current benefits provided to older people.
In a best-case scenario, where the maximum saving and revenue are realised, around £10bn could be raised through the following initiatives by 2030/31. As such, they may be enough to close the funding gap under the current system, but would not provide sufficient additional funding for the cap and floor model or full personal care. They would therefore need to be part of a wider solution.
Means testing the winter fuel payment
Everyone born on or before 5 August 1953 is entitled to a winter fuel payment (WFP) of between £100 and £300 to help pay for heating bills, at a total cost of £2.1bn a year. The Conservative Party’s pre-election proposals included means testing the WFP to reduce the number of people receiving it. Linking the WFP to another means test, such as pension credit, is likely to be the most cost-effective way of doing this and would reduce the total cost from £2.1bn to £300m. This would mean an additional £1.8bn could be available for social care services. It would therefore only be a contribution towards the funding gap for any of the proposed models. It is also a regressive option as the poorest pensioners (excluding those on pension credit) would lose a higher share of their income. There is also a risk that people who rely on WFP and are eligible for it would not receive it; for example, nearly a third of eligible pensioners are thought not to access pension credit.
Extending NICs beyond retirement age
This could raise a further £1bn. However, empirical literature suggests that the employment decisions of people around retirement age are much more responsive to financial incentives than those at younger ages. The behavioural impacts are therefore likely to be much greater, and would reduce the total estimated revenue raised. The Mirrlees Review of the tax system argued that the UK should strengthen work incentives among older people – not weaken them – for precisely that reason. Alternatively, if National Insurance were imposed on income of private pensions, it would raise about £350m a year for each 1p on the rate – this would avoid disincentivising work but face significant opposition from pensioners.
Moving from a ‘triple-lock’ to a ‘double-lock’ on pensions
This has been advocated by Baroness Altmann, and was also initially proposed in the Conservative Party’s 2017 manifesto. It would see the basic state pension and new state pension still increasing by the highest of either price inflation or average wages, but would drop the third condition of rising by at least 2.5% a year. Under the right circumstances this has the potential to significantly reduce public spending on pensions, which could be redirected to social care. But the impact of this policy is incremental, as savings are only accrued over time. Crucially, the amount released would also depend on the outlook for wages growth.
Under the most optimistic scenario derived from HM Treasury figures, the IPPR estimates that an additional £7bn could be generated by 2030 from such an approach. But, it could alternatively result in no additional funding at all if inflation or wage growth exceed 2.5%, as is usually the case.
Taxing wealth
Another option is to move the balance of the UK tax burden away from income to fall on the accumulated private household wealth, which has reached an unprecedented scale (notably through property and pensions). However, these new ideas are harder to model accurately and potential behavioural effects are not fully understood.
One option within this approach is to increase inheritance tax (IHT), both in terms of raising the rate and lowering the threshold. Changes to IHT and National Insurance were proposed to fund the Dilnot reforms in the 2015 Spending Review. ‘Ready reckoners’ published by HM Treasury estimate that a 10% increase in the rate of IHT to 2021 could raise £1.5bn. Lowering the threshold at which no inheritance tax was paid could raise £75m for each £5,000 decrease. Yet total current receipts for IHT are only £4.8bn, so it seems that marginal changes would only provide some of the additional funding required for social care.
A version of this reform was proposed by then Health Secretary Andy Burnham in 2010: the ‘care duty’ of 10–15% of estates. The Strategic Society modelled that a 13% levy could raise up to £6.5bn (this is an approximation and was by necessity modelled for 2008 property values). This could make a significant contribution towards funding improved care in the short term, but implications for long-term funding will depend on aspects such as changes in the property market.
Other proposals include changes to council tax beyond the social care precept, such as an additional council tax band. The Resolution Foundation estimates that a family living in a £100,000 house currently faces a tax rate five times higher than one living in a house worth £1m. It proposes that a 1% tax on the value of properties above £100,000 could potentially raise £9bn in revenues. This would therefore cover the cost of each of the alternatives modelled in 2020/21.
Wealth taxes such as those discussed here are generally regarded as progressive options, as the proportion of tax increases with total wealth. And clearly options exist that could fund at least part of an improved social care system. However, such approaches could prove controversial, as many people’s homes have risen dramatically in value while their incomes have not. Equally, the introduction of the value of property into the means test for domiciliary care within the Conservative Party’s manifesto proposal could be argued to be a form of tax on property. In this instance, it might become more politically acceptable to pay for this proposal using separate taxes on wealth.
††††††††††† As explained above, the tax benefit model does not make any adjustment for behavioural change, which may reduce the amount raised. The level of behavioural change is generally thought to be greater for higher earners, increasing the uncertainty of these figures. Therefore the actual required increase is likely to be higher than the figures provided here.
‡‡‡‡‡‡‡‡‡‡‡ A ’smoothed earning link’ has also been proposed by the Work and Pensions Committee but is not discussed in detail here.
§§§§§§§§§§§ This is a UK cash figure which corresponds with the adjusted figure of £4.8bn in Table 10.
Discussion
The case for changing the model for publicly funded social care is strong, and widely accepted. But one of the major barriers to change is the additional funding that would be required. This would need to be met through additional taxation, reductions in benefits or other public service budgets, or through increased public borrowing. The case for additional investment in a public service is always challenging, but more so in the current context of the government looking to reduce the national public deficit.
Despite this, extra central government funding has been made available through the IBCF, while councils are now allowed to raise additional local revenue through the social care precept. The recommitment to a social care green paper in the 2017 Conservative Party manifesto, and the change in remit for the renamed Department for Health and Social Care, also highlight the increasing priority of social care for p colicymakers.
Yet, our projections show that even continuing with the current model of care would require additional investment above our estimates for the budget, to close a funding gap of around £1.5bn in 2020/21 and £6.1bn by 2030/31. Improving or changing the model could increase the gap to between £11.9bn and £15.4bn by 2030/31.
Providing this increased level of funding would allow providers to keep pace with demand and cost pressures, but would not allow for any improvements in care. There may be some scope for reducing pressures through improvement in the productivity with which services are provided, although this is likely to be marginal. It may also only help stabilise the current market, rather than result in any observable improvements.
Even with higher growth in productivity, additional funding would still be required for substantive improvements. This could be found from other areas of public spending, or additional borrowing. But with other services already facing further cuts, and the government committed to reducing the national budget deficit, it is likely that additional taxation will be required. We have shown that even continuing with the current system presents a challenge that cannot be addressed with a straightforward tax increase in the long run. Rather, a suite of changes to taxes and benefits is needed. How this is done depends on a number of trade-offs on the amount required and how it is to be raised. Decisions include:
- finding a balance between protecting those with the lowest personal resources and protecting people from catastrophic costs
- continuing with the current level of provision, restoring past levels of eligibility, increasing the number of people eligible, or moving towards a more universal approach, as provided by the NHS for health care
- how the relative contributions of working age and older people towards paying for care are defined
- whether funding is raised against people’s income or their wealth.
There are no clear solutions to these challenges; each requires substantial compromise. It is therefore critical to engage the public to make sure that decisions are made in the best interests of public values. Supporting work by the Health Foundation and The King’s Fund has included a series of public engagements to support these key decisions, with findings available in an accompanying report. The implications on policy of combining the options discussed in this report with public opinion on social care are discussed in a jointly published paper.
Conclusion
Our modelling shows that additional revenue will need to be raised for adult social care services even without a change in the model. Failing to do so could lead to a decline in access and quality of services, which would likely lead to a fall in quality of life for many people, as well as additional costs for other public services, particularly the NHS.
There are two key questions now facing policymakers and government. The first: given that additional tax revenue will be required to protect the range and quality of care services, should there be a small increase in taxes to allow for the current levels of access and quality to be maintained, or a larger increase to provide an improved standard of service? And the second: would this improvement would be better done through additional funding for the current model, or through changes to the model of care to better suit the needs and preferences of the current and future population?
References
- The Health Foundation (2018). Approaches to social care funding. www.health.org.uk/publication/approaches-social-care-funding
- UK Government. Spending Review and Autumn Statement 2015. www.gov.uk/government/topical-events/autumn-statement-and-spending-review-2015
- UK Government. Spending Review and Autumn Statement 2015: key announcements. www.gov.uk/government/news/spending-review-and-autumn-statement-2015-key-announcements
- UK Government legislation. Care Act 2014. www.legislation.gov.uk/ukpga/2014/23/contents
- UK Government (2015). Social care: Direct Payments from a local authority (England). http://researchbriefings.parliament.uk/ResearchBriefing/Summary/SN01911#fullreport
- Commission on the Future of Health and Social Care in England (2014). A new settlement for health and social care: Final report. The King’s Fund. www.kingsfund.org.uk/sites/default/files/field/field_publication_file/Commission%20Final%20%20interactive.pdf
- UK Government. Live tables on dwelling stock (including vacants). www.gov.uk/government/statistical-data-sets/live-tables-on-dwelling-stock-including-vacants
- UK Government (2015). Social care: how the postponed changes to paying for care, including the cap, would have worked (England). http://researchbriefings.parliament.uk/ResearchBriefing/Summary/SN07106
- Department of Health (2010). Charges for residential accommodation – crag amendment no 29. Local Authority Circular. The National Archives. http://webarchive.nationalarchives.gov.uk/20130105060614/http:/www.dh.gov.uk/prod_consum_dh/groups/dh_digitalassets/documents/digitalasset/dh_114331.pdf
- Centre for Analysis of Social Exclusion (2015). The Coalition’s Record on Adult Social Care: Policy, Spending and Outcomes 2010–2015. http://sticerd.lse.ac.uk/dps/case/spcc/WP17.pdf
- Office for National Statistics (2016). Table A2-4, Principal projection – England population in age groups. www.ons.gov.uk/peoplepopulationandcommunity/populationandmigration/populationprojections/datasets/tablea24principal projectionenglandpopulationinagegroups
- National Down Syndrome Society (2017). Down Syndrome Facts. NDSS. Available at: https://www.ndss.org/about-down-syndrome/v down-syndrome-facts/
- Community Care (2018). Reablement: a new analysis. www.communitycare.co.uk/2018/02/22/reablement-new-analysis
- ADASS (2017). ADASS Budget Survey 2017. www.adass.org.uk/adass-budget-survey-2017
- CQC (2016). Adult social care ‘approaching tipping point’, warns quality regulator (new story). www.cqc.org.uk/news/releases/adult-social-care-%E2%80%98approaching-tipping-point%E2%80%99-warns-quality-regulator
- UK Government (2016). Dedicated adult social care funding forms key part of continued long-term funding certainty for councils (press release). www.gov.uk/government/news/dedicated-adult-social-care-funding-forms-key-part-of-continued-long-term-funding-certainty-for-councils
- Nuffield Trust, The Health Foundation, The King’s Fund. The Autumn Budget, Joint Statement on health and social care, November 2017. https://health.org.uk/publication/autumn-budget
- HF analysis of PESA data: Adult social care costs (excluding unemployment)
- Department of Health (2013). Social Care Funding Reform Impact Assessment. www.parliament.uk/documents/impact-assessments/ia13-14c.pdf
- The Health Foundation (forthcoming). Next steps for social care funding reform
- Competition & Markets Authority. (2017). Care homes market study. https://assets.publishing.service.gov.uk/media/5a1fdf30e5274a750b82533a/care-homes-market-study-final-report.pdf
- LaingBuisson (2017). Care of Older People: UK Market Report, 28th edition
- NHS Digital (2017). Adult Social Care Activity and Finance Report, England 2016–17. https://digital.nhs.uk/data-and-information/publications/statistical/adult-social-care-activity-and-finance-report/adult-social-care-activity-and-finance-report-england-2016-17
- PSSRU (2015). Projections of Demand for and Costs of Social Care for Older People and Younger Adults in England, 2015 to 2035. www.pssru.ac.uk/pub/DP2900.pdf
- UK Government (2017). New sleep-in shift pay compliance scheme launched to support social care sector and identify back pay for workers (news story). www.gov.uk/government/news/new-sleep-in-shift-pay-compliance-scheme-launched-to-support-social-care-sector-and-identify-back-pay-for-workers
- Office for Budget Responsibility (2018). Economic and fiscal outlook – March 2018. http://obr.uk/efo/economic-fiscal-outlook-march-2018
- ONS 2018. Public service productivity estimates, healthcare: 2015. www.ons.gov.uk/economy/economicoutputandproductivity/publicservicesproductivity/articles/publicservicesproductivityestimateshealthcare/healthcare2015
- Joseph Rowntree Foundation. (2018). Productivity in the UK’s low-wage industries. www.niesr.ac.uk/sites/default/files/publications/ForthAznar%20productivity.pdf
- CQC (2017). State of Care 2016/17. www.cqc.org.uk/publications/major-report/state-care
- AgeUK. Changes to the way you pay for residential care. www.ageuk.org.uk/information-advice/care/social-care-and-support-where-to-start/paying-for-care-support/changes-to-the-way-you-pay-for-residential-care
- UK Government (2018). Social care: Announcements delaying the introduction of funding reforms (including the cap) (England). http://researchbriefings.parliament.uk/ResearchBriefing/Summary/CBP-7265
- UK Government (2018). We need to do better on social care (speech). www.gov.uk/government/speeches/we-need-to-do-better-on-social-care
- Scottish Government (2017). FPNC [Free Personal and Nursing Care] Latest Data (updated August 2017). www.gov.scot/Topics/Statistics/Browse/Health/Data/FPNC
- NHS Digital (2016). Community Care Statistics Social Services Activity, England, 2015–16. https://assets.publishing.service.gov.uk/government/uploads/system/uploads/attachment_data/file/557852/comm-care-stat-act-eng-2015-16-rep.pdf
- Based on author’s correspondence with the Department of Health and Social Care
- NHS Choices. Your guide to care and support. Homecare: what’s available. www.nhs.uk/conditions/social-care-and-support/home-care
- Scottish Government. Free Personal and Nursing Care. www.gov.scot/Topics/Health/Support-Social-Care/Support/Adult-Social-Care/Free-Personal-Nursing-Care
- UK Government (2013). HMT Public Expenditure Statistical Analyses (PESA) (collection). www.gov.uk/government/collections/public-expenditure-statistical-analyses-pesa
- UK Government (2017). National Statistics: Family Resources Survey: financial year 2015/16. www.gov.uk/government/statistics/family-resources-survey-financial-year-201516
- Using the March 2018 GDP deflator: www.gov.uk/government/statistics/gdp-deflators-at-market-prices-and-money-gdp-march-2018-quarterly-national-accounts
- ONS (2016). Five facts about… older people at work. https://visual.ons.gov.uk/ five-facts-about-older-people-at-work
- Full Fact (2018). Do the top 1% of earners pay 28% of the tax burden? https://fullfact.org/economy/do-top-1-earners-pay-28-tax-burden
- www.ifs.org.uk/publications/5353
- UK Government (2017). Tax ready reckoner statistics (collection). www.gov.uk/ government/collections/tax-expenditures-and-ready-reckoners
- UK Government: National Statistics. Inheritance tax: analysis of receipts. https://assets.publishing.service.gov.uk/government/uploads/system/uploads/attachment_data/file/698351/Table_12-1.pdf
- Resolution Foundation 2018. Home affairs: options for reforming property taxation. www.resolutionfoundation.org/publications/home-affairs-options-for-reforming-property-taxation/Same as note 1: www.health.org.uk/publication/approaches-social-care-funding
- Ipsos MORI 2018. Understanding public attitudes to social care funding reform in England.
- The Health Foundation 2018. Fork in the road: Next steps for social care funding reform. www.health.org.uk/fork-in-the-road