Acknowledgements
A number of people contributed to the development of this report through peer review and we would like to thank them for their comments and advice. We are also grateful for the advice and help from NHS Improvement and our colleague at the Health Foundation, Zoe Firth.
Errors or omissions remain the responsibility of the authors alone.
Executive summary
Ensuring that the NHS has the workforce it needs with the right skills and support is fundamental to an effective and sustainable health care system. Health care is labour intensive and people centred. The Health Foundation’s 2016 report Staffing matters; funding counts found that the ability of the NHS to deliver its services is being compromised by staff shortages, planning inadequacies and an inability to make best use of the skills of its available workforce.
It identified significant challenges to the NHS in England including substantial staff shortages in nursing and primary care. Yet these are not isolated problems – rather, they are symptoms of a more fundamental fault line. The approach to planning for the million-plus NHS workforce in England is not fit for purpose and there is no overall discernible strategy to ensure that the NHS has the workforce it needs. A year on, the effects of a lack of a coherent and comprehensive workforce strategy continue to be apparent and, if anything, the situation is worse. Health Education England (HEE) publishes an annual workforce plan, but the plan for the current year (2017/18) has not yet been published. In its place, 2017 has been characterised by a series of one-off announcements and initiatives whose positive intent is too often let down by unrealistic timescales and fragmented and uncoordinated implementation.
Trends in the NHS workforce
Analysis of the NHS staff profile in 2017 shows that the trends of concern identified in 2016 have largely continued in a negative direction. The analysis shows the following.
- The number of people in the NHS workforce increased by 2% in the year to April 2017. But growth has been uneven. The staff groups with the highest rates of growth were those who provide support to clinical staff (2.5%), medical consultants (3.5%), and managers and senior managers (4.3%).
- While there has been continued growth in hospital-based doctors, the number of full-time equivalent (FTE) GPs has fallen. This comes amid increasing demand pressures in primary care and despite the government’s commitment to grow the number of GPs by 5,000.
- The number of FTE nurses employed in the NHS in England fell between April 2016 and April 2017. There were 469 fewer nurses and health visitors in April 2017 compared to a year before, despite rising activity pressures.
- The fall in the number of nurses has been most notable in community nursing and mental health – two areas identified as critical to the success of the Five year forward view. Staffing challenges in priority areas are likely to persist, with a recent HEE report showing that 11% of nursing posts in mental health are vacant.
- The UK is below the Organisation for Economic Co-operation and Development (OECD) average for both doctors and nurses per head of population. However, the expansion of medical training places in the UK in the last two decades, and the recent announcement of a further increase in medical student intake numbers of up to 25% by 2019, means the UK will be training many more doctors per head of population. The UK is currently training 13.5 doctors per 100,000 population – above the OECD average and significantly higher than the US, Canada and New Zealand.
- OECD data also show that the UK trains many fewer nurses than comparable countries. In 2014 the UK had 29 nursing graduates per 100,000 population; the OECD average was 45 per 100,000. The US trained more than twice that of the UK (63), while Australia trained even more, at 76 per 100,000 population.
- The differential path of nurses and doctors employed in the NHS has resulted in a marked change in skill mix. In 2010 there were 7.6 FTE nurses in hospital and community health services for each consultant. By April 2017 that had fallen to 6.1 FTE nurses per consultant.
- Decreases in length of stay and increases in the number of nurses in 2014 and 2015 led to the number of nurses per bed day recovering to almost the same level as in 2011, despite rising admissions. But recent data suggest continued rising admissions and falling nurse numbers. This means unprecedented decreases in length of stay will be required to stop the recovery falling back to previous levels.
Building on analysis of the updated workforce profile, this report looks in detail at two important pressure points: the impact on student numbers of the removal of the NHS bursary and the central issue of staff retention.
Nurse bursaries: mature student applicant numbers fall, but limited impact on younger applicants?
By ending the system of bursaries available for nurses and allied health professionals (AHPs), the government is seeking to expand the number of training places in England while limiting the cost to the public purse. It has replaced them with the standard tuition and maintenance loan schemes available for other higher education degree programmes.
Students starting in autumn 2017 in England are the first cohort not to receive the bursary. The other three UK countries are continuing with some variant of the bursary approach. Early data on student numbers indicate that overall applications to university have fallen by 4% across all subjects in 2017 compared to 2016, reflecting demographic changes in the population (there are fewer 18-year-olds than in previous years). Medicine, which is not directly affected by the bursaries reform, has seen applications fall by 3.8%. With medicine applications significantly exceeding the number of places on offer, the intake of students into medicine in 2017 has risen from 8,680 to 8,980 – this is the largest intake for many years.
In contrast, nursing and allied health subjects, which are directly affected by the abolition of bursaries, have seen a sharper reduction in applications (23%), which has gained much media coverage. While the number of applicants still exceeds the number of places on offer, the initial indications are that the number of nurses starting training in 2017 may fall. The number of nursing students domiciled in England placed at UK education providers was 5.5% lower 1 month after A-level results day than on the same day in 2016. Similarly, the number of students from Northern Ireland starting nurse training was 2.7% down on 2016. In contrast, the numbers of students from Scotland and Wales starting nurse training have increased.* In England, at the end of the clearing round on 14 September, about 1,200 fewer students are starting nursing education in autumn 2017 than the year before, which takes the number back to 2015 levels. In addition to the fall in overall numbers for 2017, there has been a shift in the age profile. The number of students aged under 20 starting nurse training is 6% higher, but there are around 10% fewer people aged 20 and over starting a nursing degree.
The Health Foundation’s analysis shows that this is the result of complex changes. Applications to nursing are down across the UK, despite Northern Ireland, Scotland and Wales retaining the bursary system. The fall in England is sharper and is most notable among mature applicants.† Until 2017, 40% of applicants to nurse education were aged 25 and over. The end of bursaries in England is one of several factors that may be affecting applications from this group: pay on graduation and wider opportunities in the labour market may also have an impact.
Other reforms such as apprenticeships and nursing associate roles may also provide alternative attractive routes for some of these applicants, but it seems that the apprenticeship model is being implemented behind schedule. It was announced in November 2016 that the government would support up to 1,000 nurse apprenticeships each year. Yet it has been reported recently that only two higher education training providers have nurses starting training via the apprenticeship route in 2017, with a combined total of less than 50 students. Places at other institutions will become available in 2018 but the programme is significantly delayed.
At the Conservative Party conference the Secretary of State for Health announced a further expansion of nursing associate roles and apprenticeships. These routes into nursing will be very important, particularly for areas such as mental health, which have relied more heavily on older applicants. But the government must learn the lessons from the bursary reforms and initial apprenticeships and plan implementation early, in a coordinated way across education providers and NHS employers.
The motivation for shifting from the bursary to student loans was to allow the number of student nurses and AHPs to expand – by up to 10,000 by 2020. Two critical elements in the fall in the number of students placed in nursing courses for the start of the 2017 academic year have been poor implementation of the reforms to student funding, and even poorer communication from government departments. Most critically, the arrangements
for funding clinical placements, so that higher education institutions could expand places, were finalised too late in the process. Universities were only made aware that additional funding for such placements would be available on 9 August, less than a week before A-level results and long after the initial application process. In addition, there has been insufficient focus on the specific needs of older potential applicants to nurse education.
Any drop in the number of nurses starting training is clearly a cause for concern. The transition to the new student funding arrangements are part of this, but not the only cause. The government must examine how the loan system is working, but also consider what can be done to address the high rate of attrition from nursing courses. A recent survey estimated that one in four student nurses do not complete their training within the scheduled 3 years. The government had set a target to halve this rate but there are no robust data on performance against this target. This must be a priority for universities, employers and HEE.
Retention: is the workforce on shaky ground?
HEE analysis shows that the NHS in England had a shortage of 29,000 FTE staff in 2016 – one in 10 of all nursing posts. Based on current plans, HEE expects the gap between supply and demand for nurses to narrow slightly, but is projecting that the NHS will still not have enough qualified nurses by 2021. It argues that the high rates of nurses leaving the NHS before retirement age is a key contributor to staffing shortages. Official projections anticipate that the NHS will lose 84,000 nurses before retirement age over the next 5 years.
Staff leaving the NHS contribute to overall shortages, can impact negatively on continuity of care, and add to organisational costs. Estimates suggest that it costs the taxpayer approximately £78,000 to train a nurse over 3 years, and that there is an additional cost impact of up to the equivalent of 2 years’ salary when a nurse leaves an organisation. Some employers in the NHS also deal with a continuous high level of turnover (also known as staffing churn).
Despite recent policy emphasis on improving staff retention, the analysis in this report suggests that workforce stability in NHS providers has fallen between 2010/11 and 2016/17. Overall, workforce stability in NHS trusts – measured by the percentage of staff that stay at an NHS trust in a given year‡ – fell from a median of 89% in 2010/11 to 85% in 2016/17. Over the 7-year period the variation in stability between trusts also increased. In 2010/11 most trusts were clustered around the middle, but in 2016/17 the range was wider, with the range of the middle 80% of trusts growing by a third. This points to a worsening picture of overall workforce stability, with the likelihood of added costs being incurred at a time when the NHS cannot afford them.
While the overall size of the NHS workforce increased between 2015/16 and 2016/17, the numbers of nurses (particularly in the community and mental health) and GPs have fallen. There is no immediate or easy end in sight to nursing or GP shortages across the NHS. This is of particular concern given the importance of primary care and community health services for the NHS’s ambition to transform services as outlined in the Five year forward view.
The NHS needs an effective, coordinated workforce policy
The Health Foundation has explored two key pressure points in the NHS – the abolition of bursaries for nurses with the aim of increasing staff in training, and retention of non-medical staff. Never has it been more important to manage training, recruitment and retention well. It is clear that while providing more training places for nurses, reducing attrition from training and increasing retention are all identified in national rhetoric, there is a substantial disconnect between headline statements and actual policy implementation and local delivery – the gap between national rhetoric and the reality for the NHS workforce is growing.
No-one involved in shaping or supporting the NHS workforce in England sets out to create staff shortages, exacerbate their impact, or respond to them inefficiently. However, many of the indicators assessed in this report point to a worsening situation in the NHS, with demand for services growing much faster than key staff groups. There is no quick fix to these problems, but the absence of a sustained and nationally focused approach to workforce policy and planning – compounded by the ongoing disconnect between identified staffing groups needs and funding decisions – prevents effective and coordinated policy interventions.
* Final data on the number of students starting nursing degrees in 2017 will be available in December 2017.
† UCAS defines mature students as any student aged 21 or older at the time they start their studies.
‡ For instance, if trust X had 100 staff and 75 of those were still in post at the end of the year then its 1-year stability index would be 75%. The higher the stability index, the higher is staff retention.
Introduction
A skilled and supported workforce is essential for the effective and sustainable delivery of high quality care. Health care is labour intensive and people centred. As noted in the Health Foundation’s 2016 report on workforce, Staffing matters; funding counts, the current ability of the NHS to deliver its services is being compromised by staff shortages, planning inadequacies and an inability to make best use of the skills of available staff.
This report on the NHS workforce in England identifies significant changes and trends since Staffing matters; funding counts was published. It also represents an update to the Health Foundation’s assessment of the overall policy approach to workforce.
In addition to profiling the workforce, the report provides updated analysis of NHS staffing trends, considers the future of NHS staff and provides international comparisons with Organisation for Economic Co-operation and Development (OECD) countries.
It then goes on to discuss the following two important pressure points.
- The removal of the nurse bursary and its impact on student numbers – this looks at early evidence on the impact of switching from bursaries to student loans for nursing education in England.
- Staff retention – analyses the current pattern of staff retention, to assess if the NHS has scope to hold on to more of its staff.
The report concludes by bringing together the Health Foundation’s analysis of the profile and trends in the NHS workforce in England, reiterating the need for a sustained and nationally focused approach to workforce policy and planning.
Overview of staffing trends and changes
This section of the report provides an overview of staffing trends and changes between April 2016 and April 2017 – the start of the financial year for NHS organisations.
Have things changed since 2016?
The Health Foundation’s 2016 report Staffing matters; funding counts identified a number of key workforce trends in the NHS in England over the 10 years from 2004 to 2014. It noted that most NHS staffing growth had happened in the earlier part of the 10-year period, and for many staff groups there was evidence that growth was now tailing off, had flatlined or was even in decline.
The report raised concerns about staffing decline in primary care and community services – two of the priority areas for NHS service delivery expansion. It stressed that policy attempts to address health care workforce issues in England have often been constrained because they have taken a short-term reactive ‘single intervention’ approach, without fully understanding broader labour market dynamics and the potential unintended consequences and costs of a narrow focus.
The Foundation recommended that if the national element in the overall system was to become truly ‘national’ it needed to:
- take account of the national labour market (not just NHS employment)
- align planning across different occupations and sectors
- focus more on productivity and investment in the current workforce rather than on new roles (unless there is significantly more central support for scale-up)
- achieve a more efficient balance of skill mix
- enable local workforce planning to be conducted within a supportive overall framework.
Staffing matters; funding counts was followed up with an interim report in April 2017 that highlighted the need to end the pay cap for NHS staff and review the current approach to NHS pay, with a view to moving to a system that could more effectively support and be aligned with major workforce objectives of recruitment, retention and improved productivity. The interim report also highlighted that the NHS in England was falling behind the other UK countries in terms of developing a system-wide approach to determining safe and effective nurse staffing.
Unfortunately, the lack of overall national policy coherence across the funding–staffing connection has continued to be a recurring theme in 2017. In previous years Health Education England (HEE) has published an annual workforce plan near the beginning of the annual planning cycle, which has set the overall parameters for staffing and commissioning. It was scheduled to be published in April 2017 for this year, but had not been published as of the end of October 2017, some 6 months after the scheduled date.
Another example of policy disconnect was the late-in-the-day commitment by government to provide funding for additional clinical placements as part of the shift from student nurse bursaries to the student loan system. The funding announcement was only made in August 2017 – at the end of the cycle of student recruitment – and came after months of lobbying by universities. A survey of 27 universities reported by Nursing Times in October concluded that the additional funding had ‘been provided too late to make any significant difference to the number of nurses being trained at university this year.’
The extent to which shortages, notably of nurses, is dominating the workforce agenda has been further reinforced in recent weeks. In its annual report, the Care Quality Commission noted that ‘health and care services are at full stretch’ and that the ‘combination of greater demand and unfilled vacancies means that staff are working ever harder to deliver the quality of care that people have a right to expect. However, there is a limit to their resilience’.
The surprise announcement made by the Secretary of State at the Conservative Party conference in early October 2017, which committed the government to ‘permanently increase nurse training places by at least 25%’ and to significantly increase the number of nurse associates who will be trained, represents a political response to growing concerns about staffing shortages. However, at the time of completing this report, the details are not yet available to assess fully the availability of funding to support this training expansion.
NHS funding is not keeping up with demand
The NHS has been protected from the full impact of austerity since 2010, but the health service is facing unprecedented financial challenges. Although funding for the NHS has increased by more than inflation, the increase is substantially less than the increase in demand and cost pressures. This is because the population is growing and ageing, chronic disease rates are increasing and the service is struggling to meet expectations and provide access to new technologies and treatments.
The NHS has been attempting to bridge the gap between low funding growth and rising pressures through increased efficiency. The NHS’s Five year forward view set the service the challenge of delivering £22bn of efficiency savings between 2014/15 and 2020/21 – this is equivalent to savings of 2–3% a year. The NHS is delivering savings, but is struggling to improve efficiency at the rate required; many NHS trusts have been unable to balance their finances for 4 years. In the 2016/17 financial year the combined deficit for hospitals across England was almost £800m, and nearly half of all providers overspent their budget. For 2017/18, NHS providers are forecasting a further deficit of £500m. To manage these deficits the NHS has been shifting funds from new capital investment into day-to-day running costs.
Staff costs are still compounding the pressure
NHS hospitals spend around two-thirds of their budget on staff. The cost of staff has therefore been a key focus of efforts to constrain costs and improve efficiency. Administrative staff savings have been a particular focus – significantly fewer staff were employed in these roles in 2017 than in 2010. Between 2011 and 2013 nurse training places were cut to save on the HEE budget and, most significantly, pay has been held down as part of government policy on public sector pay restraint: NHS salaries have been capped for 7 years as part of overall public sector pay policy. While the end of this pay cap was announced recently, it is not yet clear how NHS pay will be determined from 2018 onwards. In a report earlier this year the Health Foundation argued that it was time to both remove the pay cap and review how best to implement a pay system for NHS staff that was fit for purpose.
Pay restraint is a significant element of the drive to make savings – holding headline pay increases below inflation accounts for around £5bn of the £22bn savings targeted by the NHS. Alongside pay restraint for directly employed staff, the NHS has been seeking to reduce spending on agency staff. This has been a major source of cost pressures over the last few years while the NHS has struggled with staff shortages. NHS providers spent £2.7bn on agency staff in 2016/17 – a significant reduction of about a fifth on 2015/16, but still a substantial source of cost pressures.
The financial outlook for the NHS remains extremely challenging. Spending per head of population will fall in real terms in 2018/19 and 2019/20. If this is not to have a negative impact on quality of care and access to services, the NHS will have to deliver even greater savings. However, the scope for this is limited. Hospitals are struggling to meet current savings targets, not least because of problems with capacity, as many patients who are medically fit to be discharged remain in hospital due to problems accessing NHS and social care services in the community.
The ability of the NHS to continue with tight pay restraint is also under question. NHS pay scales have not kept pace with inflation over the last 7 years (falling by around 6% in real terms when compared with the consumer price index (CPI) measures of inflation). But this was a period of low inflation. The devaluation of the pound since the vote to leave the EU in 2016 has led to an increase in inflation, further eroding the value of NHS pay. Now that the government has now announced the end to the NHS pay cap, unions that represent the workforce covered by the Agenda for Change pay system (broadly all the non-medical workforce) have submitted a pay claim which would uprate pay scales by the retail price index (RPI) measure of inflation plus a flat rate £800 to address the erosion of real earnings over recent years. Every percentage-point increase to NHS payscales, above the 1% planned under the pay cap policy, will add around £500m a year to the NHS pay bill.
Is there hope for more effective workforce policy and planning?
The combined effect of limited funding and poor staff retention has been to undermine any possibility for long-term consistency in the approach to workforce policy and planning in the NHS in England. This has been compounded by incomplete analysis, particularly of non-NHS supply and demand, as well as continued limitations in NHS workforce data availability and compatibility. A significant number of health care professionals in nursing and allied health work in other sectors – in social services, independent hospitals and nursing homes. As the Health Foundation argued in 2016, there is a need to develop a whole-system view of the health care labour market for health professionals. This will enable a better understanding of demand for, and flows of, staff across these different subsectors, so that demand estimates and retention policies can be more accurately determined.
Within the limitations imposed by data availability, this report provides an updated analysis of NHS staffing trends, considers the future of NHS staff and provides international comparisons with Organisation for Economic Co-operation and Development (OECD) countries.
The NHS workforce in England: profile and trends
The end of growth: for most health care professions, but not all
Since October 2014 workforce growth rates in the NHS in England have slowed across professionally qualified clinical staff (Figure 1). In the 30 months for which comparable data are currently available, the number of full-time equivalent (FTE) managers and senior managers has grown by just under 11%. The number of hospital and community health service (HCHS) doctors has risen more slowly – by just under 3% to 106,540. Among registered nurses, health visitors and midwives, the workforce is up by around 1.1% to 306,160. Allied health professionals (AHPs) exhibited a similar pattern of growth followed by negligible change during late 2016 and into 2017, while the number of health care scientists has fallen slightly.
Figure 1: Change in numbers of full-time equivalent selected staff groups in the NHS in England (index 100=October 2014), October 2014–April 2017
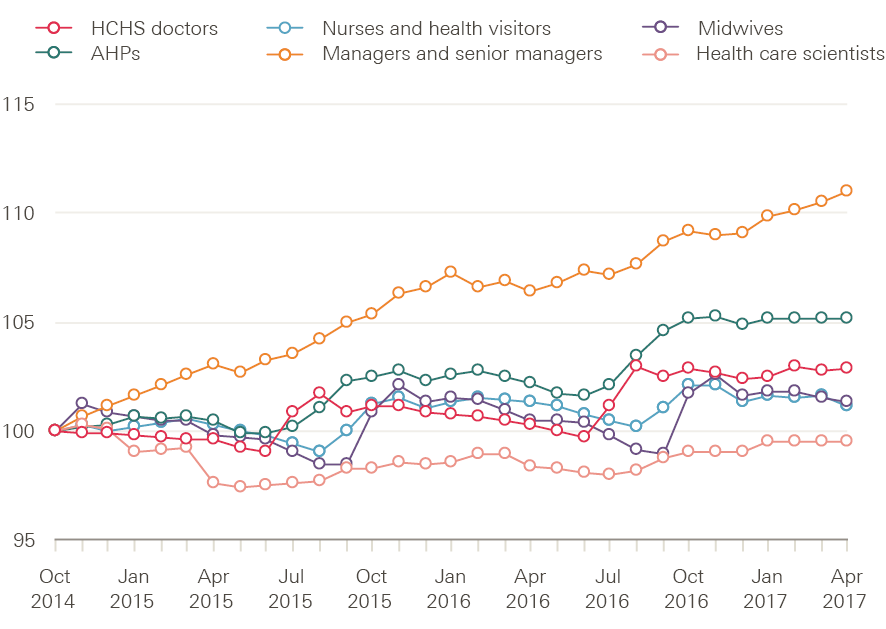
Source: NHS Digital, NHS HCHS monthly workforce statistics – April 2017, provisional statistics (July 2017).
There has been a similar trend between April 2016 and April 2017 in the numbers of FTE staff (Figure 2). There has been a reduction (from 285,000) of 460 nurses and health visitors – equivalent to 0.2% of this staff group. There have been notable reductions in the number of community nurses (down by 970 to 32,750) and mental health nurses (down by 190 to 35,560) – two areas identified as crucial to the success of the Five year forward view. The shortfall in these areas is likely to continue, with a recent HEE report showing that 11% of nursing posts in mental health are vacant. There has been overall growth in some other staff groups: the NHS workforce in England was 2% larger as a whole in April 2017 than in April of the previous year. Particular growth can be seen among support to clinical staff (up by 2.5% to 312,890), consultants (up by 3.5% to 45,120), and managers and senior managers (up by 4.3% to 31,250).
Figure 2: Change in numbers of full-time equivalent staff in the NHS in England (%), April 2016–April 2017
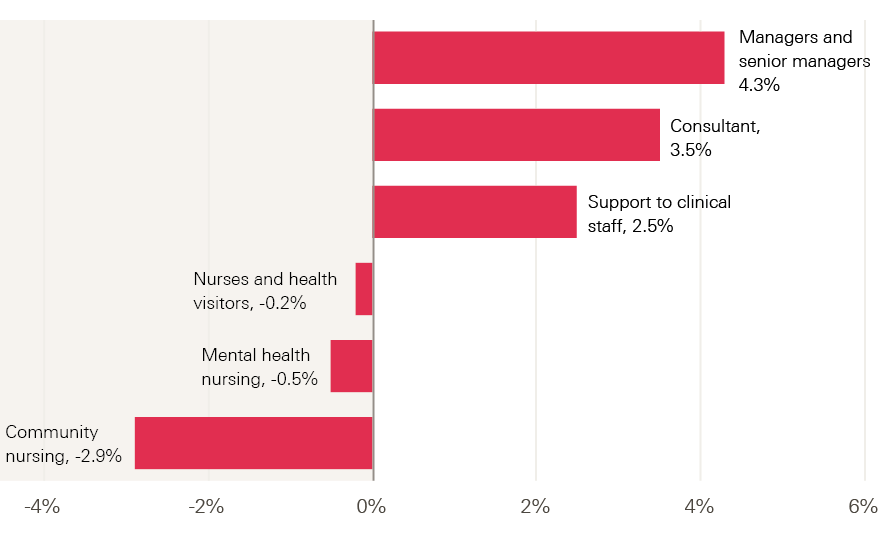
Source: NHS Digital, NHS HCHS monthly workforce statistics – April 2017, provisional statistics (July 2017).
Future growth for doctors?
The Department of Health (DH) confirmed recently that it is to expand government-funded undergraduate medical places by 1,500. The intended first phase will see places available at established medical schools increase by approximately 500 in 2018/19, with the remaining 1,000 places allocated through a competitive process in 2019/20. Priority is reportedly to be given to widening participation and improving access; focusing on priority geographical areas, including rural and coastal areas; and supporting general practice and other shortage specialties. One key element of the initial proposals that went to consultation was to require medical students to be ‘bonded’ to NHS employment for a period after completing training, but this has been downplayed in the final announcement of the initial phase of implementation.
The economic impact assessment conducted to assess the costs and benefits of the planned expansion in the number of medical students estimated the cost to be approximately £350,000 per trainee from starting their degree to completing the foundation programme, and £500,000 per trainee if the cost of specialty training was included. It noted that the two key benefits of increasing the number of doctors trained domestically would be reduced risks of increased labour costs (in part by reducing reliance on expensive locum staff) and relative reductions in health care activity. At best, these benefits will only be achieved in the long term. It takes between 10 and 15 years for a medical student to become fully active in their profession: they must complete a medical degree (5–6 years), then undertake a subsequent foundation programme (2 years) and further speciality training (3 years for a GP; 5–7 years for a consultant).
The announcement in October 2016 about this expansion in medical student numbers was not presented as being based on any detailed planning or analysis, and is another example of a policy and headline-led single-profession initiative rather than an aligned or integrated approach to workforce planning. The Health Foundation’s 2016 report on workforce highlighted the continued risk that such piecemeal initiatives lead to a less-than-optimum and costly staffing profile and mix. Research exploring variation in consultant productivity between acute providers found an association between an increased proportion of nursing staff and higher consultant productivity. This suggests that, within current models of care delivery, consultants and nurses are complementary staff groups rather than substitutes.
It also remains unclear how expectations for improvements in the proportion of new doctors working in underserved areas and specialties will be achieved, if action to rectify this is based only on the assumption that increased recruitment of students from these underserved areas will lead to them returning to work in the same areas when they have completed training. The global evidence on this issue, summarised by the World Health Organization, is very clear that this will not be sufficient to have a sustained impact. Indeed, for many students, the opportunity to access medical education in an established medical school elsewhere is likely to be regarded as a ‘ticket out’ of the underserved area. Effective retention in underserved areas requires a linked group of policies that focus on:
- providing training experiences within underserved areas
- providing financial incentives that can improve attraction and retention
- meeting doctors’ expectations for continued access to professional development
- fulfilling the career aspirations of doctors’ partners and providing good schooling for their children.
Managers bounce back
One group that appears to be bucking the trend in falling staff numbers are those defined as managers and senior managers. Having declined in each of the previous 4 years, the number of managers and senior managers in the NHS in England has been increasing since 2015, outpacing the other main staff groups to grow by almost 11% (although the number, 31,250 FTE, remains 12% below the total in 2010). This does not appear to be due to changes in the coding of clinical managerial roles.
Growth in support staff
In contrast to the trends among professionally qualified clinical staff, the workforce in support roles to clinical staff have seen more significant and sustained growth in some areas (Figure 3). For example, the number of AHP support staff (eg assistant practitioners, health care assistants) rose by 16%, to 13,270 FTE, between October 2014 and April 2017. The number of nursing support staff (eg nursing assistant/auxiliary, health care assistant and support worker roles) in hospital acute, elderly and general care increased by 15% over the same period, to 90,460 FTE. But in other work areas growth has been more modest: 5.9% in paediatrics, 6% in community services, 5% in psychiatry and 3.5% in maternity. In community psychiatry and learning disabilities, the numbers of support workers have actually reduced.
Figure 3: Change in numbers of full-time equivalent clinical support staff in the NHS in England (index 100=October 2014), October 2014–April 2017
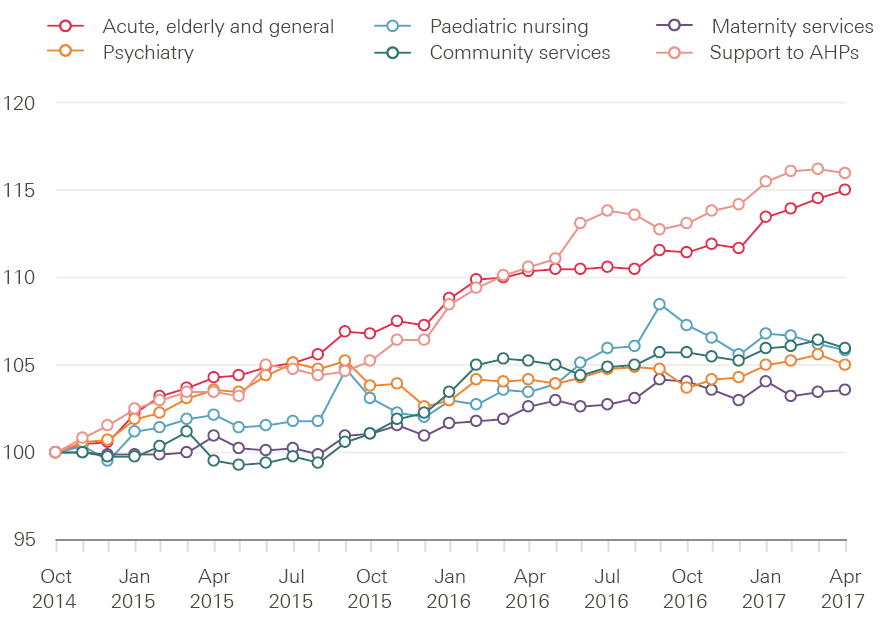
Source: NHS Digital, NHS HCHS monthly workforce statistics – April 2017, provisional statistics (July 2017).
Recent analysis from the Royal College of Nursing (RCN) suggests that shortages of registered nurses is one reason for growth in support staff, as de facto, day-by-day substitution is occurring – unfilled registered nurse posts are being filled by care assistants. In a snapshot survey, RCN analysis showed that 91% of the 50 largest trusts in England failed to have the planned number of registered nurses on wards during the day. More than half of the largest hospitals (55%) brought more unregistered support staff onto shifts. The over-reliance on unregistered support staff is reportedly highest at night, when two-thirds (67%) of hospitals had more assistants on night shifts than planned.
Primary care workforce still facing challenges
General practitioners
Evidence suggests that in primary care, staff numbers are moving further away from the government target of net growth of 5,000 more FTE doctors working in general practice by 2020, as set out in the General practice forward view published in 2016. Since September 2015, the GP workforce (excluding locums) has seen a decline of 2.3% to 33,236 FTE (at the end of June 2017), and that number has fallen by 0.7% (227 FTE) since December 2016. One element of the General practice forward view was the establishment of a new international recruitment programme that aimed to appoint 500 GPs from overseas.
A recent report highlighted that only 38 extra doctors had been recruited from overseas by July 2017, but that the programme was now aiming to recruit 2,000 GPs from abroad as part of ‘a significantly expanded industrial-scale international recruitment programme’. The announcement of this increased target to ‘recruit around 600 overseas doctors into general practice in 2017/18 and aim for a total of at least 2,000 doctors over the next 3 years’ also indicated that countries in the European Economic Area (EEA) were to be targeted initially, with a focus on those ‘with the best chance of affordable supply’. Recent reports suggest that up to eight recruitment agencies will be engaged in this process, with fees of £20,000 per GP (up to £100m in total).
With an ageing male workforce (more than two-fifths of male GPs are aged 50 or over – see Figure 4) the number of leavers is likely to rise further. This age-related outflow may be further affected by changes to tax arrangements on GP pensions, which will reportedly impact most on GPs with long careers and significant pension savings.
Women make up an increasingly large proportion of the GP workforce, rising from 43% in September 2015 to 47% in March 2017, but are more likely to work part time so the replacement number required is even greater. About half of all male GPs work the equivalent of full time, which compares with a fifth of female GPs (Figure 5).
Figure 4: Number of GPs in England by age and gender, September 2016
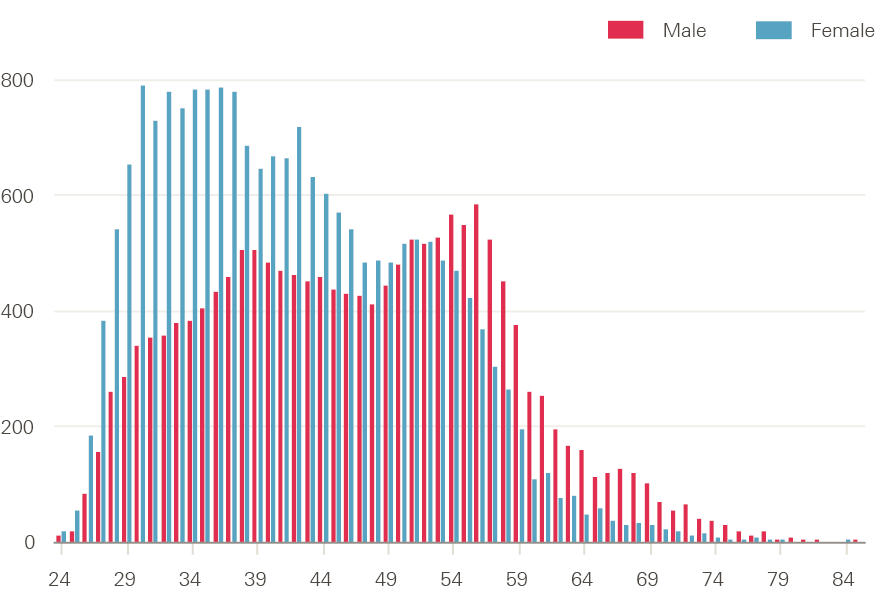
Source: NHS Digital, GPs by gender, job role and age, headcount and FTE, 2015–2016.
Figure 5: Full-time equivalent work commitment of GPs in England by gender (%), March 2016
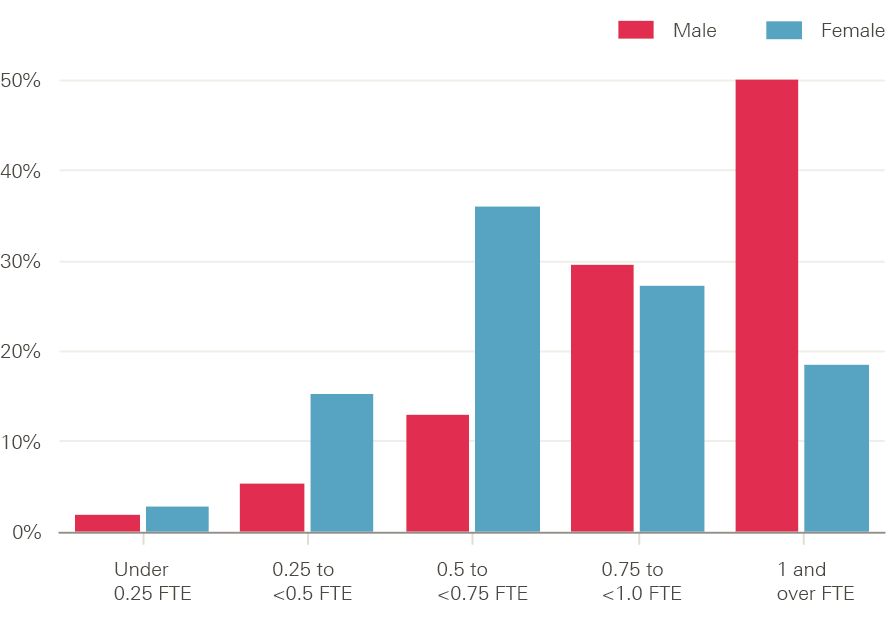
Source: NHS Digital, General and personal medical services in England bulletin tables September 2015–March 2016, Provisional experimental statistics, September 2016.
General practice direct patient care staff
In addition to the aim of increasing the number of GPs by 5,000, NHS England also committed to an increase of 3,000 new fully funded practice-based mental health therapists, 1,500 co-funded practice clinical pharmacists, and nationally funded support for practice nurses, physician associates, practice managers and receptionists.
There was 9% growth in FTE direct patient care staff§ in employment at GP practices in England between 2015 and 2016, from 9,150 FTE staff to just over 10,000 FTE staff. Most of the increase was accounted for by rises in the numbers of dispensers, pharmacists and health care assistants (Figure 6). The most recently published data show that there were 2,185 FTE dispensers, 6,166 FTE health care assistants and 413 FTE pharmacists at the end of March 2016, but only 36 FTE physician associates, 22 FTE physiotherapists and 19 other FTE therapists.
Figure 6: Number of full-time equivalent direct patient care staff in general practice in England by job role in September, 2015 and 2016
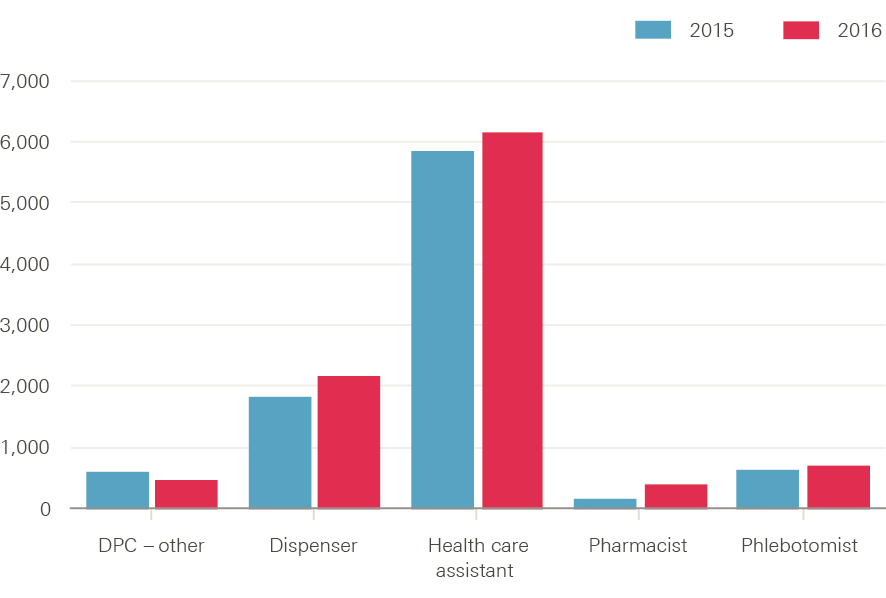
Source: NHS Digital, General and personal medical services in England bulletin tables September 2015–March 2016, Provisional experimental statistics, September 2016.
General practice nurses
The latest available data show that the number of nurses working in general practice rose by just under 3% between September 2015 and September 2016, from 15,400 FTE to 15,800 FTE (Figure 7). A survey of practice nurses in 2016 reported that the increased expectations and responsibilities of the role, related to role expansion, are leading to dissatisfaction. Some nurses were leaving altogether, some were requesting fewer hours or retiring, and 19% were ‘considering retirement to avoid [the] revalidation’ now required by the Nursing and Midwifery Council (NMC).
Another more recent survey also reported that increased responsibilities in the role was a negative factor for some nurses, that the ‘lack of standardisation in pay across and within practices was a particular source of frustration’ and that training, development and pay were not linked to a formal career pathway. The NHS has responded by launching a plan to raise the profile of nursing in general practice, offer clinical placements, provide more support to existing staff and provide funding to encourage practice nurses to return to practice.
Between September 2015 and 2016, FTE numbers of practice nurses (11,770) and nurse specialists (428) shrunk, while extended role practice nurses (613) and advanced nurse practitioner (2,846) numbers grew. The extent to which these trends reflect changes in coding of staff roles or something more substantive is unclear.
Figure 7: Number of full-time equivalent nurses in general practice in England by job role in September, 2015 and 2016
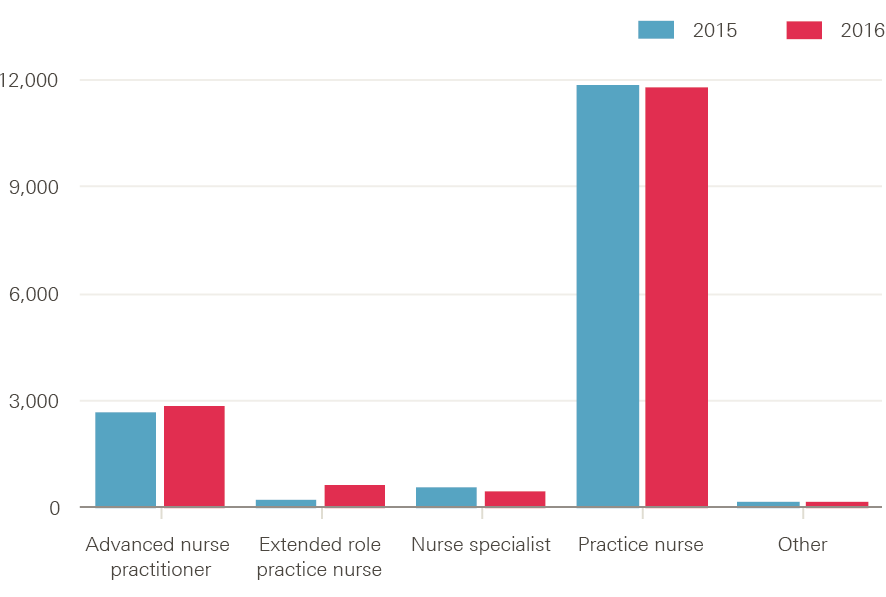
Source: NHS Digital, General and personal medical services in England bulletin tables September 2015–March 2016, Provisional experimental statistics, September 2016.
Figures on administrative and other non-clinical staff working in general practice are only available for September 2015 and March 2016. These show a rise of about 2% to just under 65,000 FTE.
Hospital and community services staff
Staffing matters; funding counts reported the contrasting growth rates between NHS staff. Despite being a priority area, community health services saw much slower nursing workforce growth over the 10 years to 2014 than hospital services. That pattern has continued since 2014 (Figure 8). Although the number of FTE registered nurses working in NHS hospital services (acute, elderly and general adult care) fell slightly in April 2017, it was more than 4,700 (2.7%) higher than in October 2014 at 179,140 FTE. Meanwhile, the number of staff working in community health services (including school nursing) was 1,000 (2.8%) lower at 35,210. Over the same period health visitor numbers, which peaked at 10,300 FTE in October 2015, also declined, dropping to 8,830 FTE in April 2017.
Figure 8: Change in adult hospital nursing and community nursing/health visiting staff in the NHS in England (index 100=October 2014), October 2014–April 2017
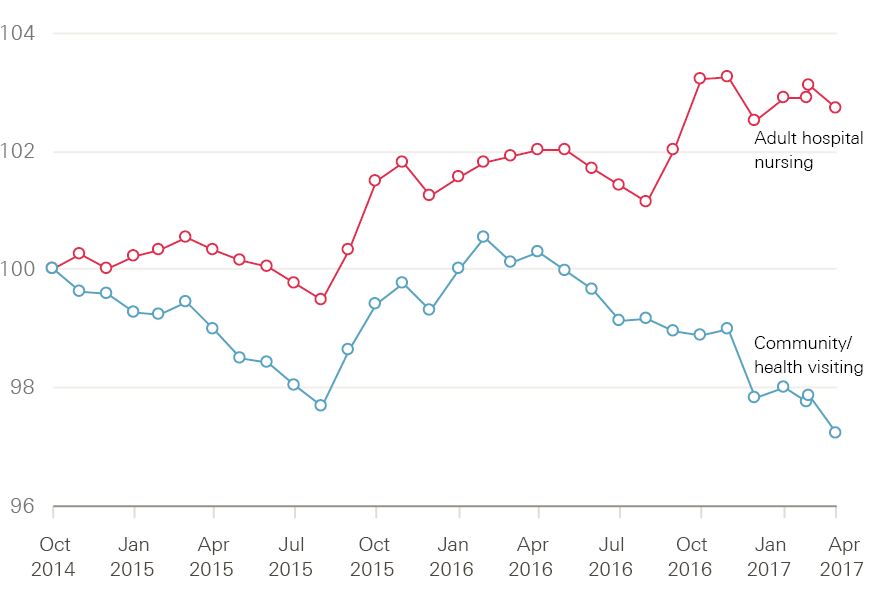
Source: NHS Digital, NHS HCHS monthly workforce statistics – April 2017, provisional statistics (July 2017).
Another area of community care that is reporting staff reductions is school nursing. Recent analysis of NHS staff data reported a 19% reduction in the number of school nurses between May 2010 and May 2017. An RCN survey of school nurses reported concerns about the ageing profile of the school nursing workforce, and identified key issues to be addressed including time and funding for continuing professional development, as well as clear job descriptions that match the role and activities undertaken.
Nursing numbers have not kept pace with the number of patients being treated in NHS hospitals. In 2011 there were 1.8 nurses for every bed day of patient care, with this dipping to 1.7 in 2012 and 2013. Decreases in length of stay and increases in the number of nurses led to recovery in 2014 and 2015 to almost the same level as in 2011, despite rising admissions. With recent data suggesting continued rising admissions and falling nurse numbers, unprecedented decreases in length of stay will be required to stop this hard work being undone and figures falling back to previous levels. It puts great pressure on the nursing workforce – resulting concerns among nurses about their capacity to deliver good care are a key factor in the retention challenges facing NHS trusts.
A new focus on the mental health workforce…
The other major policy focus for the NHS workforce in recent months has been mental health services. The recently published Mental health workforce plan for England commits the NHS to ‘establish 21,000 posts and employ 19,000 additional members of staff by 2020’ in mental health services, with 11,000 of these drawn from ‘traditional’ pools of professionally regulated staff (eg nurses, occupational therapists and doctors) and 8,000 in new roles (eg peer support workers, personal wellbeing practitioners, call handlers and nursing associates). The plan notes that the number of available posts in mental health for qualified nurses has fallen in recent years: in 2016 it was nearly 12% below the 2009 level. Improved retention, return-to-work programmes and international recruitment are all highlighted in the plan as part of the solution.
Key reported elements in the plan include:
- a ‘national programme of mental health staff retention’, led by NHS Improvement, estimated to ‘provide an increase of 6,000 working time equivalent staff in the system when measured against current trends’
- exploring the potential to improve access to NHS accommodation for mental health staff
- improving the mental health of the workforce
- supporting more flexible approaches to retirement.
Immediate responses to the announcement of the plan have focused on whether the staffing targets are achievable within the tight timeframe or are ‘simply an example of ambitious headline grabbing’. Questions have also been raised about whether the plan is properly informed by estimates of need, and if the overall mix of proposed new posts are the best blend to effectively meet service priorities. At this early stage, it appears that this may be another example where the approach to NHS workforce policy has been driven by the short-term and reactive approach that quotes targets and gains headlines, but gives insufficient attention to implementation challenges and costs.
…While demand for GPs keeps rising
The last few sections have focused on NHS workforce supply. They have shown a varying pattern across professions and sectors, but one dominated by evidence of slow down and even decline in staffing growth. By contrast, there is growing evidence from disparate sources that workload demands on general practice staff in England are continuing to outstrip capacity. For instance, figures published by NHS Digital show that the average number of patients per FTE GP (excluding locums) rose by an estimated 3.2% between 2014 and 2015 (to 1,679).
In an online survey undertaken by ICM on behalf of the British Medical Association and completed by more than 5,000 GPs, the majority (57%) of respondents described their workload as unmanageable and at times impacting quality and safe care. More than a quarter (27%) reported that workload is excessive and significantly prevents quality and safe care. Only 10% described their workload as manageable. The eighth national GP worklife survey in 2015 reported the lowest levels of job satisfaction among GPs since before the introduction of the 2004 GP contract, the highest levels of stress since the first survey in 1998, and an increase in the proportion saying that they intend to quit direct patient care within 5 years. The proportion of GPs aged under 50-years-old intending to quit direct patient care in the next 5 years rose from 8.9% in 2012 to 13.1% in 2015.
The latest results from the GP patient survey (July 2017) show that, while overall experiences remain broadly positive, services are not keeping pace with demand. Compared with the June 2012 survey, patients are now less likely to report good experiences of making appointments, less likely to say they did not wait too long when attending appointments, and less likely to say their doctor gave them enough time. The proportion saying it was not easy to get through to someone on the phone has risen from 18.5% to 27.9%.
Although the majority of patients (84.3%) say they were able to get an appointment to see or speak to someone the last time they tried, this figure continues a downwards trend – the comparable figure in June 2012 was 87.7%. Similarly, the proportion of respondents always or almost always seeing the GP they prefer has fallen from 65.3% to 55.6%. The proportion of patients waiting longer for appointments has increased. In June 2012, 12.8% of patients got an appointment a week or more after booking, and in July 2017 this had risen to 18.4% (both figures include patients who wanted to be seen a week or more later).
Other measures of NHS activity all point to increasing demand. Activity as measured by finished consultant episodes has continued to grow, rising from 18.8 million in 2014/15 to 19.8 million in 2016/17. Over the same period outpatient attendances rose from 89.3 million to 93.3 million, while A&E attendances grew from 20.5 million to 20.9 million.
§ A group of staff that includes health care assistants and dispensers.
Future NHS staff: applications to health professional education
Applications to study medicine and dentistry, and subjects allied to medicine (including nursing),¶ at UK universities peaked in 2014 and 2016 respectively (Figure 9). Applications to study medicine and dentistry fell by 10,000 (10.2%) in 2015 and have continued to decline, albeit more slowly, since then. There were 82,260 applications for entry to courses starting in 2017 – 15,500 fewer than in 2014. Applications to study subjects allied to medicine (including nursing) have also declined from their 2016 peak, which has coincided with the switch, in England, away from an NHS bursary funded scheme for these subjects. Applications to courses in subjects allied to medicine in 2017 are down by 15% (60,930 fewer) compared to 2016.
Figure 9: Number of applications to study medicine and dentistry and subjects allied to medicine at UK universities, 2013–17
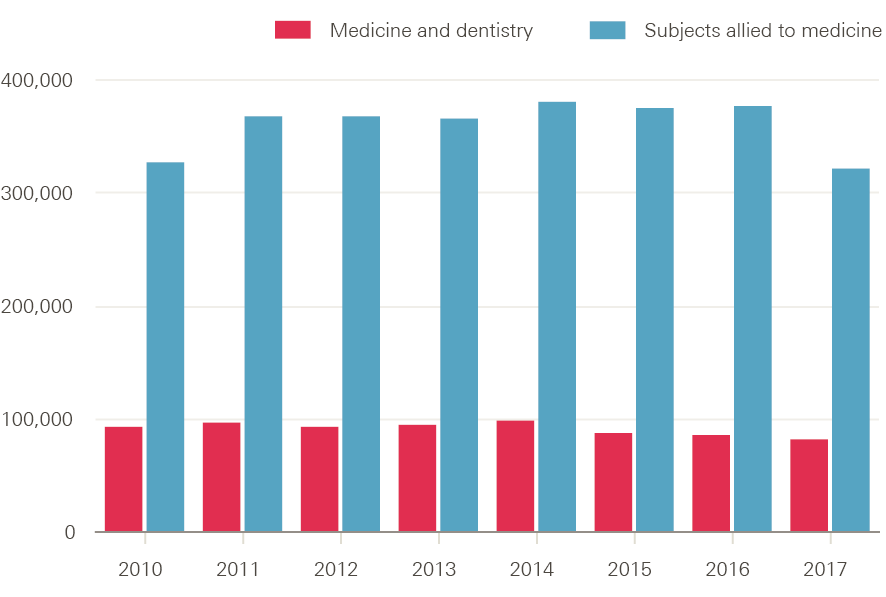
Source: UCAS statistical releases, 2017 cycle applicant figures – June deadline.
The falling number of applications for these two subject groups should be seen in the context of the overall decline (by around 4%) in the number of people applying to UK higher education courses. However, in both these cases, the number of applications far outstrips the number of places available (note that most applicants will make multiple applications). For medicine and dentistry, acceptances remained more or less constant up to 2016 (full data are not yet available for 2017), at just over 9,000. That is, there were about nine times as many applications to study medicine and dentistry as there were places available. In contrast, the number of acceptances for subjects allied to medicine have continued to grow, reaching 55,450 in 2016 (Figure 10) – roughly six applicants for each place.
Figure 10: Number of acceptances to study medicine and dentistry and subjects allied to medicine at UK universities, 2010–16
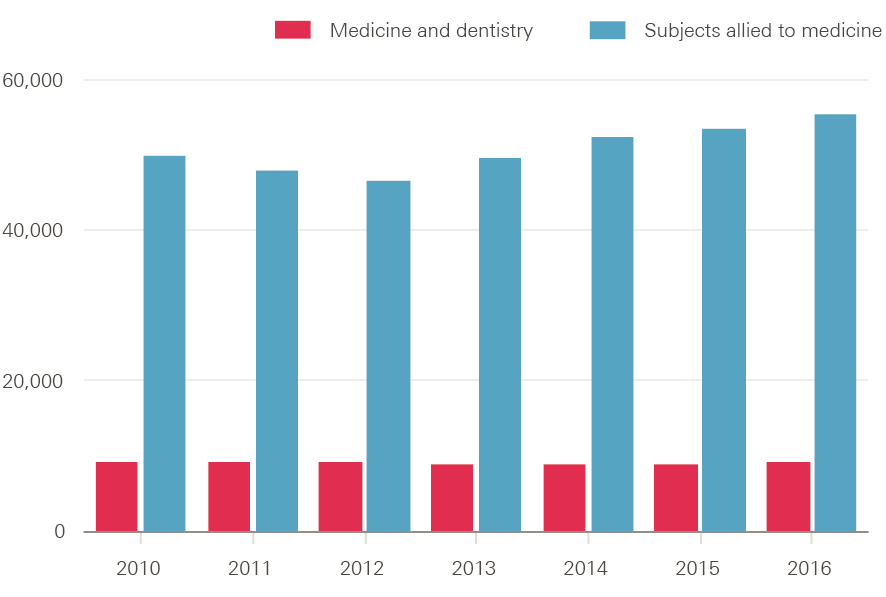
Source: UCAS End of eycle reports, 2016.
The impact that the removal of the NHS bursary for nursing courses in England has had on the number and profile of applicants is explored further in the first pressure point section of this report.
¶ Subjects allied to medicine covers a broad set of subjects including nursing, anatomy, pharmacy, nutrition and ophthalmics.
International comparisons and connections
This section presents a brief international backdrop for the report, then looks at recent international flows of health professionals. It uses data from the OECD to place current UK staffing levels into an international context. There are limits to the depth of analysis possible, due to differences in data collection and definitions in different countries, but a brief examination of OECD data suggests that the UK is slightly below the OECD average for both the doctor:population ratio and nurse:population ratio.
The UK: below OECD average for doctors and nurses
Data on doctors per 1,000 population (Figure 11) show the ratio in the UK is not dissimilar to many traditional comparator countries, such as the US, Canada, Ireland and New Zealand, but is lower than countries in Europe and Scandinavia.
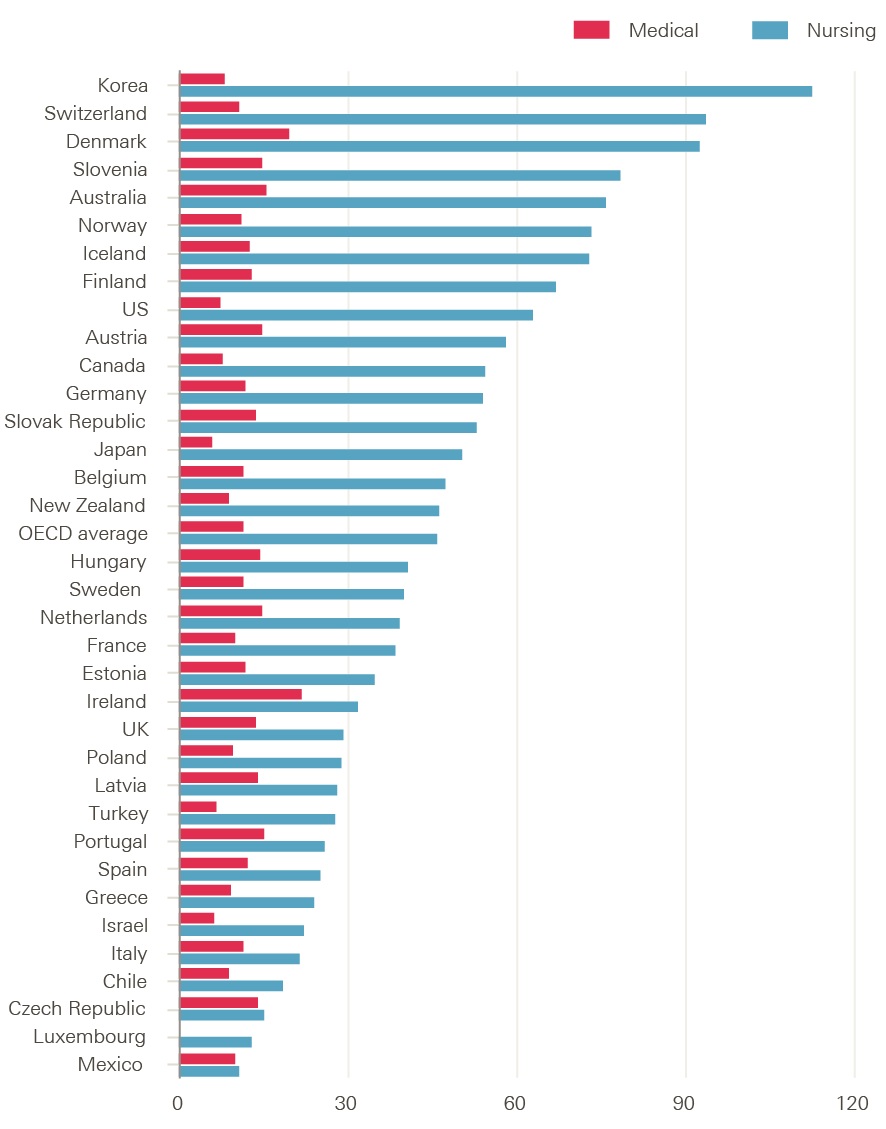
Data on nurses per 1,000 population (Figure 12) show the UK ratio is 8.2 nurses per 1,000 population. This is below the OECD average of 8.9, as well as below traditional comparator countries and those in Europe and Scandinavia.
Health care is labour intensive, and there is therefore a loose correlation between the amount spent on health and the relative size of the health workforce. While this in part can explain the below-average status of the UK on these two point-in-time indicators, there are also structural issues and funding trends to consider. These include evidence that the UK appears to train relatively fewer nurses than comparable OECD countries.
The UK: relatively low graduation rate of nurses
In common with several other OECD countries, such as Australia, the UK has seen rapid growth in the number of medical students in the last 10 to 15 years. In the UK context, this helps explain the relatively rapid growth in supply of newly qualified doctors in recent years, which is likely to continue if the recent commitment by DH to increase medical student numbers by 25% is fully implemented, and new expanded targets for international recruitment of GPs are met. OECD data on the number of health professional graduates (Figure 13) show the UK is now above the OECD average for medical graduates, at 13.5 per 100,000 population, which is significantly higher than the US, Canada and New Zealand.
In contrast, OECD data highlight that the UK is well below average in terms of the number of nursing graduates per 100,000 population. The UK figure is about 29 per 100,000 population. The OECD average is 45 per 100,000 population; the US figure is more than double the UK’s at 63 per 100,000 population; and Australia’s number is even higher, at 76 per 100,000 population. While some caution is required in making these international
comparisons, OECD estimates suggest the UK’s nurse graduate:population ratio has been static across the last 10 years, while there has been growth reported for many other OECD countries. Additional data from UCAS, analysed later in this report, also suggest that within the UK, England has had a markedly lower rate of applications to nursing education among 18-year-olds than the other three UK countries.
Figure 11: Number of doctors per 1,000 population in OECD countries, 2014 (or nearest year)
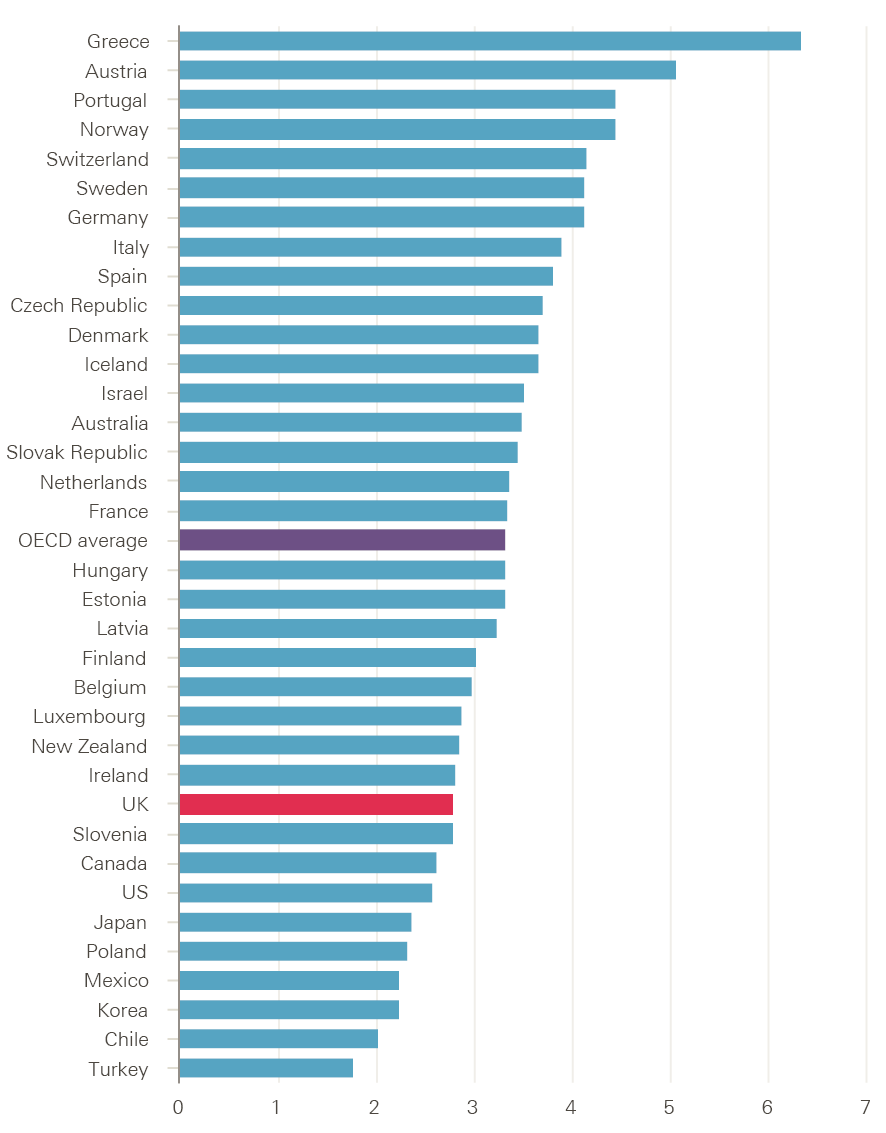
Source: OECD Health statistics 2017 (database), Health care resources.
Figure 12: Number of nurses per 1,000 population in OECD countries, 2014 (or nearest year)
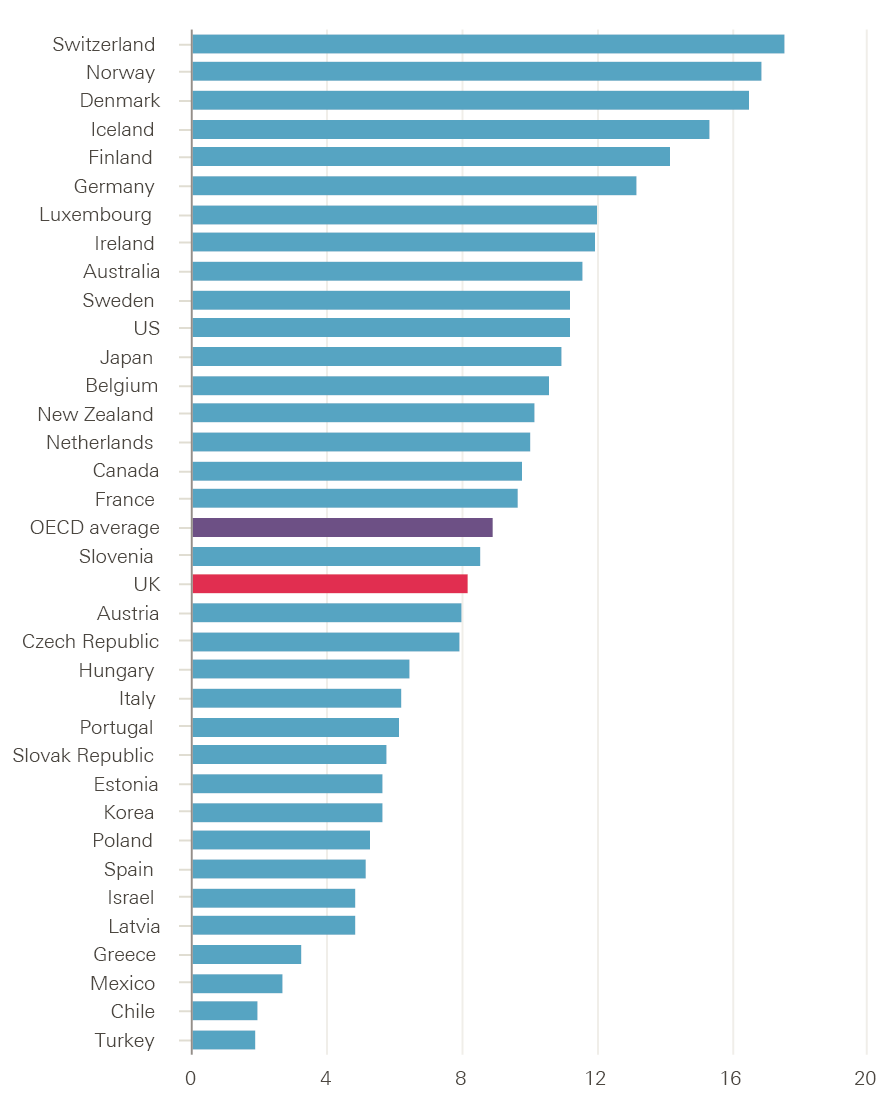
Source: OECD Health statistics 2017 (database), Health care resources.
Figure 13: Number of medical and nursing graduates per 100,000 population in OECD countries, 2014 (or nearest year)
Source: OECD Health statistics 2017 (database), Health care resources.
Inflows and Brexit
The UK has a long history of active international recruitment of health staff from other countries, as well as being a source of skilled practitioners for other, mainly high income, countries. In a report published in April 2017, the House of Commons estimated that there were over 60,000 people from EU countries outside the UK working in the NHS in England, with a further 90,000 working in adult social care. This represented 9.2% of NHS doctors and 7% of NHS nurses (these rates doubled in London).
Trends in inflow of EU nurse registrants show that these have replaced non-EU countries such as India and the Philippines as the main source of international nurses since about 2008 (Figure 14). There was particularly rapid growth in nurses registering from EU countries such as Spain, Portugal and Italy in the period from 2012/13 to 2016/17.
Figure 14: Number of EU and non-EU nurse registrations, 1990/91–2016/17
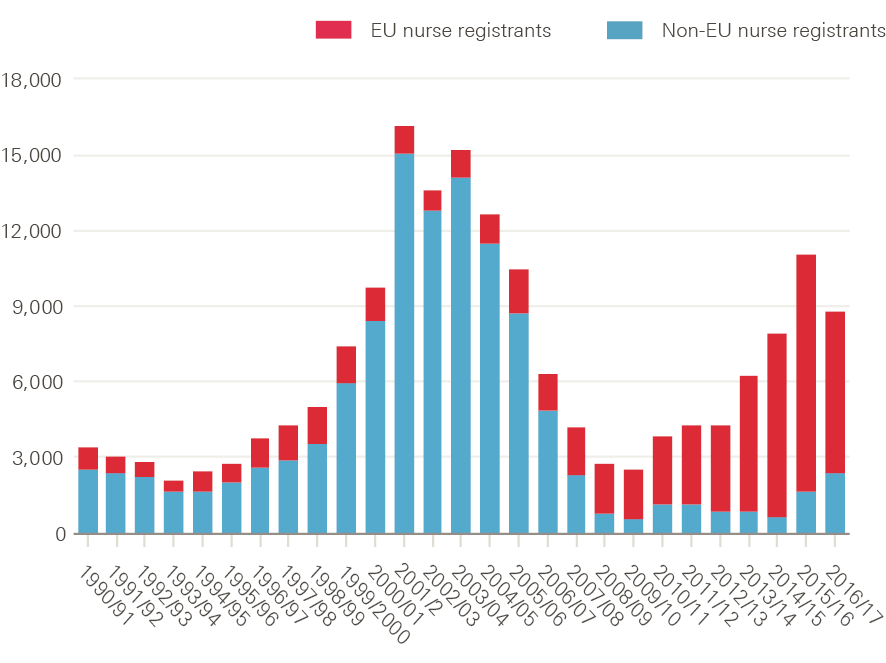
Source: Data obtained from Nursing and Midwifery Council.
This relatively high level of reliance on international staff has been brought into sharp relief by the UK’s vote in June 2016 to leave the EU. This has raised questions about the longer-term attractiveness of the UK as a place of work for EU nationals, as well as about retention rates of EU nationals already working in the NHS. It also came at the same time as new language requirements for international nurses were implemented. The combined impact proved dramatic. Monthly data on new registrants to the NMC show clear signs of a crash in inflow since the summer of 2016 (Figure 15). Similarly, 3,500 nurses with EU nationality left the NHS in 2016 – twice as many as in 2014. The new language test has now been reviewed by the NMC, with a change to include the Occupational English Test as an alternative.
Figure 15: New EU nurse registrations, January 2016–April 2017
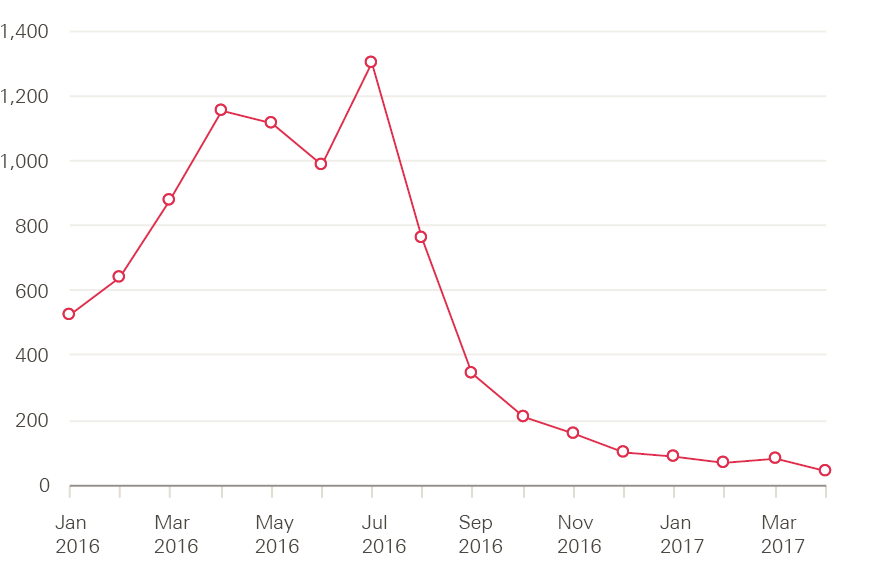
Source: Data obtained from Nursing and Midwifery Council.
Other recent surveys, of UK-based European doctors and medical students currently studying at Edinburgh University, indicate Brexit may have a negative impact on future retention of doctors in the UK. The most recent analysis of data from the General Medical Council (GMC) suggests that, in contrast to nurses, the supply of EEA doctors remains relatively stable. Although there has been a slight decrease in the number of EU doctors applying to join the UK medical register since the referendum, there have also been fewer EU doctors leaving the register over the same period, and an increase in applications by doctors from outside the EU.
Pressure point: Removal of the NHS bursary and its impact on student numbers
In 2016, the Department of Health (DH) announced that, from 1 August 2017, new nursing, midwifery and some pre-registration allied health students in England would no longer receive NHS bursaries. They must now access the student loan system in the same way as students of other higher education courses. DH claimed that this would reduce the risk that the number of student places available would be constrained by funding, and enable higher education institutions to provide sufficient places to meet expressed demand. It also said that this would, in turn, lead to an improvement in the supply of qualified health care graduates, as well as reduced reliance on agency and overseas staff. In its impact assessment, DH estimated that a total of 10,000 more places might be made available by the end of the current parliament. It also noted increased student motivation and better courses as further benefits of more directly linking study and its costs.
The annual number of places available on pre-registration nurse education courses has varied between around 16,000 and 23,000 over the past 20 years, with lows in the early part of this decade but small year-on-year increases since 2013/14. There is no doubt that expressed demand for these places has outstripped supply by a ratio of at least 2:1 (Figure 16). In 2016/17, for example, there were just over 43,800 applicants – who made a total of 188,000 applications – for the 20,741 funded places available.
Figure 16: Number of funded places and applicants to study nursing at university in England, 2013/14–2016/17
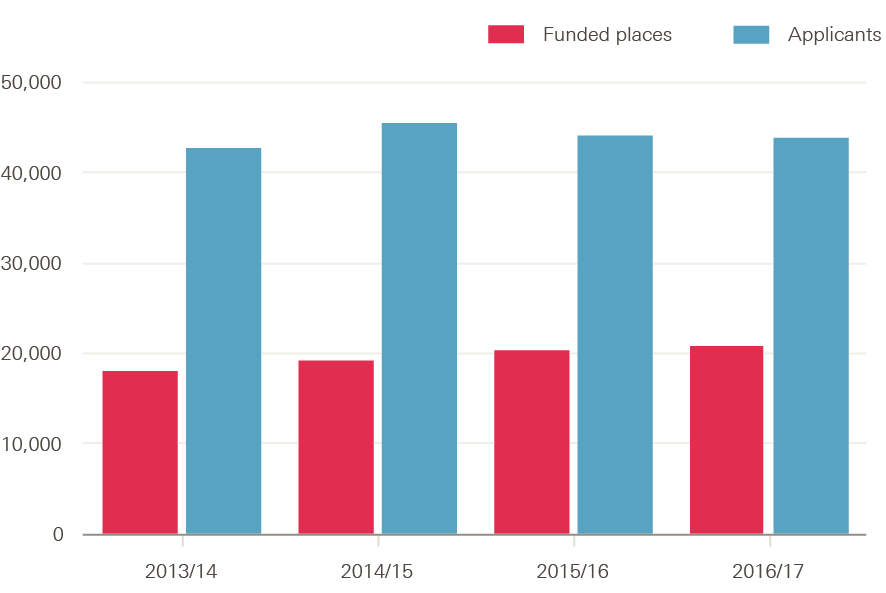
Source: UCAS end of cycle statistics, HEE commissioning and investment plan 2016/17.
Number of nursing student applicants in decline
The DH has recognised that predicting behavioural change is uncertain, but based on evidence from previous student funding reforms, assumed that while applications may dip ‘in the very short term, in the longer term, overall student numbers may increase’ as a result of the end of the bursary system. Whether previous student funding reform was a reasonable proxy for anticipating behaviour among potential nursing students remains to be seen, in part because the age and gender profile of nursing students is unlike that of any other group of students.
The release, in early 2017, of data by UCAS on the number of applicants to study nursing was greeted by predictable media headlines, such as: ‘Students turn backs on nursing degrees in wake of Government decision to axe NHS bursaries, official figures suggest’, ‘Nursing degree applications slump after NHS bursaries abolished’, and ‘Nursing degree applicants fall 23% in wake of bursary loss’.,,
Is it all about the end of the bursary?
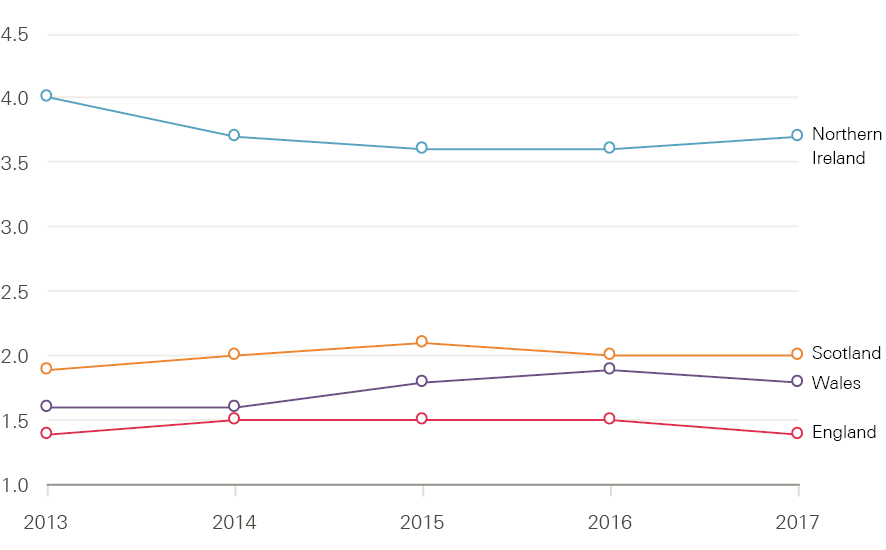
Although applicant numbers in England are down, by almost 23% to 40,060 according to the latest UCAS applicant data, a closer examination of the available data suggests that this is not simply due to the change in funding arrangements. The NHS bursary has been retained in Northern Ireland, Scotland and Wales** and yet all three countries have seen a decline – albeit smaller than in England – in the number of nursing applicants. The number of applicants is down by 10% in Wales compared with 2016, with reductions of 6% seen in Northern Ireland and 2% in Scotland. These reductions cannot be explained by the removal of the NHS bursary. It is also apparent that, with the exception of Wales, the decline in applicant numbers has been underway for a number of years (Figure 17). For example, numbers fell by nearly 1% in Scotland between 2014 and 2015 and by nearly 4% between 2015 and 2016. Similarly, in Northern Ireland there were 6% fewer applicants in 2014 and 2% fewer in 2015.
What is driving the changes in applicant numbers is complex and poorly understood. One contributing factor is the fall in the number of 18- and 19-year-olds across the UK since 2010. According to Office for National Statistics estimates, the number of female 18-year-olds in 2017 (92% of applicants to nursing are female) was 4.6% lower than in 2011. In other words, nursing is having to compete in a shrinking pool of qualified school leavers. However, this can only be a small part of the explanation since, unlike other subjects, those aged 18 and 19 make up a comparatively small share of the applicants to nursing (Figure 18). Indeed, figures for England show that applications from those aged under 20 had the smallest decline (13%) between 2016 and 2017.
Figure 17: Change in number of nursing student applicants in the UK by country, and the EU (index 100=2013), 2013–17
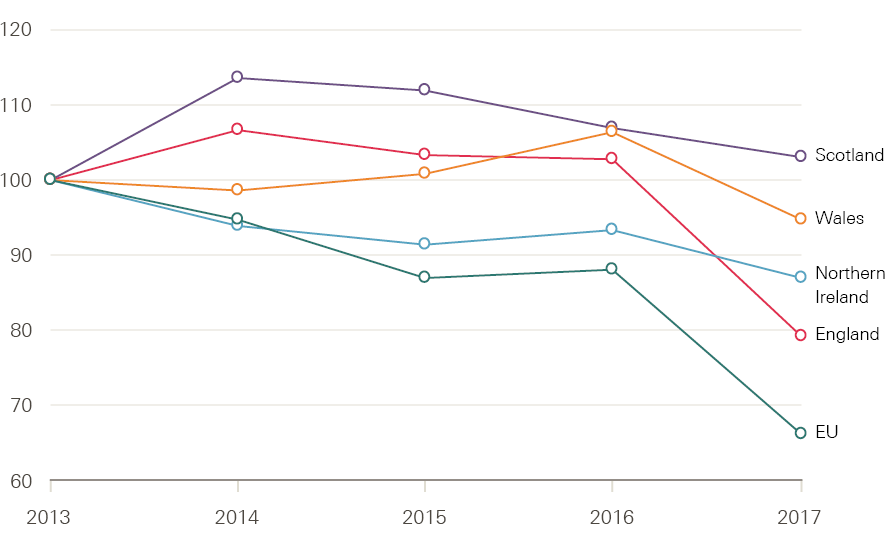
Source: Compiled from UCAS Undergraduate end of cycle data resources.
Figure 18: Applicants to nursing and non-nursing subjects in England by age (%), 2017
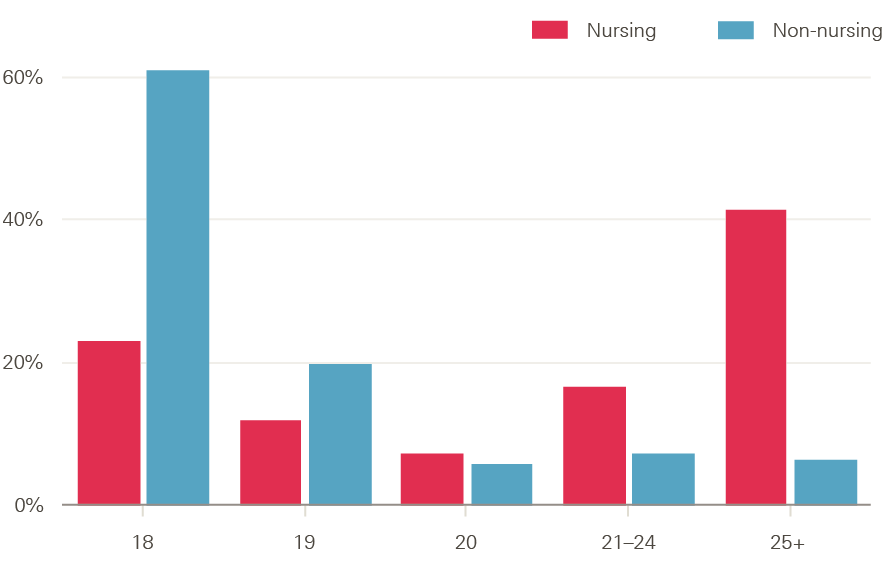
Source: Compiled from UCAS Undergraduate end of cycle data resources.
Drop in older applicants most substantial
The decline in applicant numbers has been particularly notable among older applicants (Figure 19) – it also started earlier. In England in 2017, applications from those aged 20–24 and 25–29 fell by 23% and 31% respectively. This may reflect the reduction in numbers of potential students in the age groups that nursing education has traditionally recruited from, because a growing proportion of this population has already been through higher education. Equally, it may reflect high rates of employment, pay differentials and the potential impact of future loan repayments on individuals who may already have a higher debt burden. The introduction of the nursing associate role and apprenticeship routes into the professions may also have acted to reduce the number of applicants wanting to pursue the degree route.
Figure 19: Change in number of nursing student applicants in England by age (%), 2013/14–2016/17
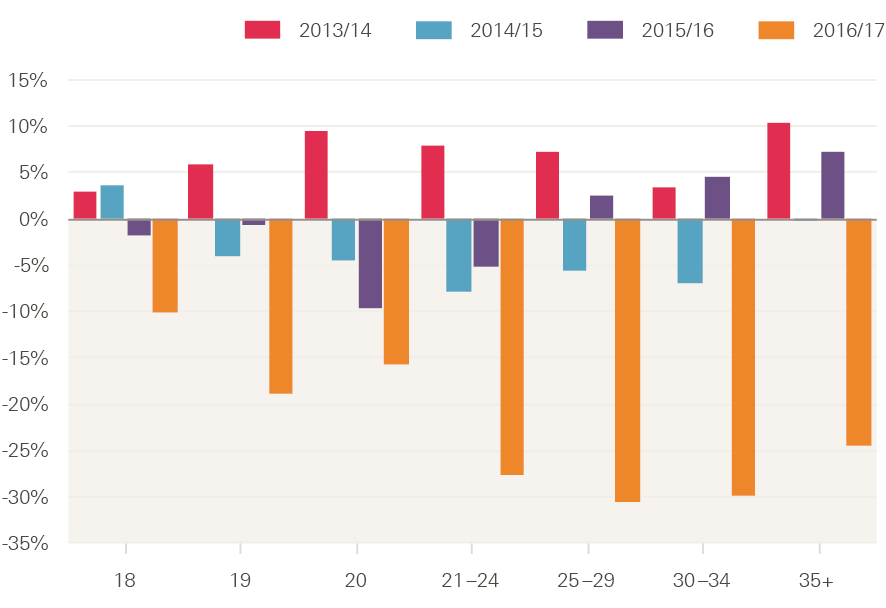
Source: Compiled from UCAS Undergraduate end of cycle data resources.
In addition to the change in the number of applicants from the UK, there has been a drop of almost 400 (23%) in the number of applicants from other EU member states. It should be noted that these numbers have seen a downwards trend since 2013 (when they peaked at about 1,910). In contrast, the number of applicants from outside the EU has increased by almost 200 (to 670) over the same period. Historically, very few applicants from outside the UK have been successful in getting a course place.
Consistency in re-appliers and cross-border applications?
Applicant figures include those applying for the first time, as well as ‘re-appliers’ (applicants who had applied through the UCAS scheme in a previous cycle). Just under one in five (19.4%) applicants in England are re-appliers – a proportion that has remained consistent over the last 5 years. In 2017, the number of re-appliers fell from 9,840 to 7,790 (Figure 20). The decline in applicant numbers has impacted both first-time applicants and re-appliers to a similar extent (23% and 21% respectively).
Figure 20: Number of first time and reapplying applicants for nursing courses in England, 2013–17
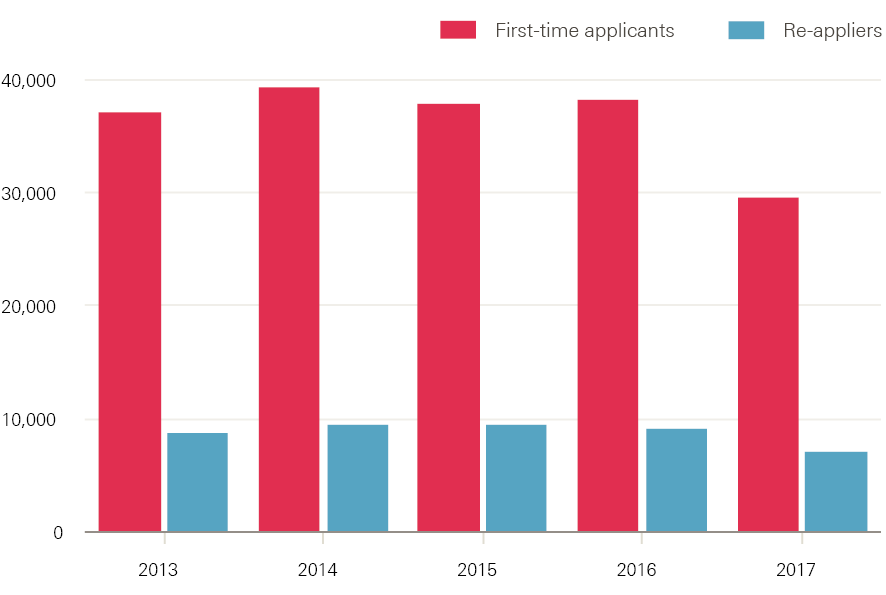
Source: Compiled from UCAS Undergraduate end of cycle data resources.
Further change can be seen in the level of cross-border applications. The proportion of applicants living in England who applied to institutions in Scotland or Wales has been fairly constant at about 7.5% (roughly 3,700 applicants). In 2017, the absolute number of cross-border applications fell but the share of applications from those living in England rose (to 8.1%), with about 2,440 applicants from England to courses in Wales and 800 to Scotland. Conversely, 17% (360) fewer applicants from Scotland or Wales applied to institutions in England.
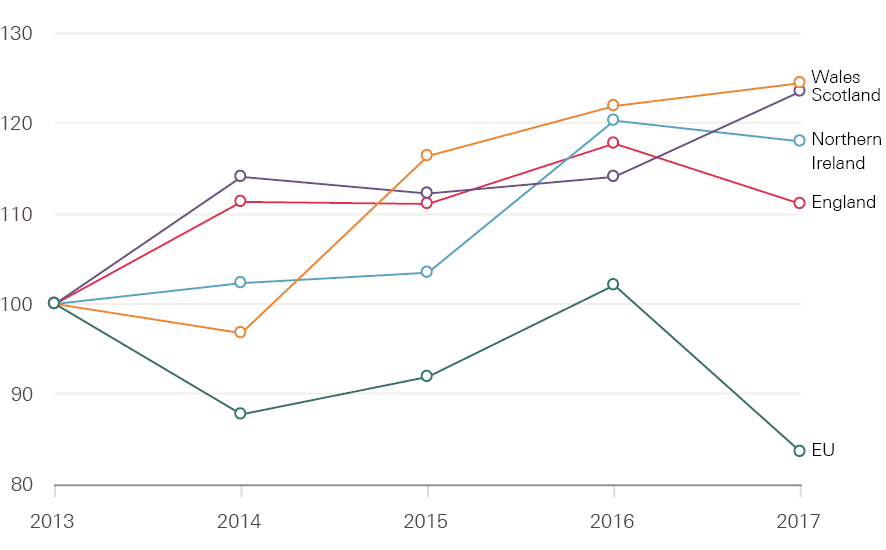
Application rates among 18-year-olds for nursing in England in 2017 represent about 1.4% of the available population according to data released by UCAS, having fallen from 1.5% in 2016. This is noticeably lower than in Wales (1.8%), Scotland (2.0%) and Northern Ireland (3.7%), suggesting there might be scope for growth (Figure 21).
Figure 21: Application rates for UK university nursing courses among 18-year-olds by country of residence, 2013–17
Source: Compiled from UCAS Undergraduate end of cycle data resources.
Intake trends vary across the UK
One consequence of the change in funding arrangements is that the number of places available is no longer known in advance. How many applicants have been accepted onto nursing courses will not be known until UCAS release the final 2017 end-of-cycle statistics in December 2017. However, in a circular to vice chancellors and principals setting out the decisions taken at its board meeting in March 2017, the Higher Education Funding Council for England stated that ‘We believe that these various elements of grant, combined with net tuition fee income, increase the funding levels for each professional area within scope for the reforms in 2017/18’.
All things being equal, we would expect that increase to translate into a rise in student intakes. However, it remains to be seen whether the rise will match the increases in Scotland (4.7%) or Wales (13%). As of 14 September 2017 (the most recent clearance statistics released by UCAS) the number of acceptances across the UK was 27,240 – just over 1,000 (3.6%) fewer than in 2016 but higher than in any other year (Figure 22). Some students are still holding offers. If these convert to placed students at a higher rate than in previous years then the size of this gap will be reduced. Reductions in the number of placed students from England (5.5%), Northern Ireland (2.7%) and the EU (19.2%) have been offset slightly by increases from Wales (3.2%), Scotland (8.5%) and non-EU countries (Table 1).
Initially then, it appears that the change in funding arrangements in England has led to a fall in student numbers rather than the anticipated increase, although that decline has not been as steep as some commentators anticipated on the basis of applicant numbers.
Figure 22: Change in numbers of placed applicants on UK university nursing courses by country of residence (index 100=2013), 2013–17
Source: UCAS, Statistical releases – Daily clearing analysis 2017, published 18 September.
Table 1: Number of placed applicants on UK university nursing courses by country of domicile 1 month after A-level results day, 2013–17
|
Country of domicile of applicant |
2013 |
2014 |
2015 |
2016 |
2017 |
Change |
|
|
Number |
% |
||||||
|
England |
18,620 |
20,660 |
20,670 |
22,040 |
20,820 |
-1,220 |
-5.5 |
|
Northern Ireland |
910 |
940 |
950 |
1,100 |
1,070 |
-30 |
-2.7 |
|
Scotland |
2,640 |
2,970 |
2,970 |
2,950 |
3,200 |
250 |
+8.5 |
|
Wales |
1,280 |
1,270 |
1,270 |
1,580 |
1,630 |
50 |
+3.2 |
|
EU |
510 |
440 |
440 |
520 |
420 |
-100 |
-19.2 |
|
Other |
60 |
60 |
80 |
60 |
100 |
40 |
+66.7 |
|
Total |
23,920 |
26,340 |
26,630 |
28,520 |
27,240 |
-1,010 |
-3.6 |
Source: UCAS, Statistical releases – Daily clearing analysis 2017, published 18 September.
In addition to the fall in student numbers, there has been a shift in the age profile of applicants from England. The number and proportion of 18-year-olds has risen from 19.1% in 2016 to 22.2% in 2017, while the figures for those aged 20 and over have declined. This is as a result of a 6% increase in the number of placed applicants who are under 20 and falls in those aged 20 to 24 and 25 and over, of 9% and 11% respectively (Figure 23). Whether this change is planned, or what consequences it might have, is unclear.
Figure 23: Age profile of placed applicants on nursing courses in England, 2013–17
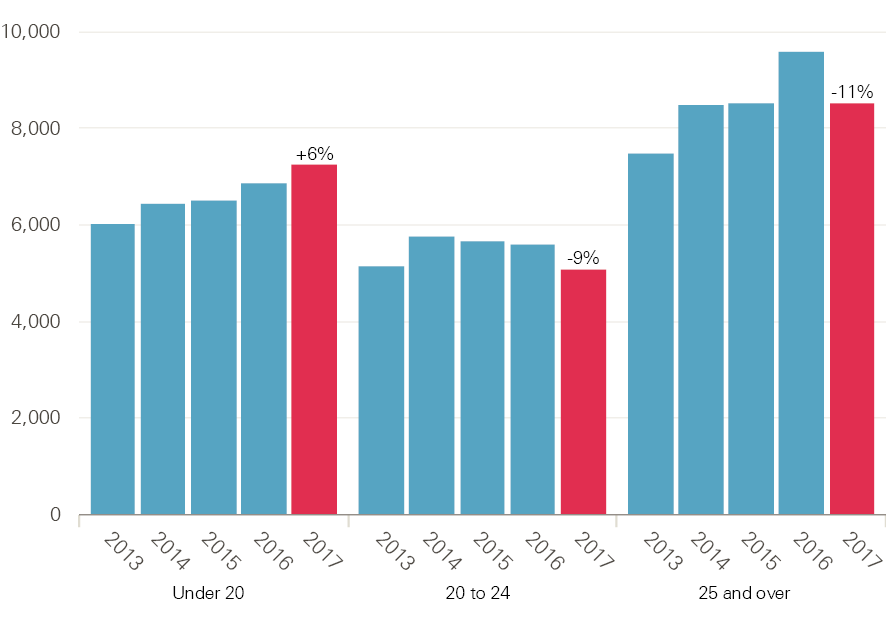
Source: UCAS, Statistical releases – Daily clearing analysis 2017, published 18 September.
Many student nurses do not complete their course
In addition to assessing the trends in numbers of applications and applicants to nurse education, another factor that requires close monitoring in order to have a full picture of the impact of the changes in pre-registration of nurses is the drop-out rate of those who begin an undergraduate nursing course, but fail to complete (‘attrition’). Previous analysis suggests that the rates are affected by selection processes, student access to finances, and the student experience during clinical placements. The mandate between the government and HEE for 2016/17 had stated that HEE would ‘continue to work with partners to improve retention of trainees, including reducing avoidable attrition from training programmes by 50% by 2017’.
Despite repeated calls for a standard analytical definition of attrition across the UK and a transparent approach to publishing attrition rates on each course and each institution, the only recent publicly available national source of comparative attrition data is a survey conducted by Nursing Standard, following a freedom of information request. This survey examined attrition using a simple definition: the percentage of students entering the course who did not complete 3 years later (although it should be noted that this will overestimate the overall attrition rate as some students defer and return at a later date). By this measure, the student nurse attrition rates across universities in England in the 3-year period from 2013 to 2016 varied from a low of 9% to a high of 44.5%. The overall UK average attrition rate was 25.1% – this had not changed significantly from the previous national surveys conducted in 2006, 2008 and 2010.
This analysis suggests that one in four students did not complete their course and therefore could not register to practice nursing at the 3-year mark. It will be important to monitor attrition rates to assess if the shift to a loan-based approach in England has any impact on completion rates, but this process will be hampered by a lack of common definition of attrition and an absence of transparency in the current reporting process.
What can be done to improve student nurse numbers?
The Health Foundation’s 2016 report on the NHS workforce argued that the shift to a student loan-based approach had the potential to increase student intakes, but that other factors were currently inhibiting the realisation of this potential. The report noted that the earnings potential for student nurses was relatively lower than in comparator countries such as Australia and the US, that funding should be made available to support older entrants and those with financial hardship, and that there would be a need to address the existing bottleneck of restricted availability of clinical placements. No policy intervention on these critical issues was taken, until well beyond the point in time that such action could have any significant impact.
This was the very late announcement by the government, on 9 August 2017, that it would fund additional clinical places for nurses, midwives and AHPs on courses starting from 1 August 2017. Subsequent detail and clarification in a letter issued by HEE on 16 August confirmed that funding would be made available for up to 1,500 additional clinical placements in England, for intakes in 2017 and early 2018, and that ‘work was underway’ to determine the funding allocation mechanism for 2018 onwards. This was a last-gasp response to a problem that was well known before the switch to the loan system, and could and should have been addressed much earlier in the application cycle. It was characterised by one commentator as being a ‘shambolic’ approach.
Analysis of the pattern of acceptances for the 2017/18 intake is further complicated by these late-in-the-day events. The drop in applicant numbers is undoubtedly a cause for concern. However, further analysis suggests the removal of the bursary is not the only cause and that the number of applicants was already on a downwards trend right across the UK. A more nuanced understanding is required if these trends are to be reversed. It is clear that the number of applicants is still significantly greater than the number of places that are available. One reason for this is that the limited funding available for the NHS bursary based approach was not the only constraint on the number of nurses that could be trained. As clearly demonstrated by recent events, there is also the question of the capacity of the NHS to provide clinical placements to match university intakes, and the ability of universities to improve student attrition rates.
** In Wales, the bursary has been retained but newly qualified nurses will be required to pay back the funding if they fail to work in the country as a nurse for at least 2 years after graduating.
Pressure point: Staff retention – holding on, or letting go?
Improving NHS staff retention has recently been flagged as a major objective by both HEE and NHS Improvement. This is understandable given the costs of staff replacement, and the loss of skills and knowledge when staff leave. The chief executive of HEE recently stated that staff retention was the biggest single challenge in tackling NHS workforce shortages.
Annual turnover in some NHS trusts was reportedly as high as one in three nurses moving jobs, with lack of flexible working opportunities flagged as the number one reason for nurses moving. This section reviews NHS trust-level data on staff leaving rates and indicators of retention to provide a clear backdrop for any future initiatives aimed at improving staff retention in the NHS in England.
Nurses leaving means supply is not matching demand
A starting point is to look at official estimates. HEE estimated that the NHS in England had 30,000 fewer FTE nurses than it needed in 2015 – equivalent to nearly one in 10 positions. HEE has since released its nurse supply modelling for 2016 to 2021 (replicated in Figure 24), through which it aims to highlight the impact of nurse leavers on achieving the overall nurse supply target. The HEE nurse supply modelling shows that, in 2016, there were still 29,000 vacancies across the NHS in England.
Figure 24: Nursing supply and demand, 2016–21
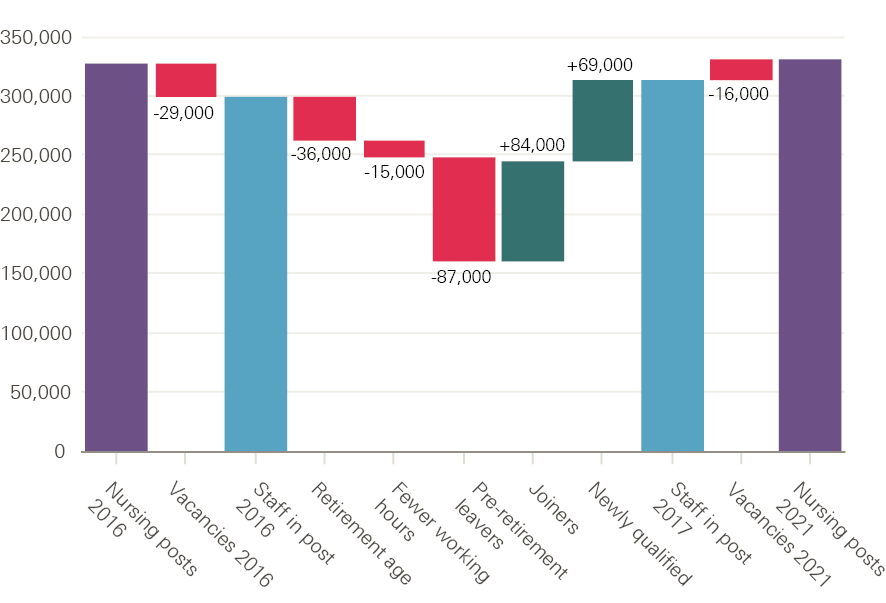
Source: Health Education England presentation, NHS Confederation Conference 2017.
HEE anticipates that 87,000 (non-retiring) nurses will leave the NHS between 2016 and 2021, resulting in the NHS requiring 84,000 joiners (over and above newly qualified staff). This gives a sense of the scale of the impact of nurse leavers on overall staff in post numbers, and highlights the extent of the replacement challenge. The relatively high turnover of NHS nurses contributes to a relatively short estimated average working life. This has been calculated at only 16 years for an NHS nurse, compared to around 24 years for AHPs and 28 years for pharmacists.
Significant variation in staff retention across England
In order to examine in more detail the data underpinning estimates on retention – which will shape any likely effective action on the issue – we now present new analysis on staff leavers and stability. The review of staff leavers (other than doctors, which are not included because of the rapid turnover of medical staff moving between postings) highlights that there is huge variation in turnover rates between NHS organisations (Figure 25). The median leaver rate in 2016/17 for the 221 NHS trusts across England for which data could be obtained†† was about 15% – of the almost 1 million staff in post at the beginning of 2016/17, just over 150,000 had left 1 year later (some will be moving to jobs elsewhere in the NHS). The leaver rate from NHS trusts varied from less than 10% to more than 30% across the NHS in England. Community providers had an above-average leaver rate, with a median of 18%.
Figure 25: Leaver rate from NHS trusts in England by provider type, 2016/17
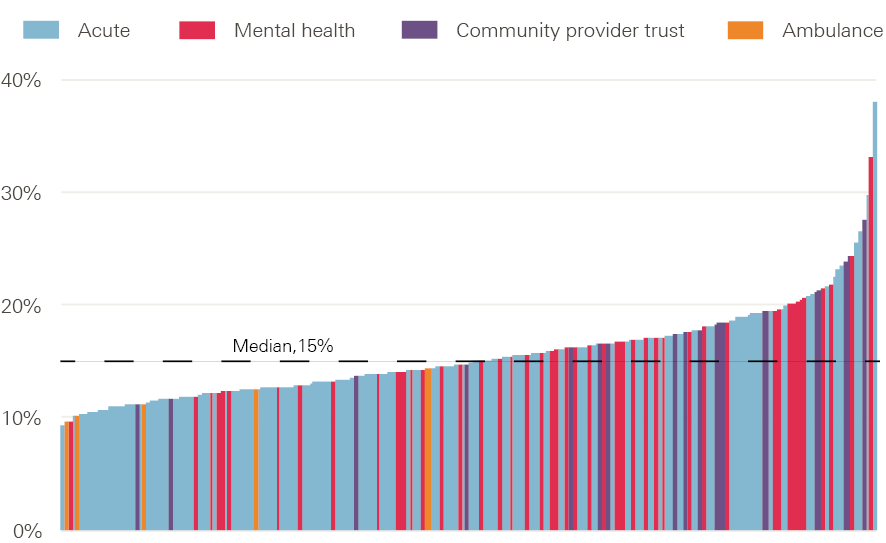
Note: Data from 221 trusts. Excludes doctors.
Source: NHS Digital. Provisional NHS (HCHS monthly workforce statistics, bespoke extract.
Despite concerns about shortfalls and vacancies in certain staff groups, in general most staff who leave are replaced, even if there may be some delay in sourcing a replacement. As a result, most NHS providers will not change headcount establishment‡‡ significantly over a year, but this apparent headline stability masks significant instability – some NHS trusts are effectively ‘running hard to stand still’, having to repeatedly replace staff leavers across a 12-month period (Figure 26).
This can lead to high rates of both staff joiners and leavers within some trusts. This is the driver of increased turnover costs, can lead to high use of temporary staff cover, and can impact on continuity of care. For example, one trust’s headcount increased by 4% with a 9% leaver rate in 2016/17, while another saw the same level of headcount increase with a leaver rate of 24%.§§
Figure 26: Leaver rate, joiner rate and net position from NHS trusts in England by provider, 2016/17
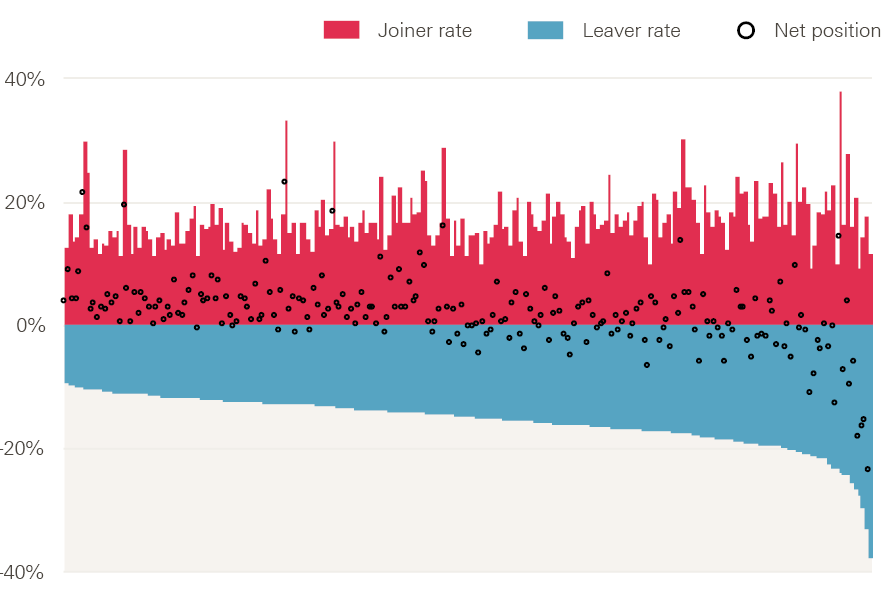
Note: Data from 221 trusts. Excludes doctors.
Source: NHS Digital. Provisional NHS HCHS monthly workforce statistics, bespoke extract.
There is also marked regional variation in leaver rates across England. Leaver rates are significantly higher in London: the three London regions (north west London, south London, and north central and east London) have the highest reported rates, which are well above the England average and much higher than rates in the north of England (Figure 27). For example, the rate for north west London (21%) is eight percentage points higher than that for Yorkshire and the Humber (13%).
Figure 27: Leaver rate from NHS trusts in England by region, 2016/17
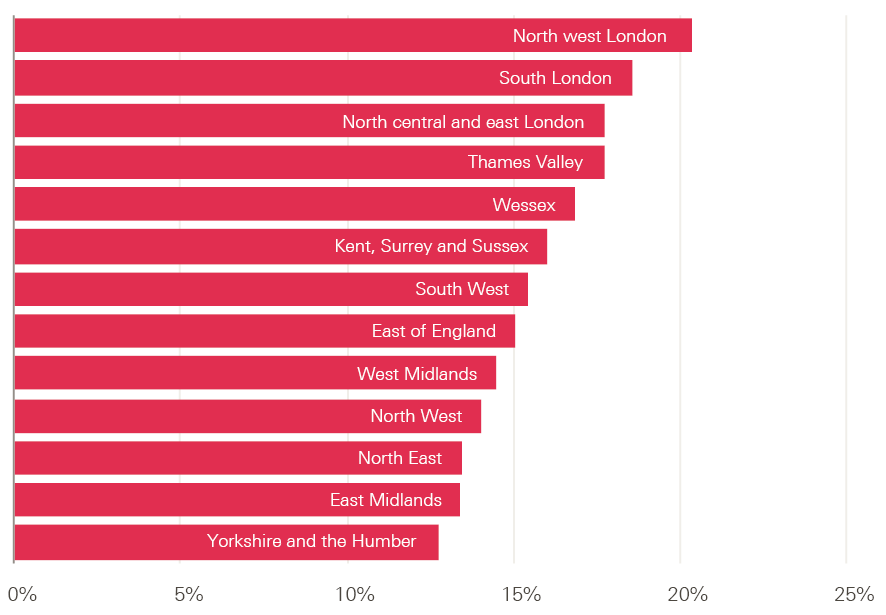
Note: Data from 221 trusts. Excludes doctors.
Source: NHS Digital. Provisional NHS HCHS monthly workforce statistics, bespoke extract.
Region and related differences in labour market conditions are factors that may explain varying levels of ability among trusts to retain staff. Other factors include variations in the type of trust (some have a very different staff profile to other trusts, eg ambulance trusts have fewer doctors and nurses), workforce profile and skill mix (some occupations, grades and roles are more mobile and transient than others), as well as the culture and management of the trust.
Falling stability across NHS trusts
Joiner, leaver and turnover data can give some indication of the varying challenges facing NHS trusts in managing the level and impact of staff movements. However, an alternative indicator that can provide deeper insight into retention is the stability index: an index indicating the percentage of staff that stay at an organisation over a defined period of time, usually expressed in annual terms.¶¶
Figure 28 illustrates the stability indices at NHS trust level across two years: 2010/11 and 2016/17 (these data exclude doctors in training). These two point-in-time measures give some sense of how patterns of workforce stability (and therefore retention) vary across the NHS in England, and if the stability rates have changed markedly at trust level between the two points in time. The figure shows if a trust had an above-average or below-average stability index in 2010/11 and whether this had changed in 2016/17. About half of all trusts were in the same quartile in 2016/17 as they were in 2010/11, indicating there was relatively little change in stability between the two points in time. Only about one in five trusts had below-average staff stability in 2010/11 but above-average staff stability in 2016/17, or vice versa.
Figure 28: Stability of staff in NHS trusts, 2010/11 and 2016/17
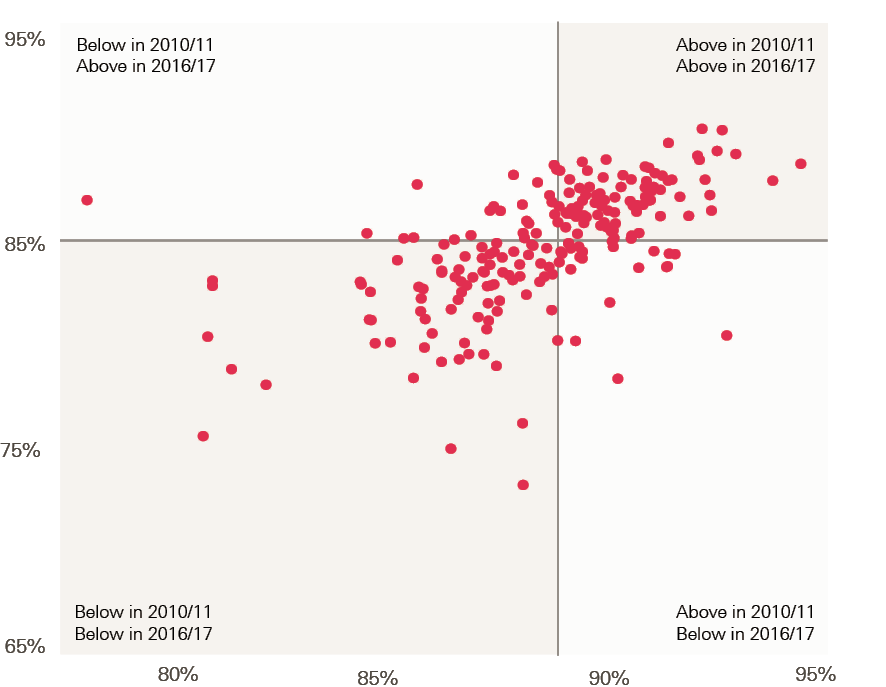
Note: Lines indicate median value. Doctors in training excluded.
Source: NHS Digital, Provisional NHS HCHS monthly workforce statistics, bespoke extract.
Overall, however, workforce stability in the 210 NHS trusts for which data are available has reduced since 2010/11 and was lower in 2016/17 – the median stability rate fell from 89% in 2010/11 to 85% in 2016/17 (Figure 29). Alongside this has come more variation. In 2010/11 most trusts were clustered around the median, but in 2016/17 the range was much larger (illustrated by the elongated distribution shown in Figure 29).
Figure 29: Change in workforce stability of trusts in England, 2010/11–2016/17
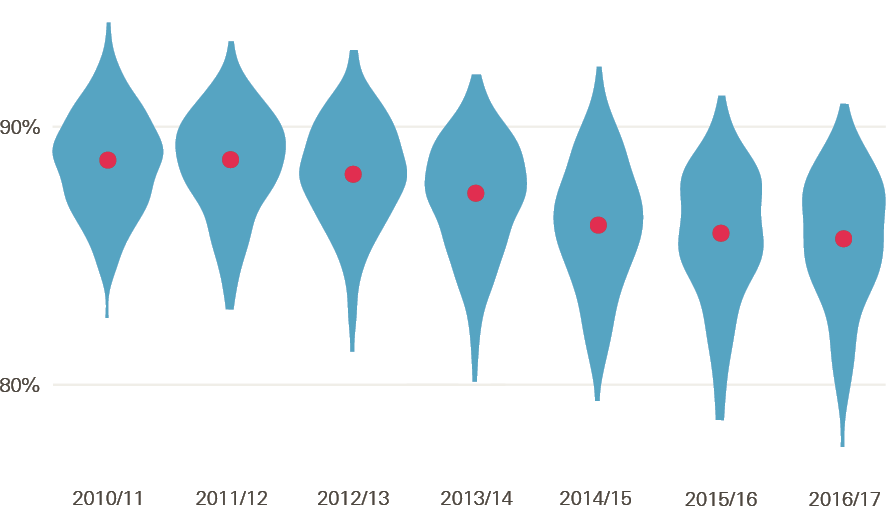
Note: Width indicates number of trusts, dots indicate median. Data from 210 trusts; a small number of outliers removed from graphic. Doctors in training excluded.
Source: NHS Digital, Provisional NHS HCHS monthly workforce statistics, bespoke extract.
There is great scope to improve retention
This section has provided some insight into national and regional NHS leaver and retention rates. It has highlighted that the available evidence suggests NHS workforce stability has reduced in recent years, and that there remains significant trust-level and regional variation. The potential impact of improving retention by reducing the leaver rate is significant. For example, targeted action to improve staff stability in trusts reporting higher leaver rates or lower stability could have substantial results. More focused action on trusts in the top quartile of leaver rates in 2016/17 to reduce their rate to the bottom quartile’s average rate of 13% would result in almost 30,000 fewer leavers in 1 year.
The focus on improving staff stability and retention, in part by reducing turnover, is understandable, given costs and impact of staff turnover on quality and continuity of care, and team cohesiveness. Turnover costs will vary depending upon the replacement strategy being adopted (eg replacing an experienced worker with a less experienced worker is likely to lead to lower productivity, in the short term at least) and are likely to also vary according to the clinical setting. Studies on staff turnover in the health sector of different countries vary in approach, but point to significantly increased costs and potentially negative impacts on care outcomes.,,,
One US study in 2004 estimated that total turnover costs for a hospital system employing 5,000 people was between $17m and $29m. Another study from the same year estimated a rough ‘rule of thumb’ that the cost of staff nurse turnover normally sat between 0.75 and 2.0 times annual salary, depending on seniority and specialty of the nurse. There are few studies examining the relationship between turnover and care outcomes, but there is some evidence of a relationship between higher turnover of nurses and nurse assistants and reduced care outcomes, using indicators such as pressure sores and urinary tract infection incidence.,,,
NHS Improvement has recently announced a programme ‘to improve staff retention in trusts across England and bring down the leaver rates in the NHS by 2020’. It reported that ‘A large proportion of leavers are for unknown reasons’. Initial data presented on NHS Improvement’s website show that flexible working ranked below pay, work–life balance and access to continued professional development as reasons for NHS staff leaving voluntarily. Details of the programme are not clear at the time of this report, but NHS Improvement indicates that the intention is to target NHS providers with above-average leaving rates for nurses, and support them to analyse their staff turnover and design tailored improvement plans targeting the drivers of staff leaving.
The potential for improved retention and reduced turnover to help NHS organisations contain costs and maintain quality has risen on the NHS national agenda in recent months. However, it is unrealised, in part because of an incomplete evidence base on patterns and reasons for leaving (or staying), as well as limited data that can be used to measure and track turnover or retention. And within the limited evidence base, there has also tended to be an analytical focus on leavers and reasons for leaving, rather than on stayers and what retains staff. Evidence on both is needed to enable organisations to effectively address retention concerns. The analytical approach to stability the Health Foundation has presented in this section can be used to help target efforts where they are most urgently required.
†† This excludes doctors, and trusts that merged, significantly changed provision or did not supply data, leaving 221 trusts (94% of all trusts).
‡‡ The total number of authorised posts allocated for a budget, which reflects the maximum number of FTE staff that can be employed.
§§ Some NHS trusts report variation in headcount due to service changes or services being moved to a different provider. This will be a factor in explaining high leaver or joiner rates in some trusts.
¶¶ The higher the stability index, the higher is staff retention. For instance, if trust X had 100 staff and 75 of those were still in post at the end of the year, then its 1-year stability index would be 75%.
Conclusions
This report has flagged that, by most indicators, workforce trends are going in a negative direction in the NHS in England. With projections of continued growth in demand for services, there is no evidence of recent substantial staffing growth in the main professions, with the exception of medical workforce numbers. And in primary care – a policy priority because of the growth in demand related to an ageing population – there are clear signs of real reductions in the availability of staff.
No one involved in shaping and supporting the NHS workforce in England sets out to create staff shortages, exacerbate their impact, or respond to them inefficiently. However, many of the indicators we have assessed in this report point to a worsening situation: increased demand, but flatlining or reduced professional staff numbers; likely reductions in the numbers of student nurses entering the profession; and reduced stability of NHS staff. The absence of a sustained and nationally focused approach to workforce policy and planning, compounded by the ongoing disconnect between identified staffing needs and funding decisions, prevents effective and coordinated policy interventions.
In the absence of policy coherence, there has been a series of isolated and often reactive responses to the highest-profile staffing concern of the moment. Examples include:
- despite well-known underlying challenges with placements and capacity, it was only at the last minute that an announcement was made of additional support for student health professional intakes in August 2017
- the announcement of 1,500 additional medical student places without full consideration of the overall impact on training budgets or future staff costs and mix
- the upward revision of targets for international GP recruitment, when current targets already appear overly ambitious
- the very ambitious targets for growth in the mental health workforce, with limited information about budgets or how roles will interface with current staff
- the recently reported delay, by at least 1 year, to full implementation of the nurse apprenticeship scheme – less than 50 apprentices were reported to be due to begin university courses in September 2017, well short of the 1,000 a year predicted by the government once the scheme was fully established. (The reported reason for the delay is that employers ‘are struggling to support new training routes designed to ease workforce shortages’.)
To effectively address the major internal and external challenges facing the NHS workforce in England there needs to be collective action, led by government, to sustain a strategic process that can adapt to external shocks, such as Brexit, and can shape and drive internal policy change.
Appendix
Staffing matters; funding counts used data from the annual NHS Non-medical workforce census as the basis for analysis of workforce trends because that provided the most complete long-term data then available. However, since 2009 the electronic staff record (ESR) system has been the main source of information on the NHS workforce in England. Comparing data on hospital and community health services (HCHS) doctors, nurses, health visitors and midwives from the two sources (Figures A and B) shows that, although the trends are broadly similar, there are significant differences in the numbers of full-time equivalent (FTE) staff in post in September each year between the two sources of data – the census count is substantially larger than the equivalent month of ESR data.
The NHS Non-medical workforce census ceased in September 2014. This report therefore uses the ESR monthly workforce statistics as the basis for analysis and presents trend data from October 2014 onwards. Since 2015, NHS Digital has made further changes to the published data. These are set out in detail in the Health and Social Care Information Centre’s statistical change notice published in March 2016. An equivalent statistical change notice has been issued relating to primary care workforce data.
Figure A: Number of hospital and community health services doctors in NHS employment (FTE), 2009–16
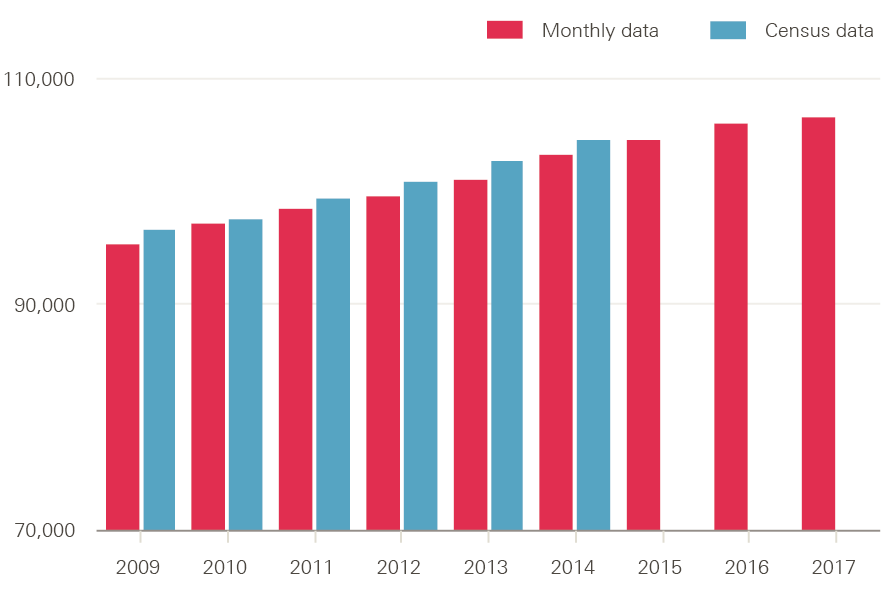
Source: NHS Digital, NHS non-medical workforce census, 2009–2014 and NHS Digital, NHS hospital and community health service (HCHS) monthly workforce.
Figure B: Number of nurses, health visitors and midwives in NHS employment (FTE), 2009–16
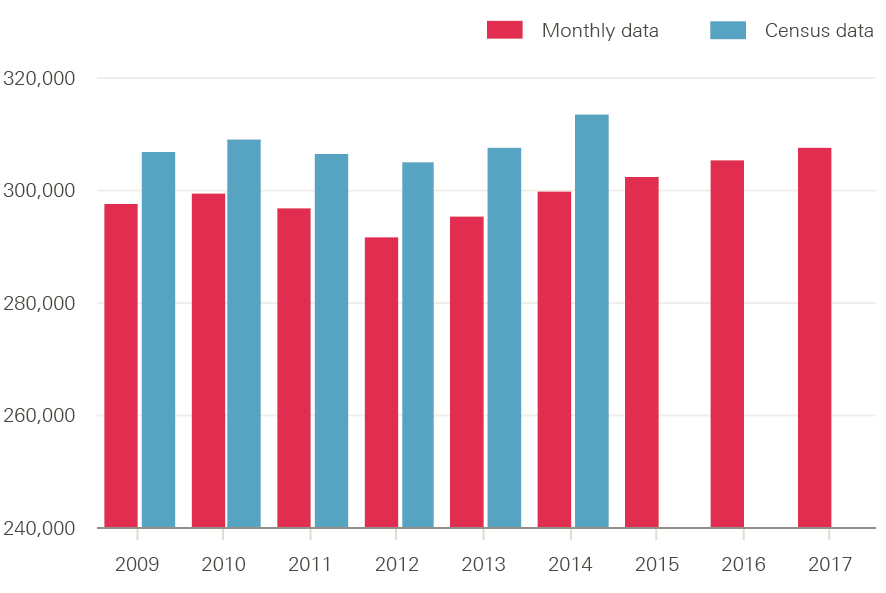
Source: NHS Digital, NHS non-medical workforce census, 2009–2014 and NHS Digital, NHS hospital and community health service (HCHS) monthly workforce.
References
- Health Education England. Raising the Bar. Shape of Caring: A Review of the Future Education and Training of Registered Nurses and Care Assistants. 2015. Available from: www.hee.nhs.uk/sites/default/files/documents/2348-Shape-of-caring-review-FINAL.pdf
- Buchan J, Seccombe I, Charlesworth A. Staffing matters; funding counts: Workforce profile and trends in the English NHS. Health Foundation; 2016. Available from: www.health.org.uk/publication/staffing-matters-funding-counts
- Buchan J, Seccombe I, Gershlick B, Charlesworth A. In short supply: pay policy and nurse numbers – Workforce profile and trends in the English NHS. Health Foundation; 2017. Available from: www.health.org.uk/publication/short-supply-pay-policy-and-nurse-numbers
- Merrifield N. Exclusive: Placement cash ‘too late’ to drive large student rise. Nursing Times. 5 October 2017. Available from: www.nursingtimes.net/news/education/exclusive-placement-cash-too-late-to-drive-large-student-rise/7021486.article
- Care Quality Commission. The state of health care and adult social care in England. 2017. Available from: www.cqc.org.uk/sites/default/files/20171010_stateofcare1617_report.pdf
- Hunt J. Jeremy Hunt: Nurse training increase will improve staffing and social mobility. Nursing Times. 3 October 2017. Available from: www.nursingtimes.net/opinion/expert-opinion/jeremy-hunt-nurse-training- increase-will-improve-staffing-and-social-mobility/7021523.article
- Merrifield N. Thousands more nursing associates and nurses to train each year, pledges Hunt. Nursing Times. 3 October 2017. Available from: www.nursingtimes.net/news/education/thousands-more-nursing-associates-and-nurses-to-train-each-year-pledges-hunt/7021509.article?blocktitle=Today%27s-headlines&contentID=18932
- Health Education England. Stepping forward to 2020/21: The mental health workforce plan for England. 2017. Available from: www.hee.nhs.uk/sites/default/files/documents/CCS0717505185-1_FYFV%20Mental%20health%20workforce%20plan%20for%20England_v5%283%29.pdf
- Department of Health. Expansion of Undergraduate Medical Education: Government Response to Consultation. 2017. Available from: www.gov.uk/government/uploads/system/uploads/attachment_data/file/636527/Expansion_undergraduate_medical_education_consulation-response__2_.pdf
- Rimmer A. Plan for army-style conscription of doctors is reconsidered. BMJ. 2017;358. Available from doi: https://doi.org/10.1136/bmj.j3839
- Department of Health. Expanding undergraduate medical education. Impact Assessment No: DH8080. 2017. Available from: www.gov.uk/government/uploads/system/uploads/attachment_data/file/636545/Expansion_undergraduate_medical_education_financial_impact_assesment.pdf
- Lafond S, Charlesworth A, Roberts A. A year of plenty? An analysis of NHS finances and consultant productivity. Health Foundation; 2017. Available from: www.health.org.uk/publication/year-of-plenty
- World Health Organization. Increasing access to health workers in remote and rural areas through improved retention: Global policy recommendations. 2010. Available from: www.who.int/hrh/retention/guidelines/en
- Keogh K. RCN warns nine in ten largest NHS hospitals short of nurses. Nursing Standard. 14 August 2017. Available from: https://rcni.com/primary-health-care/newsroom/news/rcn-warns-nine-ten-largest-nhs-hospitals-short-of-nurses-93396
- NHS England. General practice forward view. 2016. Available from: www.england.nhs.uk/wp-content/uploads/2016/04/gpfv.pdf
- Rimmer A. International recruitment scheme brings 38 GPs to NHS. BMJ. 2017;358. Available from doi: https://doi.org/10.1136/bmj.j3462
- NHS England. GP numbers set to receive major boost as NHS England acts to expand international recruitment. 22 August 2017. Available from: www.england.nhs.uk/2017/08/gp-numbers-set-to-receive-major-boost-as-nhs-england-acts-to-expand-international-recruitment/?utm_source=feedburner&utm_medium=email&utm_campaign=Feed%3A+NHSCBoard+28NHS+England29
- Plimmer G. Search for doctors set to cost NHS £100m in agency fees. Financial Times. 31 August 2017. Available from: www.ft.com/content/757ddc58-8d6b-11e7-a352-e46f43c5825d
- Matthews-King M. GPs could face huge tax bill as inflation pushes pension pots over annual limits. Pulse. 4 September 2017. Available from: www.pulsetoday.co.uk/your-practice/practice-topics/pensions/gps-could-face-huge-tax-bill-as-inflation-pushes-pension-pots-over-annual-limits/20035213.article
- The Queen’s Nursing Institute. General practice nursing in the 21st century: A time of opportunity. 2015. Available from: www.qni.org.uk/wp-content/uploads/2016/09/gpn_c21_report.pdf
- Ipsos MORI Research. The recruitment, retention and return of nurses to general practice nursing in England. 2016. Available from: www.england.nhs.uk/wp-content/uploads/2017/07/recruitment-retention-return-of-nurses-to-general-practice.pdf
- NHS England. 10 point plan sets out actions to deliver General Practice Nursing workforce for the future. 27 July 2017. Available from: www.england.nhs.uk/2017/07/10-point-plan-sets-out-actions-to-deliver-general-practice-nursing-workforce-for-the-future
- Connett D. School nurse shortage ‘putting children’s lives at risk’. The Guardian. 25 August 2017. Available from: www.theguardian.com/education/2017/aug/25/school-nurse-shortage-putting-childrens-lives-at-risk
- Royal College of Nursing. RCN School Nurse Survey 2016. 2016. Available from: www.rcn.org.uk/-/media/royal-college-of-nursing/documents/forums/children-and-young-people/staying-healthy-forum/rcn-survey-of-school-nurses-2016.pdf
- Iacobucci G. Is it possible to recruit 21,000 extra staff for mental health services? BMJ. 2017;358. Available from doi: https://doi.org/10.1136/bmj.j3880
- ICM. British Medical Association Survey of GPs in England, October–November 2016. Available from: www.bma.org.uk/collective-voice/influence/key-negotiations/training-and-workforce/urgent-prescription-for-general-practice/key-issues-survey#Workload
- Gibson J, Checkland K, Coleman A, et al. Eighth National GP Worklife Survey. Policy Research Unit in Commissioning and the Health Care System; 2015. Available from: www.population-health.manchester.ac.uk/healtheconomics/research/Reports/EighthNationalGPWorklifeSurveyreport/EighthNationalGPWorklifeSurveyreport.pdf
- NHS England. GP Patient Survey national report. 2017. Available from: https://gp-patient.co.uk/SurveysAndReports
- UCAS. UCAS 30 June deadline for UK higher education shows UK applicants down 4% and EU applicants down 5%. 12 July 2017. Available from: www.ucas.com/corporate/news-and-key-documents/news/ucas-30-june-deadline-uk-higher-education-shows-uk-applicants-down-4-and-eu-applicants-down-5
- House of Commons Health Committee. Brexit and health and social care—people & process. Eighth Report of Session 2016–17. 28 April 2017. Available from: www.publications.parliament.uk/pa/cm201617/cmselect/cmhealth/640/640.pdf
- Torjesen I. Four in 10 European doctors may leave UK after Brexit vote, BMA survey finds. BMJ. 2017;356:j988. Available from doi: https://doi.org/10.1136/bmj.j988
- Borchert R, Le H, Ritchie C. Brexit, the junior doctor contract, and medical student intentions. The Lancet. 2017;2(7):e306. Available from doi: http://dx.doi.org/10.1016/S2468-2667(17)30097-X
- Lintern S. Exclusive: Fall in EU doctors countered by influx of global medics. Health Service Journal. 31 July 2017. Available from: www.hsj.co.uk/workforce/exclusive-fall-in-eu-doctors-countered-by-influx-of-global-medics/7020221.article
- Department of Health. Reforms to funding and financial support for nursing, midwifery and AHP Bursary students. Impact Assessment No: DH2004. 21 July 2016. Available from: www.gov.uk/government/uploads/system/uploads/attachment_data/file/552197/NHS_Bursary_EIA.pdf
- Turner C. Students turn backs on nursing degrees in wake of Government decision to axe NHS bursaries, official figures suggest. The Telegraph. 2 February 2017. Available from: www.telegraph.co.uk/education/2017/02/02/students-turn-backs-nursing-degrees-wake-government-decision
- Adams R. Nursing degree applications slump after NHS bursaries abolished. The Guardian. 1 February 2017. Available from: www.theguardian.com/education/2017/feb/02/nursing-degree-applications-slump-after-nhs-bursaries-abolished
- Ford S. Nursing degree applicants fall 23% in wake of bursary loss. Nursing Times. 2 February 2017. Available from: www.nursingtimes.net/news/education/nursing-degree-applicants-fall-23-in-wake-of-bursary-loss/7015313.article
- Office for National Statistics. Population estimates for UK, England and Wales, Scotland and Northern Ireland. 2017. Available from: www.ons.gov.uk/peoplepopulationandcommunity/populationandmigration/populationestimates/bulletins/annualmidyearpopulationestimates/mid2016
- Higher Education Funding Council for England. Funding for universities and colleges for 2017–18: Board decisions (Circular letter 06/2017). 15 March 2017. Available from: www.hefce.ac.uk/pubs/year/2017/CL,062017
- Gething V. Written Statement – Education Commissioning 2017/18. 20 February 2017. Available from: http://gov.wales/about/cabinet/cabinetstatements/2017/educationcommissioning/?lang=e
- Department of Health. Delivering high quality, effective, compassionate care: Developing the right people with the right skills and the right values. A mandate from the Government to Health Education England: April 2016 to March 2017. 2016. Available from: www.gov.uk/government/uploads/system/uploads/attachment_data/file/559940/HEE_mandate_2016-17_acc.pdf
- Jones-Berry S. Student drop out rates put profession at further risk. Nursing Standard. 2017;32(2):12-13. Available from doi: http://dx.doi.org/10.7748/ns.32.2.12.s13
- Department of Health. 1,500 extra medical undergraduate places confirmed. 9 August 2017. Available from: www.gov.uk/government/news/1500-extra-medical-undergraduate-places-confirmed
- Health Education England. Clinical placement funding. 15 August 2017. Available from: https://hee.nhs.uk/news-blogs-events/hee-news/clinical-placement-funding
- Scott G. ‘Politics first, strategy later’ fails in workforce planning. Nursing Standard. 2017;31(52):3. Available from doi: http://dx.doi.org/10.7748/ns.31.52.3.s1
- Hodgson C. Retention is the biggest workforce challenge facing the NHS says HEE chief Ian Cumming. Health 21. 16 June 2017. Available from: www.health21.org.uk/2017/06/16/retention-is-the-biggest-workforce-challenge-facing-the-nhs-says-hee-chief-ian-cumming
- NHS Confederation. Look after current staff to secure the future NHS workforce, says Ian Cumming. 15 June 2017. Available from: www.nhsconfed.org/news/2017/06/confed17-ian-cumming
- Personal Social Services Research Unit. Unit Costs of Health and Social Care 2016. University of Kent; 2017. Available from: www.pssru.ac.uk/project-pages/unit-costs/2016/#sections
- North N, Leung W, Ashton T, Rasmussen E, Hughes F, Finlayson M. Nurse turnover in New Zealand: costs and relationships with staffing practises and patient outcomes. Journal of Nursing Management. 2013;21(3):419–28. Available from doi: http://dx.doi.org/10.1111/j.1365-2834.2012.01371.x
- Duffield CM, Roche MA, Homer C, Buchan, J, Dimitrelis S. A comparative review of nurse turnover rates and costs across countries. Journal of Advanced Nursing. Dec;70(12):2703–12. Available from doi: http://dx.doi.org/10.1111/jan.12483
- Roche MA, Duffield CM, Homer C, Buchan, J, Dimitrelis S. The rate and cost of nurse turnover in Australia. Collegian. 2015;22(4):353–8. Available from doi: http://dx.doi.org/10.1016/j.colegn.2014.05.002
- Li Y, Jones CB. A literature review of nursing turnover costs. Journal of Nursing Management. 2013;21(3):405–18. Available from doi: http://dx.doi.org/10.1111/j.1365-2834.2012.01411.x
- Waldman J, Kelly F, Arora S, Smith H. The shocking cost of turnover in health care. Health Care Management Review. 2004;29(1):27. Available from: www.ncbi.nlm.nih.gov/pubmed/14992479
- Bland Jones, C. The costs of nurse turnover: part 1: an economic perspective. Journal of Nursing Administration. 2004;34(12):562–70. Available from: www.ncbi.nlm.nih.gov/pubmed/15632752
- Yeatts DE, Seward RR. Reducing turnover and improving health care in nursing homes: the potential effects of self-managed work teams. Gerontologist. 2000;40(3):358–63. Available from: www.ncbi.nlm.nih.gov/pubmed/10853530
- Park SH, Boyle DK, Bergquist-Beringer S, Staggs VS, Dunton NE. 2014. Concurrent and lagged effects of registered nurse turnover and staffing on unit-acquired pressure ulcers. Health Services Research. 2014;49(4):1,205–25. Available from doi: http://dx.doi.org/10.1111/1475-6773.12158
- Trinkoff AM, Han K, Storr CL, Lerner N, Johantgen M, Gartrell K. Turnover, staffing, skill mix, and resident outcomes in a national sample of US nursing homes. Journal of Nursing Administration. 2013;43(12):630–36. Available from doi: http://dx.doi.org/10.1097/NNA.0000000000000004
- NHS Improvement. Securing a sustainable NHS workforce for the future. 29 June 2017. Available from: https://improvement.nhs.uk/news-alerts/securing-sustainable-nhs-workforce-future
- Mckew M. A scheme off to a slow start. Nursing Standard. 2017;31(52):12–3. Available from: https://doi.org/10.7748/ns.31.52.12.s12
- Merrifield N. Exclusive: New nursing apprenticeship schemes hit by ‘delays’ and ‘uncertainties’. Nursing Times. 8 September 2017. Available from: www.nursingtimes.net/news/education/exclusive-new-nursing-apprenticeships-hit-by-delays/7021114.article
- Health and Social Care Information Centre. Statistical Change Notice relating to NHS Hospital and Community Health Service in England workforce statistics. 18 March 2016. Available from: http://content.digital.nhs.uk/media/20446/Statistical-Change-Notice-Relating-to-NHS-HCHS-in-England-Workforce-Statistics/pdf/Statistical_change_notice_relating_to_NHS_HCHS_in_England_workforce_statistics.pdf
- Health and Social Care Information Centre. Statistical Change Notice relating to General and Personal Medical Services in England workforce statistics. 18 March 2016. Available from: http://content.digital.nhs.uk/media/20447/Statistical-Change-Notice-Relating-to-General-Practice-In-England-Workforce-Statistics/pdf/Statistical_change_notice_relating_to_General_Practice_in_England_workforce_statistics.pdf