Key points
- This briefing presents the findings of an evaluation into the effects of providing enhanced support for older people living in care homes in Sutton, south London. Specifically, the Improvement Analytics Unit examined whether the enhanced support had a discernible effect on hospital utilisation for new residents who moved into one of 28 residential and nursing care homes in Sutton between January 2016 and April 2017.
- The enhanced support was commissioned by the Sutton Homes of Care vanguard from March 2015 for all care homes within the Sutton clinical commissioning group’s (CCG) area. It was organised around three priority areas (or ‘pillars’). The first pillar was a series of measures aimed at improving integrated care, and included the hospital transfer pathway (the ‘Red Bag’ scheme) and weekly health and wellbeing reviews. The second pillar supported ongoing education and development for care home staff, for example through e-learning on continence care, dementia care and person-centred thinking. The third pillar promoted quality assurance and safety, for example through a joint intelligence group to share information among local health and care partners and a dashboard to benchmark care homes performance.
- The support offered by Sutton Homes of Care consisted of multiple initiatives carried out at different times in different ways and degrees of coverage to different care homes. While some elements of the support were available to all homes, nursing homes were initially the focus of the intervention from November 2015 to July 2016, with residential care homes receiving more attention from November 2016. We examined hospital utilisation data up to April 2017.
- The Sutton residents were compared with a matched comparison (‘control’) group, which consisted of individuals broadly similar on a range of characteristics measured prior to the roll-out of the enhanced support and who moved into care homes of a similar type in comparable areas of England.
- Overall, there was no strong evidence that Sutton residents in the study used hospitals more or less frequently than the matched control group. However, there were some indications that the Sutton residents might have experienced more emergency admissions than the matched control group, including more admissions that could be considered potentially avoidable through better care outside hospital.
- Indications of higher potentially avoidable emergency admissions were strongest in nursing homes, where we estimate that Sutton residents were 122% more likely to be admitted than the control group (95% confidence interval: 19% to 327% higher). Further investigation may be required to shed light on the specific factors driving this difference, since it might suggest that the enhanced support had an unintended effect for this group.
- There were some indications that Sutton residents who moved to a care home during the second eight months of the study period experienced fewer visits to accident and emergency (A&E) departments than the corresponding control group, although this did not seem to result in fewer admissions.
- We ensured that the matched control group was as similar as possible to the Sutton residents in the study on observed characteristics (eg demographic mix and past hospital activity). Sutton and control residents may, however, have still differed in unobservable ways (for instance in individual levels of health care need or in the quality of care received), which could have affected the results. Assuming that the two groups were comparable, the findings suggest that the quality of care offered to people living in care homes in Sutton was broadly the same as in the control group, at least as measured by hospital use.
- There are several possible explanations why we might not have seen significantly lower hospital use among Sutton residents than the control group. One possibility is that it was too early to see an effect. Other research has highlighted that the implementation of new models of care needs to be given time to take effect, so that the teams introducing these changes can be supported to work through initial implementation challenges and learn from experience. However, we cannot rule out the possibility that the enhanced support was unable to significantly reduce emergency admissions among the new Sutton residents in the study, and that there needs to be changes to the nature of the interventions offered. Another possibility is that the context in which the teams were working was not conducive to there being an effect on hospital activity of new care home residents.
- Looking ahead, further quantitative analysis examining the impact on hospital outcomes since April 2017 would support Sutton CCG in its continued implementation efforts, providing further learning to enable it to deliver sustainable change. These findings need to be looked at alongside any qualitative or local evaluation to help identify whether the interventions carried out are sufficient, or if changes to implementation may be needed, to achieve the desired effect.
The Improvement Analytics Unit
The Improvement Analytics Unit is an innovative partnership between NHS England and the Health Foundation that provides robust analysis to help the NHS improve care for patients. We use advanced statistical techniques to provide evidence of whether local programmes are having an impact on improving the quality and efficiency of care. We do this by assessing whether the care delivered to patients as part a local programme (such as a new clinical model or an integrated care system) is different in any significant way from the outcomes for patients who have not experienced a similar initiative.
Our aim is that our analysis helps the local NHS and its partners identify whether implementation of an initiative is having the desired effect, or needs to change to succeed. At a national level, we support decision-makers to identify what works well and assess the impact of national priorities.
For more information see: www.health.org.uk/IAU
Background and summary of local intervention
In March 2015 Sutton CCG, in partnership with local health and social care providers, formed an Enhanced Health in Care Homes (EHCH) vanguard: Sutton Homes of Care. This was one of the new care models that was announced in the Five year forward view for the NHS in England.
The aim of NHS England’s EHCH vanguard model was ‘[…] to ensure the provision of high-quality care within care homes […] to ensure that, wherever possible, individuals who require support to live independently have access to the right care and the right health services in the place of their choosing and to ensure that we make the best use of resources […] whilst ensuring the best care for residents’.
Sutton CCG describes the Sutton Homes of Care vanguard approach as being about partnership: working with people in the health and care system in Sutton to support all care home residents and staff, rather than ‘doing interventions’ to them. The CCG states that the joint aim was to have vibrant high quality care homes in Sutton delivering care that embraces the national nursing values of patient care – care, compassion, competence, communication, courage and commitment.,
The partners designed the enhanced support to build on previous work by the CCG, community services, the local hospital trust, the London Ambulance Service and London Borough of Sutton, incorporating interventions introduced prior to the award of vanguard status (see Table 1 for further details). This support was offered to all care homes operating in Sutton during vanguard operation.
Figures from January 2017 show that Sutton CCG supported 29 residential and nursing care homes equipped with 902 beds between them. In addition, there were 52 mental health and learning disability homes (with 397 beds), which were not included within the study.
What changes were introduced for care home residents in Sutton?
The Sutton Homes of Care vanguard organised its activity around three priority areas, or ‘pillars’., These were focussed on:
- better integration between health care organisations and care homes, with the aim of reducing the use of unplanned emergency care
- upskilling and motivating the care home workforce to facilitate active monitoring of residents’ wellbeing, producing greater understanding of appropriate action, as well as raising staff satisfaction and reducing turnover
- supporting quality assurance and safety by improving collection, sharing and use of data in planning, identifying risks and tackling issues.
Interventions under these pillars have been implemented in different types of care home (nursing/residential/mental health and learning disabilities) at different times and with varying degrees of coverage – see Table 1).
While some interventions were available to all Sutton care homes (eg educational resources and the Care Home Forum), the focus of the vanguard from November 2015 to July 2016 was on nursing homes. Attention shifted to residential homes in November 2016.
Table 1: Implementation of the three pillars of the Sutton Homes of Care vanguard
|
Pillar 1: Improving integrated care |
|
|
Weekly health and wellbeing rounds led by a GP supported by a care coordinator (specifically trained nursing home nurse) or link nurse reviewing the wellbeing of all residents in the care home |
From November 2015 to July 2016 (6 selected nursing homes); from November 2016 to July 2017 (4 selected residential homes) |
|
Multidisciplinary care home support team comprising link nurses, end-of-life care nurses, dementia support workers, care home pharmacists, a pharmacy technician and a dietician, delivering bespoke one-to-one training to all Sutton CCG care home staff and care support and medication reviews to residents |
Various, depending on specialty offered and care home type served (end-of-life care nurses began in nursing homes as early as October 2013) |
|
Hospital transfer pathway (the ‘Red Bag’), providing each care home resident being conveyed to hospital with a bag containing standardised clinical documents, essential medications and personal effects, aiming to streamline care home-to-ambulance-to-hospital transitions and facilitate diagnosis and treatment |
From November 2015 |
|
Pillar 2: Supporting care home staff |
|
|
Tailored e-learning on continence care, dementia care and person-centred thinking administered to care home staff |
E-learning from January 2016; dementia support information sessions from August 2016 |
|
Resource package comprising posters, films and reference cards |
Posters from November 2014; reference cards from March 2016 |
|
Care home forum for attendance by care home managers and the care home pledge in support of the vanguard |
Forum from April 2014; pledge during 2015/16 |
|
Table 1 continued on page 6 |
|
|
Pillar 3: Supporting quality assurance and safety |
|
|
Joint Intelligence Group of representatives from all partners across the health sector with a statutory responsibility for care homes, meeting monthly to share intelligence across health and social care |
From May 2014 |
|
Quality dashboard reporting on a range of quality and safety indicators, data from the London Ambulance Service and hospital records on A&E attendances and emergency admissions |
From May 2016 |
|
Cake, Cuppa, Chat initiative to foster engagement with residents, families and carers on a bi-monthly basis |
From October 2015 |
What impact did Sutton Homes of Care expect these changes to have?
Sutton Homes of Care intended to affect a variety of aspects relating to the health care and wellbeing experienced by care home residents. The vanguard had specific aims to improve health and wellbeing outcomes for residents, which may show up in an increased number of residents dying in their preferred place of death, reduced ambulance conveyances, fewer A&E attendances and emergency admissions, as well as improved satisfaction for staff and reduced staff turnover.
There are several possible mechanisms through which this might plausibly have been achieved. Upskilling and motivating the care home workforce to actively monitor their residents’ health and wellbeing and know when and how to take appropriate action was broadly expected to lead to an improved resident experience through a reduced level of incidents negatively affecting their wellbeing. Improved integration between health care organisations and care homes was expected to ensure residents received more timely, appropriate care. Initiatives like the health and wellbeing rounds, the hospital transfer pathway and the care home support team were all expected to contribute to reductions in avoidable inpatient activity for residents (notably for falls, urinary tract infections – UTIs – and pressure ulcers), 999 calls, A&E attendances, emergency admissions and hospital bed occupancy.
About this evaluation and analysis
This evaluation was conducted by the Improvement Analytics Unit – a partnership between the Health Foundation and NHS England that aims to provide local teams with robust information on the impact of initiatives to improve care, in order to inform ongoing improvement efforts. Analysis was conducted according to a statistical analysis protocol (SAP), which was subject to independent academic peer reviews and shared with the vanguard before analysis began.
We examined the effect of the enhanced support on new residents of 28 of the 29 nursing and residential care homes in Sutton. The analysis focused on people aged 65 years or over who moved into one of these care homes between January 2016 and April 2017, referred to hereafter as ‘Sutton residents in the study’. This period overlaps with the implementation of the vanguard, but not all interventions were implemented throughout the entirety of the period we studied, and those that were implemented were not in place for all care homes. For example, health and wellbeing rounds and link nurses were run for nine months during the study period at approximately one third of nursing care homes and one third of residential care homes (see Table 1).
We examined whether the enhanced support affected the hospital use of care home residents, including the number of A&E attendances and emergency hospital admissions for clinical conditions that were considered to be potentially avoidable. The use of hospital care by Sutton residents in the study was compared with a ‘control’ group of individuals, matched on a range of factors as outlined in the ‘Selecting the comparison group’ section on page 9. Both groups were followed up for as long as possible after admission to a care home. This analysis is based on data from January 2016 to April 2017, so the follow-up period varied between a minimum of 1 month and maximum of 15 months.
Analyses were also carried out to ascertain the effect on hospital use for subgroups of care home residents based on:
- care home type – nursing or residential (due to known differences in the type and intensity of initiatives implemented in each type of home)
- timing of entry to a care home – early or late in the study period (due to differences in implementation and ‘bedding in’ levels of the enhanced support over the study period).
Data used in the analysis
The Improvement Analytics Unit has access to pseudonymised data from the Secondary Uses Service (SUS) – a national, person-level database that is closely related to the widely-used Hospital Episode Statistics (HES). SUS data contains information on A&E attendances, inpatient admissions and outpatient appointments that are funded by the NHS in England, but unfortunately it does not record accurately whether an individual resides in a care home. Therefore, the unit needed a data set containing information on the residents of care homes, and a method of linking that data to SUS data.
This was assembled by the Arden & Greater East Midlands Data Services for Commissioners Regional Office (Arden & GEM DSCRO), the National Commissioning Data Repository in NHS England and the Improvement Analytics Unit. Care home residents were identified using a combination of monthly care home registry data published by the Care Quality Commission (CQC) and monthly extracts from the National Health Applications and Infrastructure Services (NHAIS) database, which contains a list of individuals registered at each general practice in England, including their residential address and NHS number.
The linked care home and hospital data were analysed by the Improvement Analytics Unit within an accredited secure data environment based at the Health Foundation. At no point did we have access to identifiable data. Throughout, the minimum amount of data was used.
Identifying the Sutton residents in the study
The study focused on individuals residing in a nursing or residential care home who fulfilled the following criteria:
- moved into a Sutton care home between 17 January 2016 (ie two months after November 2015, which is when the first batch of interventions was implemented) and 16 April 2017
- were not previously resident in a care home in the two years prior to their move-in date
- were aged 65 years and over
- experienced a hospital admission within the three years preceding entry to the care home (to ensure information on health conditions was available to inform the selection of an appropriate comparison group).
The evaluation only included nursing and residential care homes under the remit of Sutton CCG (ie having residents registered with a Sutton CCG GP) that were open between 17 January 2016 and 16 April 2016, to ensure a minimum period of care home activity within the study of one year. Care homes registered as catering for other age groups and with other specialties other than the frail, elderly care home population were excluded.
The final sample comprised 297 residents from 17 nursing and 11 residential care homes falling under the remit of Sutton CCG and participating in the enhanced support programme.
Selecting the comparison group
To evaluate the impact of the vanguard's enhanced support, it was necessary to form a comparison group of care home residents who were as similar as possible to the Sutton residents in the study. The process of forming the control group of care home residents is illustrated in Figure 1.
Control group residents were selected from areas that, before vanguard enhanced support was introduced in Sutton, had similar demographic and socioeconomic characteristics and emergency admission rates to Sutton.
Rates of hospital admission in the Sutton CCG before the enhanced support was introduced were slightly below the national average (944 emergency admissions for every 10,000 Sutton residents vs 1,034 for England as a whole in 2014/15)., The seven areas ultimately found to be most similar to Sutton CCG according to the above criteria were: Bexley CCG, Dartford, Gravesham and Swanley CCG, Leeds North CCG, Greater Huddersfield CCG, Bromley CCG, Havering CCG and North East Hampshire and Farnham CCG. The average emergency admission rate across these control areas was 970/10,000 residents, which is more in line with the rate observed for Sutton CCG relative to the national figure.,
While some of these areas may have been implementing changes to improve care for people living in care homes, to the best of our knowledge none were offering area-wide interventions targeted at care home residents of a scale and scope similar to Sutton’s enhanced support during the period concerned. Furthermore, since the control group comprised care home residents from multiple areas, the potential of each reviewed area to introduce significant bias was limited.
The same inclusion and exclusion criteria used to select Sutton residents in the study were also applied to care home residents in the selected comparable areas, giving a pool of potential controls consisting of 2,382 people from 194 care homes in the seven comparable areas. From these 2,382 residents, a matched control group was identified that was similar to the Sutton residents in the study on the following characteristics:
- at care home level: the number of beds in the care home; whether the care home was registered with the CQC as a nursing or residential home; whether the care home was registered as caring for additional population groups in addition to older people; whether the care home was in a rural or urban setting; and the socioeconomic deprivation level of the local area
- at residents’ level: age; gender; ethnicity; number and type of health conditions associated with frailty; diagnoses in the three years before introduction of the enhanced support predictive of emergency hospital readmissions (eg chronic pulmonary disease and congestive heart failure) or mortality (Charlson index); and numbers of emergency admissions, potentially avoidable emergency admissions, A&E attendances, elective admissions, hospitalisations due to falls and significant fractures, hospitalisations due to UTIs, hospitalisations due to venous thromboembolisms (VTEs) and hospital bed days in the two years prior to the start of the enhanced support.
When selecting controls, we did not use data on events that occurred following the admission to the care home, since this could have biased our findings. However, we checked that our final matched control group had a similar mortality rate to the Sutton residents, and that residents in the two groups spent a similar amount of time in our study.
We paired residents in nursing homes in Sutton with matched control individuals living in nursing homes in the comparable areas, and likewise residents in residential homes with matched controls living in residential homes. One matched control group resident was selected for each Sutton resident, yielding a sample of 297 residents from 97 care homes in the control group. A closer inspection of the selected control residents led to discarding an individual from the analysis because they were an outlier in terms of their hospital utilisation.
Figure 1: The process of forming the control group of care home residents
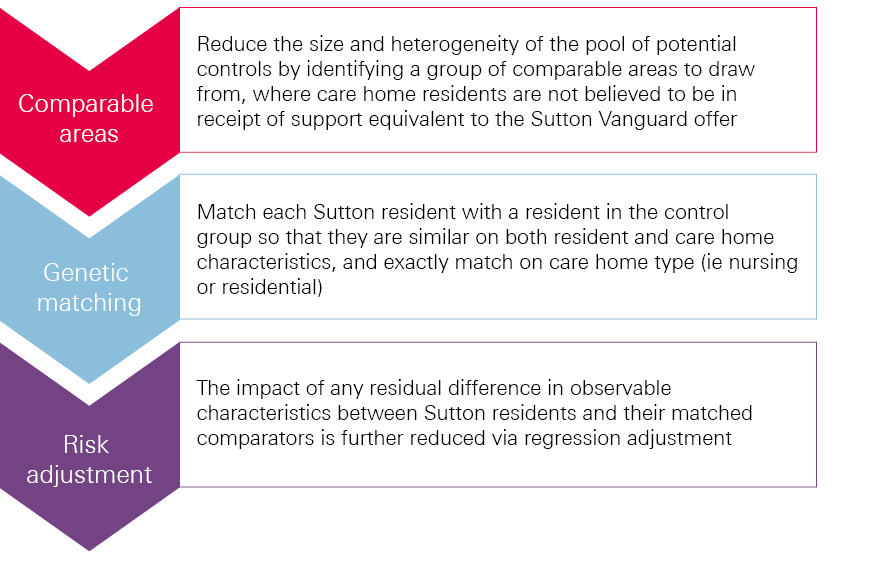
Comparisons between the Sutton residents and the matched comparison group were made using multivariable regression analysis. The regression models adjusted for the differences that remained after matching between the two groups in prior hospital use and other observed baseline characteristics such as age distribution, seasonality and number and type of comorbidities. Matching and regression generally perform better in combination than separately. The regression models produced a ‘best estimate’ of the relative difference in the examined hospital utilisation outcome between the Sutton residents and the matched comparison group, together with a 95% confidence interval.
The same procedure was followed in subgroup analyses, for which the total population was divided into groups according to care home type (residential or nursing), and time of entry to a care home (‘early entrants’ or ‘late entrants’). Late entrants were defined as those who moved to a care home in Sutton or a comparable CCG on or after 31 August 2016 (ie midway into the follow-up period), while those who moved before this date and had not stayed in the study for longer than 7.5 months were considered early entrants.
Outcome measures
Once a matched group of control care home residents was satisfactorily formed (see the section on page 13 'Characteristics of the Sutton residents in the study and the matched comparison group were broadly similar' for details), the Improvement Analytics Unit proceeded with comparing hospital activity between the two groups. For this purpose, the following seven outcomes were analysed:
- A&E attendances
- emergency admissions
- the subset of ‘potentially avoidable’ emergency admissions, based on a list of conditions considered to be manageable in community settings or preventable through good quality care (see Box 1)
- hospital bed days
- admissions with a UTI as the principal diagnosis
- outpatient appointments
- proportion of deaths occurring outside hospital (taken as an indicator of successful end-of-life planning).
Box 1: Conditions for which we considered emergency admissions to be potentially avoidable
The analysis included conditions that are often manageable, treatable or preventable in community settings without the need to go to hospital, as well as those that may be caused by poor care or neglect. These were:
- acute lower respiratory tract infections, such as acute bronchitis
- chronic lower respiratory tract infections, such as emphysema
- diabetes
- food and drink issues, such as abnormal weight loss and poor intake of food and water, possibly due to neglect
- fractures and sprains
- intestinal infections
- pneumonia
- pneumonitis (inflammation of lung tissue) caused by inhaled food or liquid
- pressure sores
- UTIs.
To calculate the number of potentially avoidable emergency admissions, we counted hospital admissions with one of these conditions listed as the primary diagnosis for an admission to hospital. Note, however, that this list of conditions was originally intended to be applied to the general population aged 65 or over, rather than to care home residents. Note also that sometimes individuals will still need to be admitted to hospital for these conditions independently of the availability of suitable out-of-hospital care (as is perhaps the case with individuals suffering from multiple co-morbidities) and regardless of the quality of the care offered in the care home. The metric is therefore not perfect, but we would expect the enhanced support to show greater impact on reducing the risk of hospital admission for these conditions than for others.
Hospital activity was measured for the period during which individuals were resident in care homes, counted from the month they moved into the care home to the month that they died or left the care home (or April 2017, if sooner). This analysis is based on data from 17 January 2016 until 16 April 2017. Individuals were followed up for their whole duration of stay in the care home since their admission, with a minimum follow up period of 1 month and maximum of 15 months.
Results
Characteristics of the Sutton residents in the study and the matched comparison group were broadly similar
After matching, the control group was found to be broadly similar to the Sutton residents in the study across the range of individual and care home characteristics considered (see Technical Appendix for more details). Figure 2 shows that the two groups had a similar profile of existing health conditions. Mean follow-up time of a resident in the study was similar across the groups (Sutton residents: 166 days [standard deviation 134]; control: 166 days [standard deviation 127]). Mortality rates in the two groups were also the same: 82 residents died in each group during the study period.
Figure 2: Distribution of key health conditions across the Sutton residents in the study and the control residents
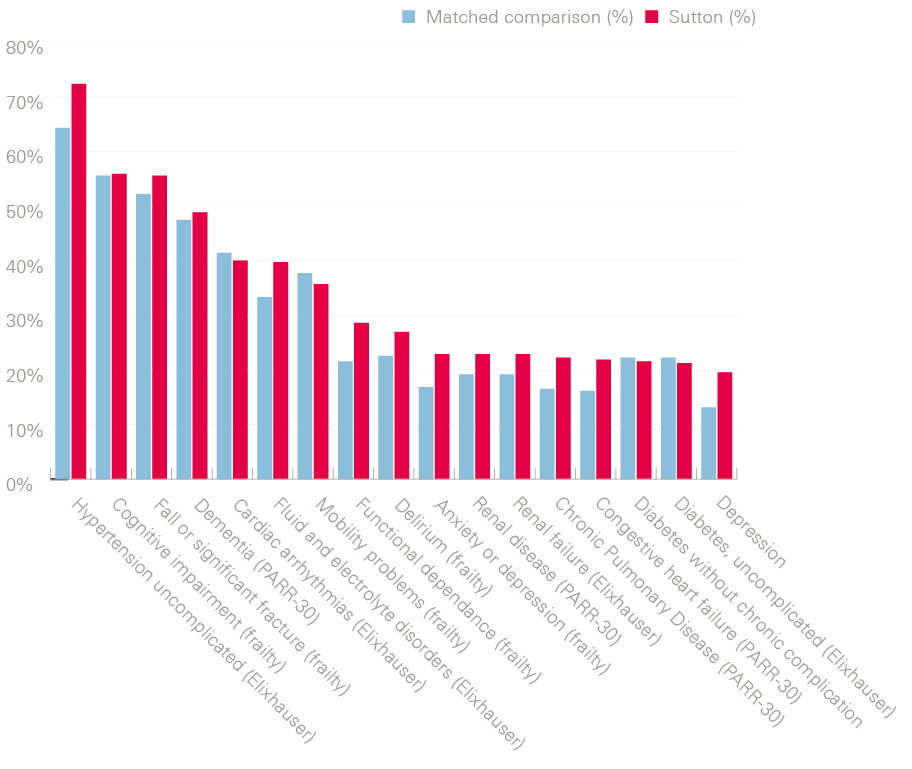
Table 2 compares the Sutton residents in the study, the matched control group and the full pool of potential controls at baseline. For some of these characteristics a relatively unsuccessful matching outcome was largely anticipated: for instance, the care home landscape in Sutton CCG was known to feature on average smaller care homes than other urban areas of England. Some residual difference remained between the groups, notably on:
- care home size, age category and rural classification
- type and number of comorbidities associated with frailty, and conditions associated with mortality (Charlson index)
- A&E attendances
- outpatient appointments
- number of emergency admissions in the year before moving to a care home – both overall, and those that were potentially avoidable.
Outstanding dissimilarities at least on observable characteristics were subsequently addressed via the risk-adjusted analysis outlined in Figure 1.
Table 2: Characteristics of the study group, the matched control group and the potential control group prior to November 2015 (when enhanced support introduced in Sutton)
|
Baseline characteristic |
Sutton residents in the study |
Matched control group |
Potential control group |
|
Number of individuals |
297 |
243 |
2,382 |
|
Number of records |
297 |
296 |
2,382 |
|
Number of care homes |
28 |
97 |
194 |
|
Resident lives in a nursing home |
74.07% |
74.32% |
53.99% |
|
Number of beds in the care home |
29.25 (11.20) |
39.19 (16.31) |
40.97 (22.70) |
|
Residing in a rural setting |
<5% |
<5% |
11.30% |
|
Age (in years) |
85.74 (7.33) |
85.83 (5.93) |
85.58 (7.16) |
|
Male |
31.60% |
28.40% |
33.10% |
|
White |
85.50% |
87.20% |
88.30% |
|
Charlson comorbidity index |
2.42 (2.02) |
2.10 (1.80) |
1.96 (1.85) |
|
Baseline characteristic |
Sutton residents in the study |
Matched control group |
Potential control group |
|
Number of frailty comorbidities recorded in the 3 years before the start of the enhanced support |
2.54 (1.72) |
2.30 (1.61) |
1.91 (1.59) |
|
Incontinence in the 3 years before the start of the enhanced support |
17.50% |
11.80% |
8.60% |
|
A&E attendances in the year before the start of the enhanced support |
2.66 (2.79) |
2.32 (1.85) |
2.26 (2.08) |
|
Potentially avoidable emergency admissions in the year before the start of the enhanced support |
0.60 (0.76) |
0.49 (0.69) |
0.51 (0.83) |
|
Hospital bed days in the year before the start of the enhanced support |
42.57 (41.39) |
40.14 (40.10) |
36.15 (47.29) |
|
Emergency admissions in the year before the start of the enhanced support |
2.03 (1.92) |
1.81 (1.46) |
1.67 (1.65) |
|
Elective admissions in the year before the start of the enhanced support |
0.30 (1.12) |
0.31 (0.99) |
0.34 (3.32) |
|
UTIs in the year before the start of the enhanced support |
0.20 (0.47) |
0.13 (0.39) |
0.17 (0.47) |
|
Outpatient appointments in the year before the start of the enhanced support |
12.95 (12.32) |
7.79 (12.36) |
5.43 (9.84) |
Outcomes excluded from the report
An analysis of the relative rates of hospital admissions with UTIs was inconclusive due to the very low numbers reported for these events, and therefore was excluded from the detailed presentation in the report.
We also observed that a considerable proportion of outpatient appointments were scheduled prior to individuals entering the care home, and so could not realistically have been influenced by the enhanced support. In the light of this observation and of the differences in outpatient appointments described in Table 2, we did not consider our findings for this outcome to be informative about the enhanced support's effectiveness; as such, we do not present them in this report.
A statistically significant difference in hospital activity was not detected
Figure 3 shows trends in hospital utilisation over time. For each chart, the horizontal x-axis represents time in the study (with quarterly increments), and entry into a care home is set at time zero. The y-axis shows the mean rate of a given outcome for each corresponding quarter for Sutton residents in the study and control group residents before and after moving to a care home (negative and positive x-axis values, respectively). As would be expected, given the matching process, both Sutton and control residents in the study experienced similar rates of hospital activity before moving into care homes (left panel within each chart), although small residual differences can be seen for some of the measures, as noted above. Comparing the right-hand side of each chart to the left-hand side shows that, after moving into a care home, rates of hospital activity are lower for both groups, and appear relatively similar between Sutton residents and controls for A&E attendances, emergency admissions and hospital bed days. In general, where rates of hospital activity appear slightly different, they are marginally higher for Sutton residents in the study than for the matched control residents, both before and after moving to a care home.
Figure 3: Comparison of Sutton and control residents in the study across selected outcome measures
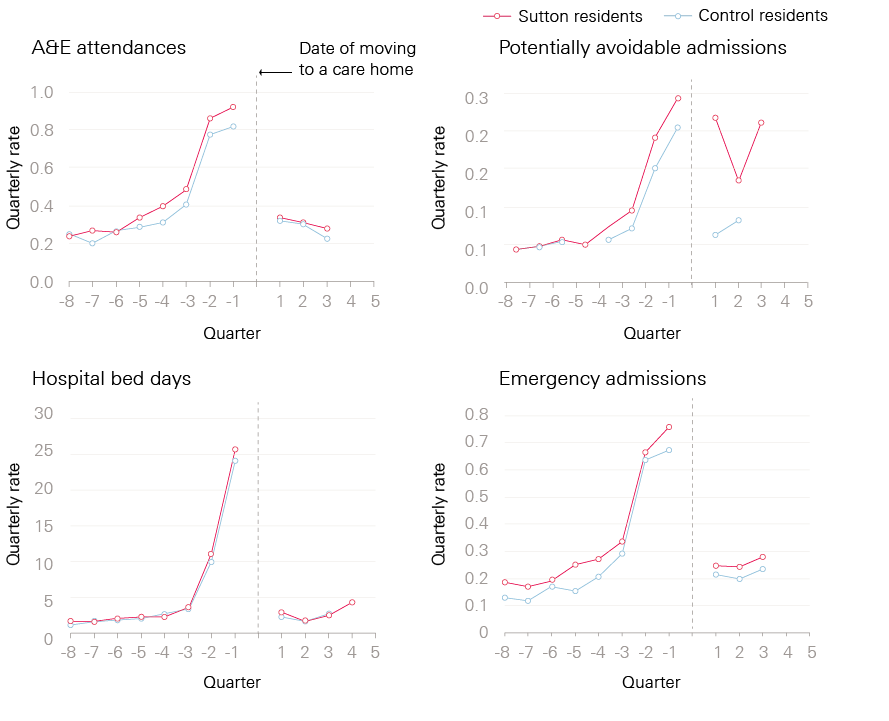
Table 3 shows how the groups compared in the follow-up period. The crude rates indicate the number of events per person per year, and are not adjusted for the differences that remained between the two groups after matching. The relative differences, on the other hand, account for the remaining differences between the two groups and will therefore be referred to when drawing conclusions and interpretations from the evaluation.
In our adjusted analyses, hospital utilisation did not appear to be statistically significantly different between the Sutton residents in the study and the matched control residents on any of the reported measures: that is, A&E attendances, emergency admissions, potentially avoidable emergency admissions and hospital bed days. All 95% confidence intervals spanned 0%, indicating no significant difference between groups at a 5% significance level.
Looking at each of the measures in more detail, Sutton residents in the study experienced an average of 1.24 A&E attendances per year after moving to a care home compared with 1.15 attendances for matched control residents. After risk adjustment (see the section on 'Selecting the comparison group' on page 9 for details), a statistically significant difference in the rate of A&E attendances was not detected, with a 95% confidence interval suggesting the true difference lies in the range of 24% lower to 32% higher A&E attendances in Sutton.
There were 0.98 emergency admissions per year for Sutton residents in the study compared with 0.86 emergency admissions for matched control residents. After adjustment, 52% more emergency admissions were estimated for Sutton residents than control residents, but the relative difference could lie anywhere from 7% fewer to 150% more emergency admissions for Sutton residents.
Crude rates show that Sutton residents in the study experienced 0.5 potentially avoidable emergency admissions per person per year against 0.31 among control group residents. After risk adjustment, potentially avoidable emergency admissions were estimated to be 181% more likely for Sutton residents than for the control group, with very wide confidence intervals spanning 0%, demonstrating a high degree of uncertainty in the result.
Sutton residents in the study had 4.7 hospital bed days per year compared with 3.7 for control residents. After risk adjustment, Sutton residents had 49% more estimated hospital bed days than residents in the control group, with 95% confidence intervals suggesting a relative difference in the range of 11% fewer to 148% more hospital bed days.
Table 3: Comparison of hospital utilisation between the Sutton residents and the matched control residents
|
Crude rates for Sutton residents in the study (number per person per year) |
Crude rates for matched control residents (number per person per year) |
Relative difference from matched comparison group (adjusted rate ratio) |
95% confidence interval |
P-value |
|
|
A&E attendances |
1.24 |
1.15 |
0% (no difference) |
24% lower to 32% higher for Sutton |
0.997 |
|
Emergency admissions |
0.98 |
0.86 |
52% higher for Sutton |
7% lower to 150% higher for Sutton |
0.098 |
|
Potentially avoidable emergency admissions |
0.5 |
0.31 |
181% higher for Sutton |
10% lower to 779% higher for Sutton |
0.077 |
|
Hospital bed days (mean, standard deviation) |
4.7 (11.8) |
3.7 (11.2) |
49% higher for Sutton |
11% lower to 148% higher for Sutton |
0.127 |
|
A p-value is a number between 0 and 1 and is commonly interpreted as follows: a small p-value (typically less than 0.05) indicates strong evidence of a difference in the outcome examined between Sutton residents and the control; a large p-value (greater than 0.05) offers no evidence in support of there being a difference; and p-values close to 0.05 are indicative of weak evidence of a difference and thus are subject to interpretation. |
|||||
A statistically significant difference in the proportion of deaths that occurred outside hospital was not detected
During the study period, 82 of the Sutton residents in the study died, as did 82 of the matched control residents. Among the Sutton residents who died, 72% of deaths occurred outside hospital, compared with 79% of deaths for the matched control residents. After adjustment, the proportion of deaths outside hospital was 63% lower for Sutton residents in the study. The relative difference in proportion of deaths outside hospital could lie in the range of 92% lower to 40% higher in Sutton (see Table 4).
Table 4: Comparison of percentage of deaths occurring outside hospital
|
Sutton residents in the study |
Matched control residents |
Relative difference from matched comparison (adjusted odds ratio) |
95% confidence interval |
P-value |
|
|
Percentage of deaths outside hospital (number of deaths outside hospital/total deaths) |
71.95% (59/82) |
79.27% (65/82) |
63% lower for Sutton |
92% lower to 40% higher for Sutton |
0.161 |
The type of care home and timing of entry into a care home may affect the impact of the enhanced support
Further analyses were performed to investigate the impact of the enhanced support in specific subgroups of care home residents based on:
- residential or nursing care home: residential (77 Sutton residents in the study, 76 control residents) vs nursing (220 residents both in Sutton and the control group)
- timing of entry to care home: early (65 residents in Sutton, 80 residents in the control group) or late (147 residents in Sutton, 130 residents in the control group).
All of the outcome measures reported above for the overall population were also analysed in the subgroup populations. The quality of the matching process was also reassessed for the individual subgroups and was found to be equally satisfactory to the base case analysis. There were two statistically significant findings, and these are presented in Table 5 with other selected findings that support their interpretation. Note that for some of the outcomes (eg the number of emergency admissions) the crude rates for the Sutton residents are lower than those for the matched control residents, whereas the risk-adjusted rates among Sutton residents are higher than in the control group. This is not unexpected, since the crude rates do not adjust for observable differences in the characteristics of the two groups (see 'Characteristics of the Sutton residents in the study and the matched comparison group were broadly similar' on page 13) and as such offer a less reliable measure of intervention effectiveness. Results for the other outcomes not examined in the subgroup analyses were not as informative and are not included in this report (see the Technical Appendix for details).
Among nursing home residents, those in Sutton experienced 0.54 potentially avoidable emergency admissions per person per year compared with 0.26 for the corresponding matched control residents. In the risk-adjusted analysis, nursing care home residents in Sutton were estimated to be 122% more likely to experience a potentially avoidable emergency admission than those in the control nursing homes, with the confidence interval indicating a 19% to 327% greater likelihood of a potentially avoidable emergency admission in Sutton. This result was statistically significant (p=0.01). Conversely, no statistically significant difference was found in residential care home residents.
Among late care home entrants, those in Sutton had 1.28 A&E attendances per person per year, compared with 1.46 in the control care homes. In the adjusted analysis, the rate of A&E attendance was estimated to be 70% lower for late entrants to a care home in Sutton compared with late entrants to a control care home. The likelihood of an A&E attendance for late care home entrants was between 88% and 24% lower in Sutton than in the control care homes. This result was statistically significant (p=0.01).
Table 5: Selected results from subgroup analyses of the Sutton residents compared with matched control residents
|
Subgroup |
Crude rates for new Sutton residents (number per person per year) |
Crude rates for matched control residents (number per person per year) |
Relative difference from matched comparison group (adjusted rate ratio) |
95% confidence interval |
P-value |
|
|
Emergency admissions |
Residential care home residents |
0.96 |
1.18 |
54% higher for Sutton |
34% lower to 262% higher for Sutton |
0.322 |
|
Nursing care home residents |
0.99 |
0.73 |
82% higher for Sutton |
10% lower to 267% higher for Sutton |
0.094 |
|
|
Early care home entrants |
1.93 |
1.46 |
17% higher for Sutton |
73% lower to 414% higher for Sutton |
0.831 |
|
|
Late care home entrants |
0.91 |
0.75 |
20% lower for Sutton |
59% lower to 59% higher for Sutton |
0.521 |
|
|
Potentially avoidable emergency admissions |
Residential care home residents |
0.39 |
0.44 |
7% lower for Sutton |
60% lower to 117% higher for Sutton |
0.859 |
|
Nursing care home residents |
0.54 |
0.26 |
122% higher for Sutton |
19% to 327% higher for Sutton |
0.012 |
|
|
Early care home entrants |
1.24 |
0.46 |
238% higher for Sutton |
42% lower to 664% higher for Sutton |
0.193 |
|
|
Late care home entrants |
0.47 |
0.36 |
28% higher for Sutton |
53% lower to 258% higher for Sutton |
0.628 |
|
|
A&E attendances |
Residential care home residents |
1.31 |
1.83 |
34% lower for Sutton |
64% lower to 22% higher for Sutton |
0.184 |
|
Nursing care home residents |
1.21 |
0.88 |
29% higher for Sutton |
10% lower to 87% higher for Sutton |
0.162 |
|
|
Early care home entrants |
2.21 |
1.59 |
26% lower for Sutton |
81% lower to 182% higher for Sutton |
0.660 |
|
|
Late care home entrants |
1.28 |
1.46 |
70% lower for Sutton |
88% to 24% lower for Sutton |
0.011 |
Interpretation
What can we learn from these analyses?
This evaluation is based on data on hospital utilisation over the period January 2016 to April 2017 for care home residents who moved into one of 28 residential or nursing care homes in Sutton during this time. These analyses provide insights into hospital utilisation rates by new care home residents supported by the Sutton Homes of Care vanguard at an initial stage of the vanguard’s enhanced support, in comparison with a broadly similar group of individuals who entered care homes not supported by the vanguard.
Considering the whole period covered by the evaluation, the results of these analyses do not allow us to draw strong conclusions about the effectiveness of the enhanced care initiatives introduced by the Sutton Homes of Care vanguard. There was no strong evidence that people moving to care homes in Sutton used hospitals more or less frequently than the matched control group.
Our findings do not necessarily imply that there was no effect. There were wide 95% confidence intervals for the relative difference between Sutton residents and the control group on several measures. The true difference between groups will realistically lie somewhere within the range of those wide confidence intervals, and the examined data may therefore not give a full picture of the impact that enhanced care is having on the chosen hospital utilisation outcomes.
Notwithstanding the degree of uncertainty in the results, there were some indications that the Sutton residents in the study might have experienced more emergency admissions than matched controls, including more admissions that we considered to be potentially avoidable through better care outside hospital. These indications were strongest in the nursing homes. It is possible that this pattern reflects a true increase in hospital use in the Sutton care home residents observed in the study period. For example, it is conceivable that more intensive and multidisciplinary care of new residents in care homes, as well as improved staff training, led to earlier identification of health issues and unmet health care needs, more proactive engagement with health care professionals and a greater propensity towards hospital referrals. It is also possible that this finding could be influenced by unobserved factors independent of the enhanced support. Lastly, we cannot rule out the possibility that the enhanced support was unable to significantly reduce emergency admissions among new Sutton residents.
There were some indications that Sutton residents who moved to a care home during the second eight months of the study period experienced fewer visits to A&E departments than the control group. Among these late care home entrants, the rate of A&E attendance was estimated to be 70% lower in Sutton compared with late entrants to a control care home. The likelihood of an A&E attendance for late care home entrants was between 88% and 24% lower in Sutton than in the control care homes.
Experience from previous evaluations has shown that such complex innovations often take time to take effect. In this evaluation we were looking at the impact over a 15-month period between January 2016 and April 2017. This was part way through the implementation of the three-year vanguard programme, and it should be noted that some of the interventions that made up the enhanced support were introduced mid-way through 2016, and the range of initiatives were implemented with varying degree of coverage. A follow-up evaluation allowing for sufficient time for all the changes to take effect might provide more conclusive results and determine whether these interventions are sufficient, or if changes to implementation may be needed, to achieve the desired effect.
Strengths and limitations of the study
This evaluation focused on hospital utilisation, since it was an objective of the vanguard to respond to pressures on the health and care system by reducing the use of unplanned emergency care. Other aspects of care delivery in care homes, such as ambulance conveyances and the experiences of residents, care home staff and manager are considered within other evaluation evidence compiled by the vanguard, but were not considered in this evaluation due to limitations in the data available.
By linking data sets together, we were able to study the hospital records for a large number of care home residents, without the problems with non-response that can occur with other data collection methods such as surveys. However, we restricted our attention to new care home residents, and it is possible that the evaluation is missing a larger effect from those who have lived at a care home for a longer period. We might also have missed some new residents due to limitations of the method used to identify residents and link the data sets together, though there are no indications that this would have affected the results.
The statistical methods used in the evaluation mean that the control group was selected to be as similar to the Sutton residents in the study as possible on a range of demographic, socioeconomic, health and hospital use characteristics. These characteristics were measured prior to the introduction of the enhanced support. These two groups had similar age, gender, health care conditions and previous hospital utilisation, and they lived in care homes that were similar in terms of size and provision of nursing or residential care. Moreover, the matched control group residents lived in local authority areas that were comparable to Sutton in terms of demographic and socioeconomic characteristics and historic, per capita rates of emergency hospital admission.
It was noted during the matching process that some residual differences remained at both care home and resident level. At resident level, some remaining differences were seen in relation to the type and number of comorbidities associated with frailty, conditions associated with mortality, prior A&E attendances, outpatient appointments and the number of emergency admissions in the year before moving to a care home – both overall, and those that were potentially avoidable. While this could indicate a higher level of health care need by care home residents in Sutton when they enter a care home, these outstanding dissimilarities, at least on observable characteristics, were subsequently addressed via the risk-adjusted analysis. We were reassured to find that the Sutton and matched comparison groups had similar mortality rates, lending support to the notion that neither group had more severe health conditions than the other.
Some of the differences at care home level were not expected to be substantially reduced through matching, since Sutton features a preponderance of small, independent care homes in a largely urban setting relative to the rest of England. These differences included the size, age category and rural classification of the care homes. We were also unable to measure differences relating to the quality of care delivered in care homes or other measures of the care home market, due to lack of data available to the Improvement Analytics Unit. As such, these could not be addressed by the risk adjustment. We did however attempt to minimise the risk of introducing a significant bias by selecting care home residents from multiple areas.
Notwithstanding the similarities, it is therefore possible that unmeasured differences may have existed between the Sutton residents in the study and the matched comparison group, for example in the availability of informal care support or local authority funding. Any unmeasured differences between the groups might explain some or all of the difference we observed in the utilisation of emergency care. It is also possible that there were greater similarities than anticipated in the care provided by some of the care homes included in the control group and those supported by the Sutton Homes of Care vanguard. For example, there may have been enhanced care initiatives being implemented in the comparison care homes. This would have made it harder to discern an effect of the Sutton Homes of Care vanguard compared with the control.
We cannot therefore be certain of the extent to which the effects seen are due to the vanguard's enhanced support, or some other factor relating to differences in the care provided to both groups, or insufficient time for the changes to take effect. While it might be possible to build on this study to address this limitation, some problems would remain unless a randomised controlled trial was conducted, and even that approach can suffer from shortcomings, and in some cases bias, for complex changes such as this one.,
Implications and priorities for future work
Implications of the evaluation
The Sutton Homes of Care vanguard worked in partnership with local health and care providers to design and deliver an ambitious change programme and bring about an improvement in the health care and wellbeing experienced by all care home residents in Sutton, alongside a reduction in health care costs.
These analyses reflect implementation part way through the delivery of the enhanced support, and provide important insights for Sutton CCG that could help improve its work in this area. Many of the activities were carried forward beyond April 2017, which was the end of the period covered by this evaluation. These analyses supplement existing evidence derived by alternative methods delivered by the vanguard’s local evaluation partner, and provide a different approach to evaluating the impact of the vanguard-enhanced support. Alternative analytical approaches come with different strengths and weaknesses. Exploring how these findings differ and/or support one another provides useful insights that can inform future implementation. Learning from the Sutton vanguard and sharing good practice will be key to achieving the aim of creating a culture and ethos in Sutton that will deliver sustainable improvement, as the changes made evolve into ‘business as usual’ within Sutton CCG.
Our main findings, while not being conclusive, do suggest some weak evidence of higher emergency hospital admissions for the Sutton residents in the study as compared to the control group, particularly in nursing homes. While it is possible that this is due to other factors than changes made by the Sutton Homes of Care vanguard, it is also possible that this pattern reflects a true increase in hospital use, potentially reflecting earlier identification of health issues and unmet health care need. This may require further investigation. Our analyses also suggest a reduction in A&E attendances for Sutton residents who moved to a care home during the second eight months of the study period. This finding highlights the importance of local systems delivering new models of care being given time for changes to take effect, being supported to work through initial implementation challenges and being able to learn from experience. It also demonstrates the importance and value of robust evaluation such as this, to understand whether initiatives are working well, or need to change to succeed.
Improving care across a large number of care homes with different environments and contexts is a complex undertaking. Experience has shown that such complex innovations often take time to take effect, that the implementation path is often not linear, and that the final result can be unpredictable. International examples show that, often, a continual process of learning is needed, with changes being successively tested and evaluated, and with learning used to improve both the design of the change programme and the surrounding context. Sometimes there needs to be changes to the nature of the interventions offered or to the surrounding context, so that it is more conducive to the changes being made. The aim of the Improvement Analytics Unit is to produce information that contributes towards learning and informs course correction on the ground as well as at a national level.
Priorities for future work
Building on the implementation approach adopted by the vanguard, with evidence and analysis being part of delivery, Sutton CCG would benefit from ongoing testing and evaluation to support its delivery of sustainable change. Future studies using larger samples of care home residents would be useful to increase the power to detect significant differences in outcomes between different models of care. Analyses could concentrate on the following key areas:
- building on this analysis, by exploring how to reduce the risk that differences in quality of care in the care homes may partly explain observed results, or by conducting additional quantitative analyses of data from the period after April 2017, to see if there is evidence that the impact on hospital outcomes has changed as the implementation matures
- inclusion of data on planned admissions and on hospital admissions following a UTI, fall or significant fracture, pressure ulcer or VTE in longer-term analyses, if sufficient cases are reported
- ongoing monitoring of hospital admissions from care homes providing regular tracking of care quality and trends, including the use of data linkage methods to understand possible reasons behind those trends
- assessing if differences in quality of care in the care home (residential care home or nursing home) as assessed by CQC (rating or presence of a registered manager) had any impact on the results.
Further, these findings need to be looked at alongside any qualitative evaluation to understand the level of uptake of the implementation and also explore what might have led to the patterns of hospital use seen in this study.
References
- Davies A, Ariti C, Georghiou T, Bardsley M. Evaluation of complex health and care interventions using retrospective matched control methods. Nuffield Trust. 05 August 2015. [Internet]. 2017. Available from: https://www.nuffieldtrust.org.uk/files/2017-01/evaluation-health-care-interventions-web-final.pdf
- NHS England. Five year forward view [Internet]. 2014. Available from: www.england.nhs.uk/wp-content/uploads/2014/10/5yfv-web.pdf
- NHS England. The framework for enhanced health in care homes [Internet]. 2016. Available from: https://www.england.nhs.uk/wp-content/uploads/2016/09/ehch-framework-v2.pdf
- NHS Sutton Clinical Commissioning Group. NHS Sutton CCG Vanguard Programme: Exploring new ways of caring for our care home residents, 03 November 2015. [Internet]. 2017. Available from: http://www.suttonccg.nhs.uk/vanguard/Documents/NHS-Sutton-CCG-Vanguard-Value-Proposition.pdf
- Department of Health/NHS Commissioning Board. Compassion in Practice Nursing Midwifery and Care Staff Our Vision and Strategy. 04 December 2012. [Internet]. 2017. Available from: https://www.england.nhs.uk/wp-content/uploads/2012/12/compassion-in-practice.pdf
- Social Care Institute for Excellence/SQW. Evaluation of Sutton Homes of Care Vanguard, End of Year Report, 20 July 2017. [Internet]. 2017. Available from: http://www.suttonccg.nhs.uk/vanguard/our-journey/PublishingImages/Pages/Evaluation/Evaluation%20of%20Sutton%20Vanguard%20End%20of%20Year%20Report%20201617.pdf
- NHS Sutton Clinical Commissioning Group. Sutton Homes of Care Value Proposition [Internet]. 2016. Available from: http://www.suttonccg.nhs.uk/vanguard1/who-we-are/Documents/Sutton-Vanguard-Value-Proposition.pdf
- Improvement Analytics Unit. Statistical Analysis Protocol for an evaluation of the Sutton Homes of Care intervention.
- Office for National Statistics. Clinical Commissioning Group Mid-Year Population Estimates (National Statistics), 26 October 2017. [Internet]. 2017. Available from: https://www.ons.gov.uk/peoplepopulationandcommunity/populationandmigration/populationestimates/datasets/clinicalcommissioninggroupmidyearpopulationestimates
- NHS Digital. Hospital Episode Statistics, Admitted Patient Care - England, 2014-15: CCG of responsibility (Official statistics, National statistics). 25 November 2015. [Internet] 2017. Available from: https://digital.nhs.uk/data-and-information/publications/statistical/hospital-admitted-patient-care-activity/hospital-episode-statistics-admitted-patient-care-england-2014-157.
- Charlson ME, Pompei P, Ales KL, MacKenzie CR. A new method of classifying prognostic comorbidity in longitudinal studies: development and validation. J Chronic Dis. 1987; 40(5):373–83.
- Care Quality Commission. The state of health care and adult social care in England in 2012/13. November 2013. [Internet]. 2017. Available from: https://www.gov.uk/government/publications/the-state-of-health-care-and-adult-social-care-in-england-in-2012-to-2013
- Diamond A, Sekhon JS. Genetic Matching for Estimating Causal Effects: A General Multivariate Matching Method for Achieving Balance in Observational Studies. The Review of Economics and Statistics. 2013. [Internet]. 95(3):932-945. Available from: https://www.mitpressjournals.org/doi/10.1162/REST_a_00318
- Conti S, Gori C, Caunt M, Steventon A. Technical appendix: The impact of providing enhanced support for Sutton Homes of Care residents. Findings from the Improvement Analytics Unit. 2018.
- Hendy J, Chrysanthaki T, Barlow J, et al. An organisational analysis of the implementation of telecare and telehealth: the whole systems demonstrator. BMC Health Services Research. 2012. [Internet]. 12:403:1-10. Available from: https://bmchealthservres.biomedcentral.com/articles/10.1186/1472-6963-12-403
- Steventon A, Grieve R, Bardsley M. An approach to assess generalizability in comparative effectiveness research: a case study of the Whole Systems Demonstrator cluster randomized trial comparing telehealth with usual care for patients with chronic health conditions. Medical Decision Making. 2015. [Internet]. 35(8):1023-1036. Available from: http://journals.sagepub.com/doi/abs/10.1177/0272989X15585131
- Hawe P. Lessons from Complex Interventions to Improve Health. Annual Review of Public Health. 2015. [Internet]. 36:307-323. Available from: https://doi.org/10.1146/annurev-publhealth-031912-114421
Acknowledgements
We would like to acknowledge the contribution of the following individuals: Richard Brine, Creina Lilburne, Therese Lloyd, Paris Pariza, Rachel Pearson, Emma Vestesson, Arne Wolters.
The Improvement Analytics Unit reports to an Oversight Group and Information Governance Advisory Group. We are grateful to members of these groups for their support and advice, as well as representatives from the Sutton Homes of Care evaluation partner SQW and NHS Sutton CCG for their continued support.
Errors or omissions remain the responsibility of the authors alone.