Key points
- The capital budget of the Department of Health and Social Care (DHSC) is used to finance long-term investments in the NHS in England. This includes spending on new buildings, equipment and IT, improvements to and some maintenance of NHS trusts, and research and development.
- Since 2010/11, capital spending by the DHSC has declined in real terms – from £5.8bn in 2010/11 to £5.3bn in 2017/18, a fall of 7%. This means the capital budget in 2017/18 was 4.2% of total NHS spending, compared with 5% in 2010/11. This fall is mostly explained by transfers by the DHSC from the capital to the revenue budget, to focus more funding on day-to-day running costs.
- The fall in the DHSC's capital budget has contributed to the UK having a low level of capital investment in health care by international standards. The UK now spends about half the share of GDP on capital in health care compared with similar countries, and is far behind other countries in the number of MRI and CT scanners per capita. Although capital-to-revenue transfers have reduced capital spending, the UK would still have very low capital spending, by international standards, had these transfers not occurred.
- Around 60% of the DHSC’s capital budget is spent by NHS trusts in England. Capital spending in NHS trusts has fallen 21% between 2010/11 and 2017/18, from £3.9bn to £3.1bn – a larger fall than in the overall capital budget.
- Most capital spending (55%) in NHS trusts is on buildings, with ‘plant and machinery’ (eg MRI and CT scanners, clinical equipment) and IT spending representing 22% and 10%, respectively.
- The value of capital in NHS trusts has risen by 4% since 2010/11. At the same time, the workforce has increased by 26%. This has meant a 17% fall in the value of capital per worker since 2010/11.
- Sales of NHS capital have risen significantly since 2015/16, with over £400m in sales in 2017/18 (compared with £175m in 2010/11). Although sales of capital are meant to be re-invested, this has not been the case, with significant amounts of money from sales of land being used for the revenue budget, which covers the day-to-day costs of delivering care.
- The maintenance backlog in NHS trusts has been rising, from £4.4bn in 2013/14 to over £6bn by 2017/18. This is around double the amount of annual capital spending in NHS trusts. Over £3bn of this backlog is 'high' and 'significant' risk, the two highest risk categories. At the current rate of growth, investment in reducing the backlog needs to rise by approximately three-quarters just to stop it from growing further.
- The DHSC has outlined a vision for a world-leading technology- and data-driven health and social care system. The current capital budget will be insufficient, as current capital-spending levels are leading to declining values in plant and machinery in trusts and a substantial, growing maintenance backlog. Although IT investment has increased, it still makes up a very small portion of total capital in NHS Trusts.
- Qualitative research commissioned by the Health Foundation finds that many trusts are seeing capital-funding constraints have a direct, negative impact on their ability to deliver optimal care. Staff have reported negative effects on productivity from issues such as equipment shortages and failure. Hospitals are using ageing diagnostic equipment, which is negatively affecting the ability of clinical staff to perform their work. The research also identifies the built environment as having negative effects on patient care and safety.
- Although a funding increase of 3.4% was announced by the government in 2018 for the NHS England budget for the next 5 years, no commitment to long-term funding for capital has been set out. This will need to be addressed in the 2019 Spending Review, along with clarity on the approach to managing the maintenance backlog. Without increased capital funding, there is a risk that NHS trusts will be unable to plan for the transformation of services set out in The NHS Long Term Plan, and ongoing maintenance issues could risk the quality and safety of patient care.
- To bring the UK up to the capital-spending average share of GDP of Organisation for Economic Co-operation and Development (OECD) countries in 2016 would have required an extra £5bn (based on the latest OECD data).
- If capital funding were to be increased in line with the OECD average, this would require capital funding for the NHS in England of £9.5bn in 2019/20. This would be a £3.5bn increase on top of the current capital budget in 2018/19, rising to £4.1bn by 2023/24. Alongside this, an end to the regular transfers from capital to revenue budgets is needed so that NHS trusts can invest and plan for the future.
Introduction
The capital budget of the Department of Health and Social Care (DHSC) is used to finance long-term spending in the NHS, such as new buildings, equipment and technology, addressing some of the maintenance of NHS estates and equipment, and research and development (R&D). Capital spending is a critical input in health care, with new technology able to transform services and improve workforce productivity.
The DHSC has proposed a more technology- and data-driven NHS. New technology and IT could improve patient services and increase productivity, but both currently make up a small proportion of capital spending. The UK spends significantly less on capital, such as buildings and equipment, than most other Organisation for Economic Co-operation and Development (OECD) countries. This may contribute to its poor performance on outcomes compared with similar countries. However, although modern health
technology can lead to better health from improved quality and service, it is not generally associated with cost savings in health care. The Topol Review into how technology will influence the NHS workforce has highlighted that significant investment in the workforce will be needed to ensure it can realise the potential benefits of new technologies.
Although the government has committed an extra £20.5bn for NHS England by 2023/24, this does not include any funding for the capital budget. Capital investment is crucial for the long-term future of the NHS. In recent years, there have been repeated, significant transfers from the capital budget to fund day-to-day operating expenses, which has left NHS trusts with both planning and funding issues in their capital plans. This short-termism is only delaying issues, when long-term planning and a long-term funding settlement are what is really needed.
In this briefing, we analyse trends in the capital budget, comparing the UK with international averages. Using annual data from all NHS trusts in England, we then focus on trends in the capital spending of NHS trusts to analyse where money has been spent and where there are areas of need. We then analyse the implications of recent capital spending, with a specific focus on NHS trusts’ maintenance backlog. We conclude with a discussion of the trends in capital spending and capital levels, and implications and recommendations for future health care funding.
Capital funding in the NHS in England
The total DHSC budget consists of the Revenue Departmental Expenditure Limit (RDEL, or revenue budget) and the Capital Departmental Expenditure Limit (CDEL, or capital budget). The revenue budget is used for the day-to-day running costs of the NHS, public health expenditure, and other arm’s-length bodies of the DHSC. For 2018/19, the revenue budget is £123.3bn and the capital budget is £5.9bn. Table 1 shows the trends in the revenue and capital budgets of the DHSC since 2010/11, and looking forward to 2019/20. The revenue budget has grown each year, while the capital budget fell in all years between 2011/12 and 2016/17, except 2013/14. In real terms, the capital budget in 2018/19 is larger than in all years since 2010/11, as confirmed in the 2019 February supplementary estimates.
The growth rate in the revenue budget between 2010/11 and 2017/18 was the lowest since the founding of the NHS in 1948, resulting in significant pressure on front-line services. During this time, from 2014/15 to 2017/18, DHSC transferred a total of £4bn from the capital budget to the revenue budget to relieve some of this pressure. These capital-to-revenue transfers are shown in Table 1, with £0.5bn confirmed for 2018/19.,
Capital-to-revenue transfers have led to the capital budget falling as a share of total DHSC budget from 5% in 2010/11 to less than 4% in 2015/16. On the basis of the autumn 2018 budget, capital spending as a portion of the total budget is forecast to increase to 4.6% in 2018/19 and 5% in 2019/20. Had the capital budget grown at the same rate as the revenue budget, in real terms it would have been 17% larger in 2017/18 and 8% larger in 2018/19.
Table 1: Department of Health and Social Care (DHSC) capital and revenue budgets, 2010/11 to 2019/20
|
Real terms £ |
DHSC revenue budget (£bn) |
DHSC capital budget (£bn) |
DHSC total budget (£bn) |
Change in capital budget |
Capital-to-revenue transfer (£bn) |
Capital budget as a share of total budget |
|
2010/11 |
108.8 |
5.8 |
114.6 |
– |
– |
5.0% |
|
2011/12 |
110.6 |
5.3 |
115.9 |
–8.7% |
– |
4.5% |
|
2012/13 |
111.0 |
5.2 |
116.2 |
–1.1% |
– |
4.5% |
|
2013/14 |
113.2 |
5.8 |
119.0 |
11.9% |
– |
4.9% |
|
2014/15 |
116.0 |
5.3 |
121.3 |
–8.5% |
0.68 |
4.4% |
|
2015/16 |
119.6 |
4.9 |
124.5 |
–7.2% |
1.01 |
4.0% |
|
2016/17 |
120.5 |
4.7 |
125.2 |
–4.3% |
1.25 |
3.8% |
|
2017/18 |
122.1 |
5.3 |
127.4 |
12.7% |
1.02 |
4.2% |
|
2018/19a |
123.3 |
6.0 |
129.2 |
12.2% |
0.50 |
4.6% |
|
2019/20a |
126.1 |
6.6 |
132.7 |
10.0% |
– |
5.0% |
Source: Department of Health and Social Care annual reports, autumn 2018 budget. aPer autumn 2018 budget.
In January 2019, NHS England released The NHS Long Term Plan, which outlines a 10-year vision based on its recent funding settlement. However, as the capital budget is not part of NHS England, but is determined by the DHSC, The NHS Long Term Plan did not include any capital funding commitments, with changes to capital funding expected to be announced in the 2019 Spending Review. Currently, a transfer of £0.25bn is planned for 2019/20. The DHSC has stated its aim of stopping capital-to-revenue transfers by the end of 2019/20, and is doing a review of capital spending for the 2019 Spending Review.
The NHS has also made use of private finance initiatives (PFIs) to fund some of its capital spending. PFIs involve the NHS using private sources of finance to fund capital projects. PFIs have a complicated impact on trusts' finances, as the payment does not count towards CDEL. This means that in the past, NHS trusts have been able to obtain new assets without it coming out of the capital budget. However, other costs, including the interest charges, will count towards the revenue budget. There have been concerns about PFIs, including value for money and poor management of contracts. In the autumn 2018 budget, the Chancellor of the Exchequer announced the end of these contracts, which we highlighted will leave a gap in future funding, placing additional pressures on the DHSC capital budget.
What is the capital budget spent on?
The DHSC capital budget is used to finance long-term investments, such as new buildings, equipment, technology and R&D. Figure 1 shows the breakdown of the capital budget in 2017/18.
Figure 1: Department of Health and Social Care 2017/18 capital budget by sector at 2018/19 prices
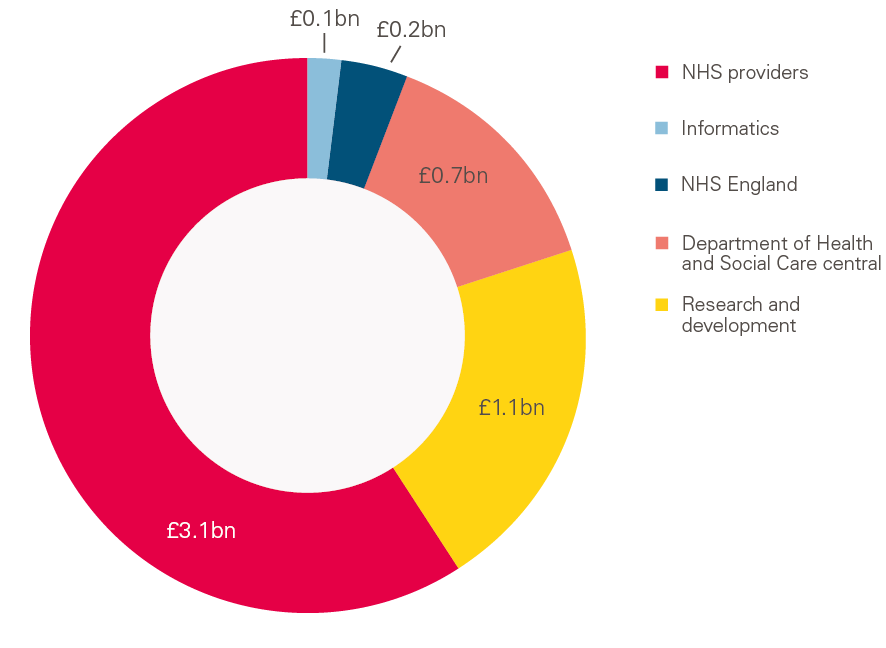
Source: Department of Health and Social Care 2017/18 annual report.
In 2017/18, capital spending in NHS trusts represented 58% (£3.1bn) of the capital budget. R&D was the next largest portion and represented 21% (£1.1bn) of the capital budget. R&D became a part of the capital budget in 2010/11, with the National Institute for Health Research funding accounting for most of this (it is currently the largest national funder of clinical research in Europe). Since 2010/11, spending on R&D has seen small increases in real terms, with spending 7% larger in 2017/18 than in 2010/11.
DHSC central capital budgets, NHS England and informatics made up the remaining portions of the budget. The later sections of this briefing focus on the portion spent by NHS trusts.
§ R&D is part of the capital budget of the DHSC. It is not capitalised per accounting standards, and as such R&D in NHS hospitals is part of operating income and operating expenses.
¶ This changed in 2016/17 because of the adoption of the European System of National and Regional Accounts. Table 1 includes R&D in all years.
How does the UK compare?
Although the UK is similar to the EU14 average in overall health care spending as a share of GDP, its share of spending on capital is much lower. Capital-spending data across countries are only available for ‘fixed capital formation’ – that is, the purchase of assets (for example, buildings and scanners) minus the sale of assets in that year. R&D spending by the DHSC may be counted if it involves the purchase or sale of an asset, or leads to intellectual property. PFI and all other private capital spending in health care will also be included. Between 2004/05 and 2010/11, PFI spending averaged about £1.5bn a year.
Figure 2 shows UK capital spending on health care from 2000 compared with other OECD countries. From 2004 to 2009, the UK had large growth in capital spending, bringing it up to the average of comparable countries, at just over 0.5% of GDP. Since then there has been a large fall to 0.27%, meaning it is now at the very low end. Capital spending on health care fluctuates more than revenue spending on health care, as it reflects long-term investment decisions, which are far more sensitive to the state of the economy.
Figure 2: Fixed capital formation in health care, 2000–2016, OECD countries
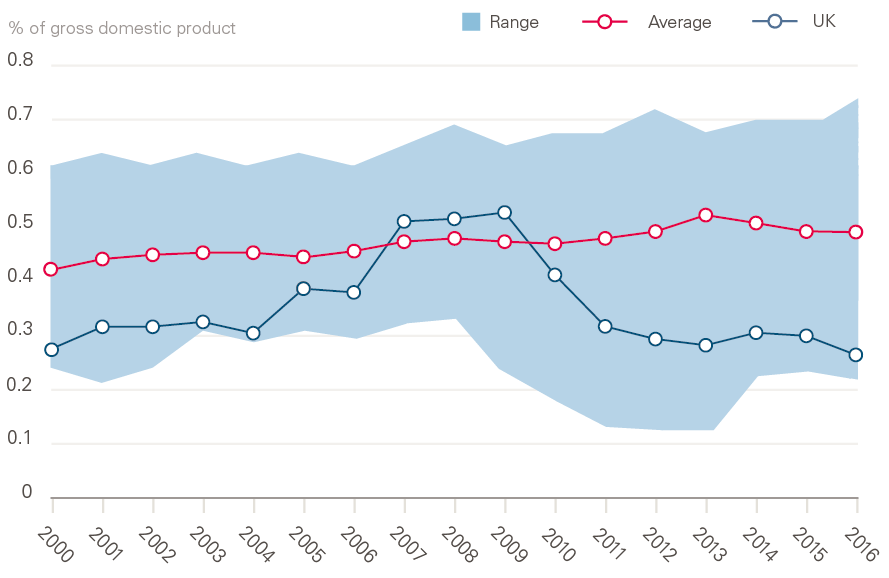
Source: Organisation for Economic Co-operation and Development (OECD) data for OECD countries for which data for all years were available: Austria, Canada, Denmark, Finland, France, Greece, Ireland, Norway, Sweden, USA.
Only a small fraction of the fall in capital spending as a share of GDP is explained by capital-to-revenue transfers in the NHS. For example, in 2016, without a capital-to-revenue transfer in the NHS, capital spending would have been, at most, 0.30% of GDP (compared with the actual figure of 0.27%). This means that the original capital-spending plans would still have been very low by international standards without any transfers. Most of this trend is driven by decisions on how to allocate funds; the UK spends less of its total health care spending on capital compared with other health care systems. For the UK to move up to the average for OECD countries, capital spending would have to almost double as a share of total health spending.
Using the newest OECD data, the cost of bringing the UK up to the OECD average of capital spending as a share of GDP in 2016 would have required an additional £5bn across the UK. We estimate the cost of bringing England up to the OECD average of capital spending as a share of GDP in 2019/20 would require capital funding of £9.5bn, which is an additional £3.5bn (58%) on the 2018/19 capital budget. The autumn 2018 budget has planned for a £6.6bn capital budget for 2019/20. This would rise to about £4.5bn by 2023/24, based on capital-spending levels in 2018/19 and expected GDP growth.
Low levels of capital spending have meant the NHS has been unable to purchase new equipment. Among EU15 and G7 countries, the UK has the lowest number of both CT and MRI scanners per capita, with less than a third of that in Germany (Figure 3). To bring the UK up to the average number of MRI and CT scanners would require approximately £1.5bn in extra capital spending. Consistent with the low rate of diagnostic equipment, the UK also performs well below the OECD average number of CT and MRI scans.
Figure 3: CT and MRI scanners per million population, EU15 and G7 countries, 2016 or nearest years
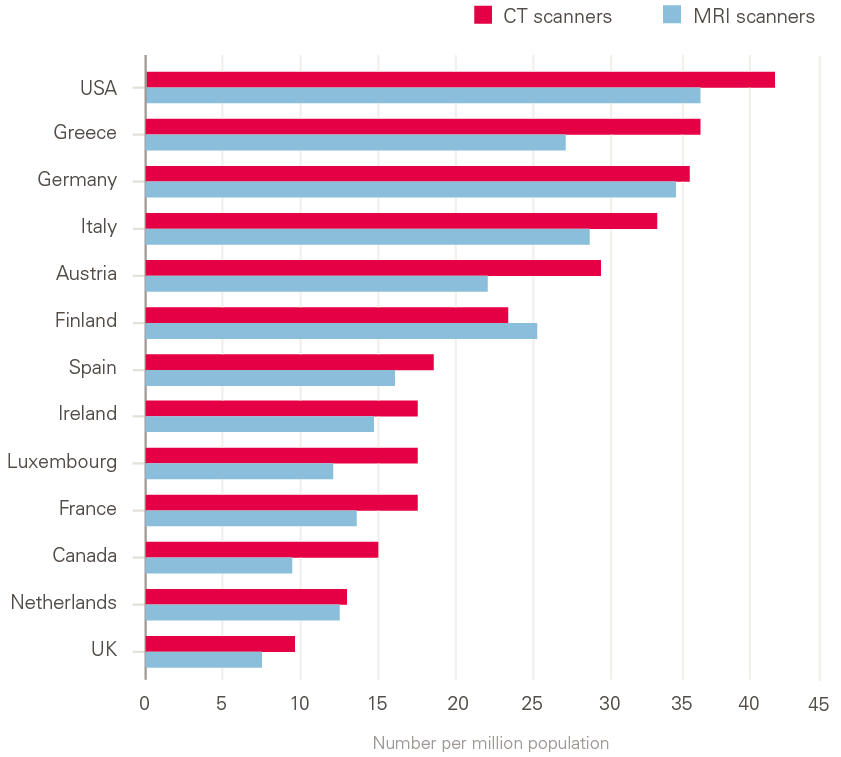
Source: Organisation for Economic Co-operation and Development (OECD) data for EU15 and G7 countries for which data were available.
Note: UK data are from 2014.
Combined with workforce issues, the low number of scanners raises concerns about the NHS’s ability to deal with future health care needs. The NHS Long Term Plan states that funding to be negotiated in the 2019 Spending Review will be used to purchase new equipment, specifically CT and MRI scanners.
** 'EU14' refers to the first 15 countries to join the European Union (EU15), minus the UK: Austria, Belgium, Denmark, Finland, France, Germany, Greece, Ireland, Italy, Luxembourg, Netherlands, Portugal, Spain, Sweden.
†† To calculate the estimate for England, we projected the OECD average gross fixed capital formation on to UK GDP, adjusting for the contribution of England. We then compared this amount to CDEL to estimate the difference.
Trends in capital spending in NHS trusts
The funding rules for all NHS trusts vary, depending on the situation the trust is in. NHS trusts have a capital resource limit, and capital spending over £15m must be approved by NHS Improvement. The capital spending then contributes to the DHSC capital budget. NHS foundation trusts do not have a capital resource limit, unless they are in financial distress. However, in recent times, many have been in deficit, so access to funding has become an issue. Although the capital funding system for NHS trusts is complex, recently many have reported that their access to capital funding has been restricted.
Table 2 shows the proportion of total capital spending from NHS trusts that contributes to the DHSC capital budget. In real terms, capital spending in trusts has fallen 21% between 2010/11 and 2017/18, from £3.9b to £3.1bn – a larger fall than in the overall capital budget.
Table 2: Capital budgets for NHS trusts, 2010/11 to 2017/18 at 2018/19 prices
|
2010/11 |
2011/12 |
2012/13 |
2013/14 |
2014/15 |
2015/16 |
2016/17 |
2017/18 |
|
|
Trust spending (£bn) |
3.9 |
3.2 |
3.5 |
3.5 |
3.5 |
3.1 |
3.0 |
3.1 |
|
Change on previous year |
– |
–18% |
8% |
0% |
1% |
–12% |
–3% |
4% |
Source: Department of Health and Social Care annual reports.
Note: From 2010/11 to 2012/13, spend includes spending by primary care trusts, which have since been dissolved. Spending is net figure, including adjustments for disposals and donations.
Because of repeated capital-to-revenue transfers, capital spending in trusts was 29% lower than originally planned in both 2016/17 and 2017/18. The 2018/19 forecast is for a significant rise in capital spending in trusts – to £4.5bn. However, the DHSC has only made available £3.5bn in funding, leaving uncertainty over where the additional funds will come from.
Low levels of growth in the revenue budget since 2010/11, combined with increasing health care demands, have placed significant operational and financial pressures on NHS trusts. Since 2013/14, trusts have had large deficits every year, including almost £1bn in 2017/18. This funding environment means that many trusts have insufficient cash to implement their capital-spending plans. In 2017/18, trusts required £325m in interim cash support (a type of short-term loan) from the DHSC to be able to pay for their agreed capital-spending plans. Additionally, as the majority of trusts are now in deficit, this limits the funds they can make available for capital investment. The National Audit
Office has found that both trusts and commissioners have issues with the current capital environment, both with access to capital and the length of time it takes to get it.
‡‡ These balances will not reconcile directly to capital spending by trusts, due to adjustments made in CDEL, such as netting off disposals. The residual interest from PFI will count towards CDEL, but the addition of PFI capital itself will not.
Trends in types of capital and capital spending in trusts
The total capital-spending data shown in Table 2 are not available in more detail, such as broken down by type of spending or asset. These data will also include adjustments. For example, sales of capital are deducted from the capital budget, and donations of capital also do not count towards it. There are also adjustments related to PFI.
Therefore, to analyse levels of capital spending in NHS trusts in more detail, we use the trust’s financial statements, which set out additions by type of asset. Additions are all new assets that the trust has obtained during the year, not all of which will count towards the DHSC capital budget. The budget will, however, reflect all the capital each trust has added during the year. We used these data to calculate all the new capital added in NHS hospitals from 2010/11 to 2017/18, by the categories of assets that are shown in the financial statements.
Capital spending in trusts
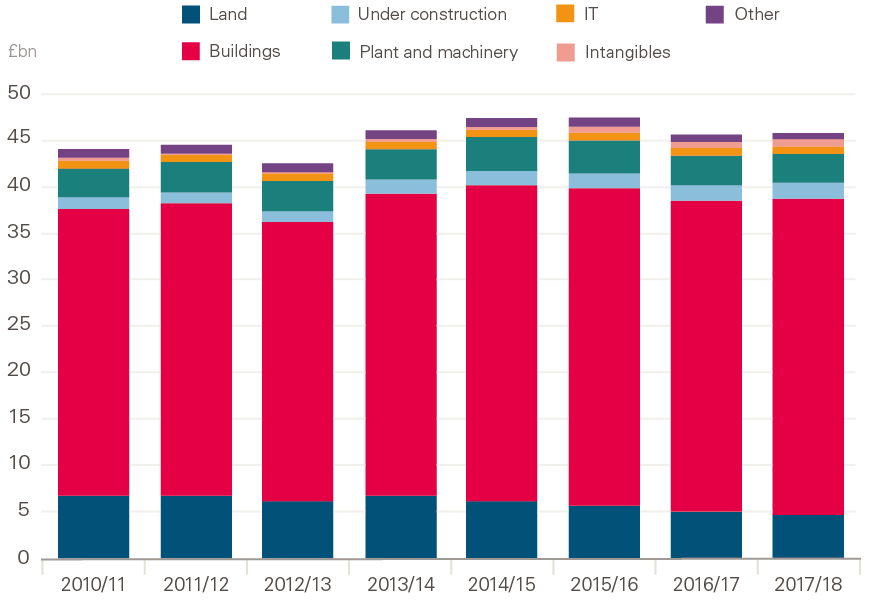
Figure 4 shows the declining trend in capital additions across trusts in England, broken down by asset type. The highest levels of spending were in 2010/11, at £5.8bn, of which about three-quarters was on buildings. 2012/13 had the lowest spending, followed by 2016/17 and 2017/18. Most of this fall in spending has been in spending on buildings, while spending on all other asset types has remained relatively consistent.
Figure 4: NHS trust capital additions, 2010/11 to 2017/18 at 2018/19 prices
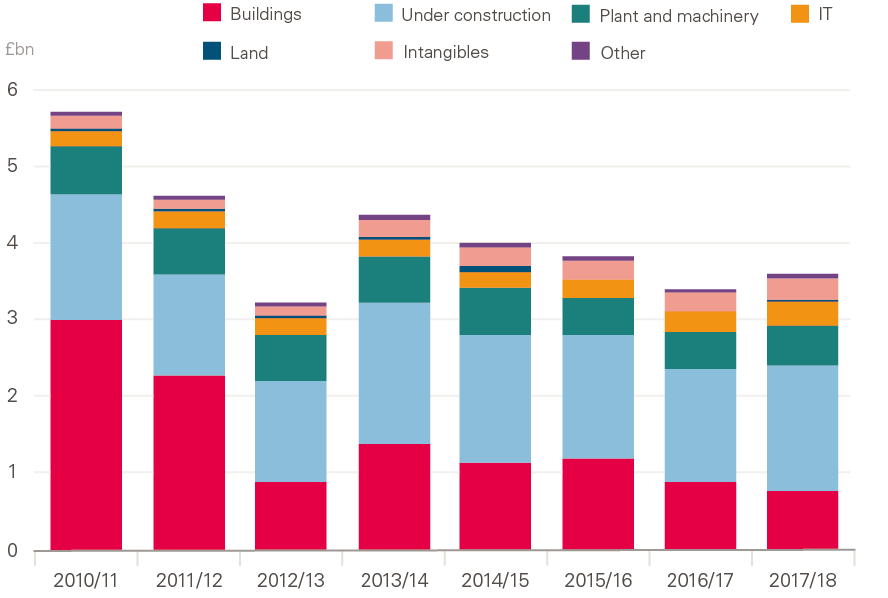
Source: Health Foundation analysis of NHS trust accounts.
Note: ‘Other’ comprises transport equipment, furniture and fittings, and dwellings.
In trusts’ financial statements, assets are classified as ‘assets under construction’ until they are ready for use. Over this period, buildings continue to make up most of capital spending, since they make up over 80% of assets under construction. This is because construction projects often take more than a year to complete and may be paid for over multiple years.
An increasing proportion of capital spending is on IT. This is the result of an increase in spending on IT, but also a reduction in spending on buildings and the associated fall in overall spending. The increase in IT spending is from ‘intangible assets’ (mostly software licences), which more than doubled since 2010/11. Some IT will also be included in the revenue budget, however this spending is not shown in the financial statements. Since 2010/11, spending on plant and machinery has fallen by 13%. Over this time, NHS trusts have added minimal new land.
In 2017/18, acute trusts accounted for 78% of all capital spending, mental health trusts for 9% and specialist trusts for 8%. By comparison, revenue shares were 75% for acute trusts, 14% for mental health trusts and 5% for specialist trusts. This may reflect the fact that acute and specialist trusts have greater capital need due to the nature of their patient care. The type of capital spending also varies by trust type. In 2017/18, mental health and community trusts spent more of their budgets on IT than acute and specialist trusts, but very little on transport equipment and plant and machinery, reflecting the type of services these trusts provide.
Total value of capital in NHS hospitals
When NHS trusts purchase an asset, it is initially measured at its cost price. Over time, as the asset is used, its value depreciates. This depreciation is measured on a straight-line basis, meaning the value depreciates by the same amount every year over the life of the asset. Assets may also become impaired or damaged through use, which reduces their value. Assets owned by hospitals are re-valued at regular intervals, with the accounts adjusted accordingly. These combine to form a net book value of the asset, reflecting its total value at the end of the year.
Figure 5 shows that from 2010/11 to 2014/15, the value of capital in hospitals increased, though there was a fall in 2012/13. The major increase in 2013/14 is from the consolidation of primary care trusts (PCTs) as trusts brought additional capital onto the balance sheet from absorbing PCTs. Between 2015/16 and 2017/18, the value of capital fell by 3%. Overall, from 2010/11 the value of capital rose by 4%. The composition of the types of capital has changed minimally over this period.
Figure 5: Net book value of property, plant and equipment, and intangibles in NHS trusts, 2010/11 to 2017/18 at 2018/19 prices
Source: Health Foundation analysis of NHS trust accounts.
Note: ‘Other’ comprises transport equipment, furniture and fittings, and dwellings.
In 2017/18, buildings made up 74% of total capital, followed by 10% for land, 6% for equipment and 2% for IT. Intangibles are a separate component, and represent another £1bn of capital. Since 2010/11, the value of buildings has increased by £2.9bn, while the value of land has decreased by £2.3bn. The value of equipment has fallen by 10% since 2011/11, while IT has risen by 19%. Intangible assets, mostly IT software, have risen by 67% since 2010/11.
Since 2010/11, buildings have continued to make up most of NHS trusts’ capital. The 2017 Naylor review into NHS property and estates was commissioned to develop a new strategy for NHS estates. It found that 43% of NHS estates are more than 30 years old, with many not fit for purpose or needing significant upgrades to bring them up to a modern standard. Future capital-spending plans need to provide sufficient support for upgrading NHS buildings.
In 2018, the government announced a vision for digital, data and technology in health and care, with the goal of the UK leading the world in health technology. As Figure 5 shows, NHS trusts have seen a 10% fall in plant and machinery since 2010/11. While IT has increased, it still makes up a very small proportion of the total value of NHS capital, at less than 5%. It is unrealistic to expect the NHS to be a world leader in health technology when its capital spending on health care is much lower than in comparable countries, only a very small proportion of this is spent on IT, and spending on plant and machinery is declining. The National Audit Office has recently highlighted the issue of using complex and ageing IT systems for health screenings, which have led to communication errors in screening programmes.
Financing of capital
NHS trusts receive funding for capital spending from a variety of sources, including PFI and donations. In 2017/18, 76% of the capital owned by trusts was purchased by the trusts themselves, 19% was through PFI, and 4% was donated, with the remainder either from government grants or leased. Donations are not split evenly across all trusts, with a few trusts making up the majority of total capital donations. As we noted above, there is still uncertainty around future funding because of the gap in funding that resulted from the ending of PFI.
In this tight funding environment, trusts have been using assets and equipment longer than predicted. This reduces the amount of depreciation, as the value of the asset depreciates over a long period, and so depreciates less each year. This is one contributor to the relatively flat value of capital. Changes in accounting standards throughout the period will also have had an effect on the values, which is difficult to quantify. Trusts have moved to modern-equivalent asset values for specific types of assets, meaning they can re-value the asset according to the value of replacing it to a similar capacity and function.
Disposal of capital
Trusts sell capital, in the form of assets, for a variety of reasons. Sales are deducted from trusts’ total capital spending, increasing the amount they can spend on capital. The Naylor review recommended that part of future capital plans could be funded through disposals of surplus land.
Figure 6 shows the recent increase in disposals by NHS trusts since 2015/16. The highest value of sales, at £417m, was in 2017/18, more than double some of the earlier years. This compares with £3.6bn in additions in 2017/18. The data in Figure 6 reflect the actual cash received in each year for the sale of assets, which may differ from the net book value. If trusts sell an asset at a different price to the book value, the difference is recorded as a profit or loss for the trust.
While the government has committed to proceeds from sales being re-invested, this is not always the case, and in 2017/18 almost two-thirds of the proceeds from land sales went into the revenue, rather than capital, budget.
Productivity and health care
A common metric used to measure capital levels is capital per worker. As the labour force in the NHS has been expanding, capital spending overall and capital per worker have fallen significantly (known as ‘capital thinning’). Having a higher rate of capital per worker (‘capital deepening’) is generally viewed to be a positive contributor to productivity, with the opposite true of capital thinning. This is because workers can perform their work more efficiently when they have more capital (such as machines).
Figure 6: Sale of capital by NHS trusts, 2010/11 to 2017/18 at 2018/19 prices
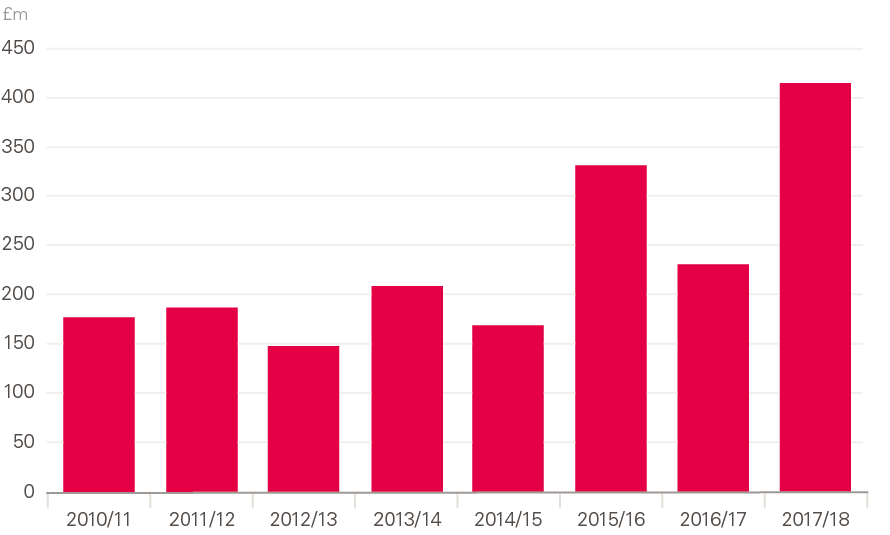
Source: Health Foundation analysis of NHS trust accounts. Values taken from cash flow statement. Values may also include sales of investment assets.
Figure 7 shows the change in capital per worker in NHS trusts, with 2010/11 an index year and staff levels based on full-time equivalent numbers. Capital per worker has been declining since 2010/11, with the lowest level in 2017/18: 17% lower than in 2010/11. The fall is much larger for plant and machinery per worker, which has been consistently declining since 2010/11: by 28% in real terms. The only increase has been in assets under construction, which is mostly incomplete building work. IT and intangibles per worker increased during this period, after falling between 2010/11 and 2012/13. These increases were driven by a significant rise in intangibles (which are mostly software licenses).
Figure 7: Change in capital per worker, 2010/11 to 2017/18 at 2018/19 prices
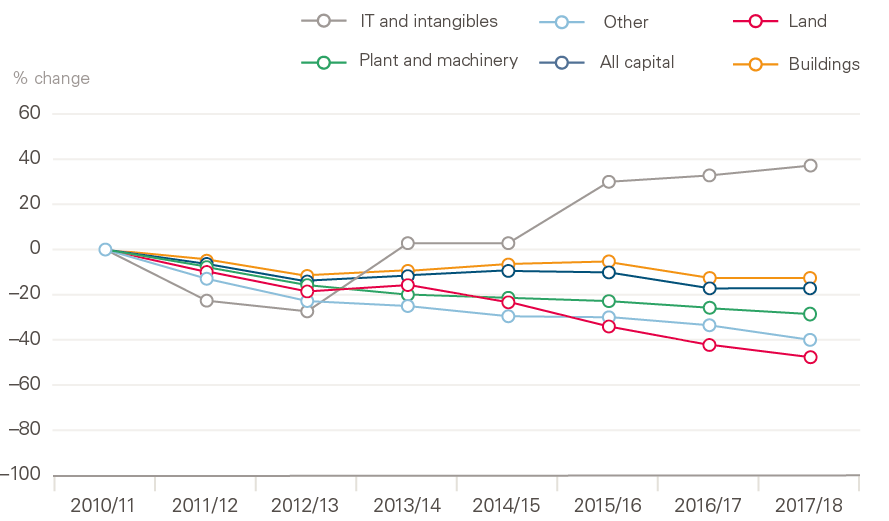
Source: Department of Health and Social Care annual reports, NHS Digital electronic staff records.
Note: 'Worker' refers to full-time equivalent (FTE) staff. Figure compares year-end balances with average FTE in year.
Although it is difficult to quantify the effects of these figures, there is research on the types of capital that are positively linked with productivity in trusts, including IT and equipment. Technology, such as electronic health records, has been associated with improved outcomes.
Even in a labour-intensive industry like health care, the NHS seems to have performed well during this time of reduced capital funding, with productivity rising by 2.1% a year from 2009/10 to 2016/17, including 3% in 2016/17 – a bigger rise than in the wider economy. One reason for this might be that capital investment can take time to deliver productivity gains, meaning this productivity gain could be the result of the large increase in capital spending before 2010. There can also be short-term productivity gains from reducing capital, as inputs (current spending) are reduced relative to outputs, leading to a rise in productivity until output is affected further down the line. The Carter review into variation in the efficiency of acute hospitals noted that trusts view capital investment as a contributor to cost savings, but only in the long term.
Qualitative research commissioned by the Health Foundation finds that many trusts are seeing capital-funding constraints have a direct, negative impact on their ability to deliver optimal care. Staff have reported negative effects on productivity from issues such as equipment shortages and failure. Hospitals are using ageing diagnostic equipment, negatively affecting the ability of clinical staff to perform their work. The research also identifies the built environment as having negative effects on patient care and safety.
Modern technology has the potential to increase productivity within the NHS. For example, digital technology and artificial intelligence may reduce the burden on staff through the automation of repetitive tasks. While the government has committed to a more technologically driven NHS, buildings should also be a focus for improving productivity in hospitals. One example to look to is Denmark, where they have used an expert panel to identify how modern acute hospitals should be designed, making productivity a key metric in design and construction. The built environment must also be considered in the context of the workforce. Buildings that have been well designed can not only improve productivity (for example, by reducing walking times) but also provide a better overall working environment for staff.
A review of the Mental Health Act 1983 found that the physical environment of mental health trusts has been affected by a risk- and infection-averse approach that negates other priorities, such as social interaction and activities.
§§ Once assets under construction are completed, they are reclassified to their respective asset type. Health Foundation analysis of reclassifications since 2010/11 found that over 80% of reclassifications of assets under construction was to 'buildings'.
¶¶ In this publication, the same GDP deflator was used across all asset types, as specific deflators were not available for every type of spending. Although IT spending is flat in cash terms, if specific IT inflation were used, it would be increasing, as IT is becoming cheaper.
*** Although depreciation is straight line, the estimated useful lives can change, which will adjust the amount of depreciation. Land is not depreciated.
††† The additional capital obtained by trusts from absorbing PCTs is not included in additions in Figure 4, as it is a separate item on financial statements.
‡‡‡ Assets below £5,000 are not capitalised, and are expensed. During this period, it is possible that spending on IT expenses increased for low-cost IT, such as software.
§§§ Only foundation trusts can keep all capital money from sales. Trusts and foundation trusts in distress can only keep a certain amount, unless otherwise approved.
Maintenance in NHS trusts
Each year, NHS trusts estimate the size of their maintenance backlog, as well as categorising the necessary repairs by risk level according to the potential impact on clinical service and safety. This data is self-reported by the trusts. ‘High risk’ is where repairs or replacement must be addressed with urgent priority to prevent catastrophic failure, major disruption to clinical services or deficiencies in safety that are liable to cause serious injury and/or prosecution.
The maintenance backlog across the NHS now stands at £6bn, with over half made up of ‘high’ and ‘significant’ risk, the two highest risk categories. From 2010/11 to 2013/14,
the backlog decreased slightly each year in real terms. However, since 2013/14 it has increased each year. The backlog is now larger than the annual DHSC capital budget, and the value of the ‘high’ and ‘significant’ risk backlogs combined – £3.1bn – is similar to the total annual capital spending in all trusts.
In 2017/18, £412m was spent on reducing the maintenance backlog, an increase of 23% on 2016/17. Figure 8 shows that this investment is well below the level required to reduce, or even stabilise, the backlog. Investment would have needed to be 76% (£314m) higher in 2017/18 for the backlog to remain at the same level as in 2016/17.
Figure 8: Investment in maintenance backlog compared with total maintenance backlog by risk type, 2010/11 to 2017/18 at 2018/19 prices
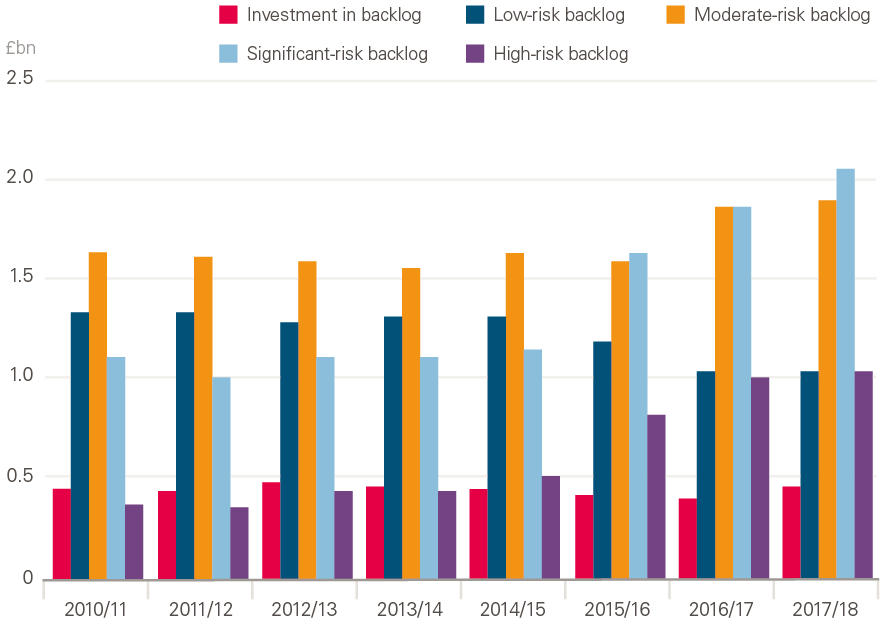
Source: Estates Returns Information Collection.
The occupied floor area of NHS trusts has not increased since 2010/11. Therefore, the increase in the backlog is not driven by an increase in size, but rather an increasing density of maintenance backlog – that is, a larger backlog per square metre.
The acute and specialist hospital sector is over-represented in the backlog figures, making up almost all the recent increases and 93% of the backlog in 2017/18. This is equivalent to making up 79% of the total income of NHS trusts. The size of the backlog will be driven by the larger size of acute and specialist trusts, however the backlog per square metre in acute and specialist trusts was more than double those of community, mental health and ambulance trusts in 2017/18. Acute and specialist trusts also have a far larger ‘high’ and ‘significant’ risk backlog per square metre than other types of trusts. This has coincided with significant short-term financial pressures in acute trusts, with large deficits since 2013/14.
At current levels of investment, the backlog as it stands would take about 15 years to pay off, and 8 years just to pay off the ‘high’ and ‘significant’ risk portions. Investment would have to rise by about three-quarters just to keep the current backlog at the same level going forward. Although one trust has contributed significantly to the rise in the total ‘high’ and ‘significant’ risk backlog in recent years, excluding it from the calculation does not change the overall picture.
It is noticeable that the maintenance backlog began to rise significantly in 2014/15, as transfers from the capital budget started to grow. However, as Figure 8 shows, investment in the backlog did not significantly change during this period. Although low levels of investment in directly addressing the backlog have contributed to its rise, it is likely that the backlog has also been rising from a lack of spending in other areas, such as regular maintenance. Addressing the backlog will need both capital and revenue funds, as maintenance can be classified as either depending on the type of maintenance needed.
It is critical that funding be focused on directly addressing the backlog, especially ‘high’ and ‘significant’ risk. But a better understanding of the drivers of the increase in the backlog is also required. Age is a key factor, as it is expected that older estates will accumulate a larger backlog over time.
Additional funding and a more robust policy for managing maintenance is required to address an issue that cannot be delayed – it will only create additional and more severe problems in future years if the trends of the last 4 years continue.
Are trusts able to reduce their maintenance backlog?
We looked at whether there is a relationship between investment in the backlog and the size of the backlog in acute trusts. We found a slight positive correlation, meaning a larger maintenance backlog was associated with larger investment in the backlog, though much smaller than the size of the backlog. Figure 9 plots investment in the maintenance backlog in NHS trusts in 2017/18 against the total backlog of each trust in the previous year. We only selected 1 year to avoid the issue of serial correlation.
Although there is a slight positive correlation, there are many trusts with large backlog levels but average or below-average levels of investment in the backlog (Figure 9). If trusts were able to increase their spending as the backlog increased, we would expect to see a sharper gradient, to reflect that an increasing backlog is associated with larger increases in investment. When the same correlation was estimated for 2011/12, we found a similar result, suggesting the relationship has not changed much over time. Only a quarter of trusts invested more than 20% of the value of their backlog in addressing it, highlighting the fact that most trusts do not have sufficient capital to invest in the backlog.
Figure 9: Investment in maintenance backlog in 2017/18 and total maintenance backlog in 2016/17, at 2018/19 prices
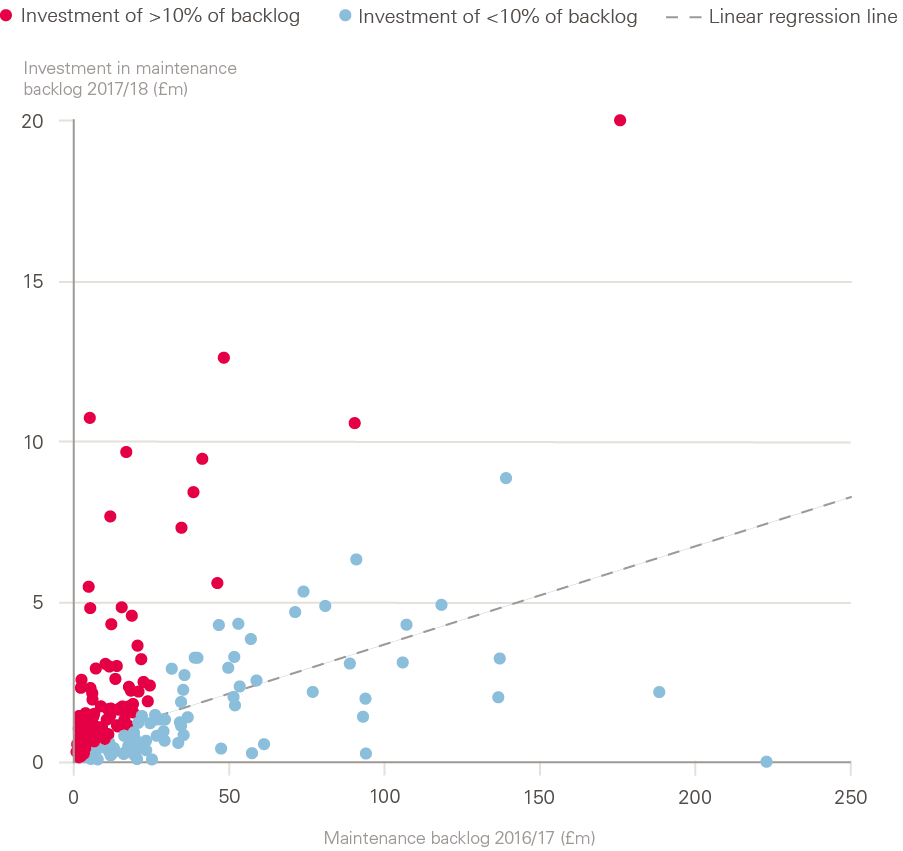
Source: Estates Returns Information Collection, 2016/17 and 2017/18.
Note: The trust with the largest backlog was removed.
These results don’t prove a causal relationship – that is, they don’t prove that a large backlog prohibits a trust from substantially increasing investment, or vice versa – as there could be other factors causing this issue. However, the results do highlight an issue: as the backlog in NHS trusts increases, there isn’t an associated increase in investment to reduce it. This is also consistent with findings from the qualitative research we commissioned, in which one trust noted its ‘high’ risk maintenance backlog was almost four times the size of the capital funding available to address the issue.
Trends in capital and maintenance backlog by area
Future capital-funding allocations must consider the specific needs of each trust. Although clinical commissioning groups receive revenue funding based on local need, this is not the same for the capital budget, which is often selected on a case-by-case basis. To examine capital-funding needs across England, we grouped the total capital and the maintenance backlog by area. We then compared this with the operating income of the trusts in this area to take into account the area size.
As a percentage of operating income, the total value of capital shows some variation across areas, with north-central and east London having the highest relative amount of capital. Differences between these areas will be caused by multiple factors, including the type of trusts that are in each area.
The backlog is relatively similar across the different areas, except north-west London, which has a far larger backlog (mostly due to one trust having almost 10% of the entire NHS maintenance backlog). South London, Yorkshire and the Humber, and the Thames Valley also had slightly higher maintenance backlogs, adjusted for size, compared with the other areas.
Future capital-funding decisions will need to take into account the need for capital in each area, which will include the current capital levels and maintenance backlog. Funding decisions will also be allocated through sustainability and transformation partnerships. These are groups of NHS and local council bodies, and are not as well developed in all parts of the country.
¶¶¶ Although other factors may contribute to the reduction of the backlog, we based this calculation on the investment in the backlog that is reported by NHS trusts.
**** Regular servicing of buildings and equipment would probably be classified as expenses charged to revenue. However, large investment that improves an asset would probably be classified as capital expenditure, with the value depreciated over time.
Discussion
In recent years, the UK has fallen far behind most other OECD countries on capital spending in health care, and the current budget will not alter this trend. This is occurring at the same time as the workforce is increasing – although not as fast as demand for staff – resulting in large declines in the levels of capital per worker. Spending on plant and machinery by NHS trusts has fallen since 2010/11, leaving them with a 10% fall in the value of plant and machinery and a 28% fall in value per worker. Falls in capital per worker will place pressures on productivity. While the value of IT has increased, it still comprises a very small share of the overall capital value of trusts.
There is qualitative evidence that trusts are unable to afford the most modern technology, such as scanners, while many are also using equipment past their estimated useful lives. Low levels of diagnostic equipment threaten the ability of the NHS to improve care in line with commitments made in The NHS Long Term Plan (for example, new rapid diagnostic centres to improve early diagnosis of cancer). A lack of spending on IT means trusts are also using outdated computer systems, and this can have significant consequences, such as people missing breast screenings.
It is unrealistic to expect the UK to lead the world in health technology when its spending on plant and machinery (such as medical equipment) in trusts is declining, and when its overall capital spending is significantly lower than almost all other OECD countries and is budgeted to remain so. To bring the NHS up to the OECD average for MRI and CT scanners would cost approximately £1.5bn. Additionally, with a growing maintenance backlog, trusts will face pressure to spend more of their capital (and possibly revenue) budget on building maintenance, where most of the backlog is, rather than investing in equipment and IT.
Cash-flow problems are also affecting trusts, with the DHSC continuing to provide interim cash support for trusts to implement their capital-spending plans. If capital funding remains at similar levels to the previous 5 years, we can expect no growth in capital spending by NHS hospitals, continued declines in the value of plant and machinery, and an increasing maintenance backlog.
Future budgets will need to take into account that maintenance costs may come from both revenue and capital budgets and adjust spending accordingly, as well as recognising that this issue is not spread evenly across trusts. In addition to capital-funding commitments, the system for allocating capital funding needs to be reviewed to make it simpler for trusts to plan for and receive capital funding. With many trusts still seeing annual deficits, they will also struggle to generate surplus cash that could be used for capital. The autumn 2019 budget announced the end of PFI, which may place further strain on capital budgets, as additional funding will need to be found elsewhere.
Although the government has committed to a £20.5bn increase in funding for the NHS in England by 2023/24, this does not include the capital budget. Capital-to-revenue transfers are expected to continue for at least 1 more year, though they are now lower than they were in previous years. Most concerningly, the DHSC has not adequately investigated how continued capital-to-revenue transfers may be affecting trusts.
The 2019 Spending Review needs to set out a plan for capital investment in the NHS and the management of the maintenance backlog. In 2017, the Naylor review estimated that an additional £10bn in capital investment in the NHS in England was required, including £5bn for the maintenance backlog. But this is now £1bn less than the current backlog.
New technologies, such as genomics, artificial intelligence and digital medicine have the potential to improve productivity – including by freeing up staff time for patient care through automation – and transform how health care is delivered. To successfully implement and manage any new technologies, significant investment in the workforce is needed to make sure it can maximise the benefit in the future. Implementation must also take into account the complex social and organisational contexts in which new technologies are being introduced. While this briefing has mostly focused on capital in hospitals, The NHS Long Term Plan has also committed to improved technology throughout the NHS, including in community care.
Without a significant increase in the capital budget, NHS trusts will not be able to invest in modern technology, improve buildings and address the current and growing maintenance backlog. But any new investment needs to be carefully managed, and it is important to examine both successes and failures in recent times. Implementing large-scale investments in the NHS at a time of unprecedented demand on services is extremely challenging, and large-scale digital changes in the NHS do not have a successful track record.
Conclusion
The government has announced a vision for a more technology- and data-driven NHS. This has the possibility to transform patient services and improve patient care. Yet there is uncertainty around how this vision will be funded, particularly at a time when NHS trusts have had the value of their equipment fall by 10% since 2010/11.
Although the government has pledged an extra £20.5bn in funding for the NHS by 2023/24, this does not include any funding for the capital budget. The 2019 Spending Review needs to make long-term capital-funding commitments.
The capital budget cannot continue to be used to relieve short-term pressures on front-line services. Capital-to-revenue transfers must stop, as they will only continue the current short-termism with regards to capital spending. This is only pushing problems into the future, and has resulted in a growing maintenance backlog and multiple years of negative growth in capital funding. It has also made it difficult to make long-term capital decisions, as there is no certainty about funding.
Capital must be a key component in transforming NHS services. The 2019 Spending Review should include a long-term commitment to capital funding that reverses the recent trends of declining capital spending and a rising maintenance backlog. If capital spending was increased to be in line with the OECD average – as it was between 2008 and 2010 – this would require the DHSC capital budget to be £9.5bn in 2019/20. This would be a £3.5bn increase on top of the current capital budget in 2018/19, rising to £4.1bn by 2023/24.
References
- Department of Health and Social Care. The Future of Healthcare: Our Vision for Digital, Data and Technology in Health and Care. Department of Health and Social Care; 2018 (www.gov.uk/government/publications/the-future-of-healthcare-our-vision-for-digital-data-and-technology-in-health-and-care/the-future-of-healthcare-our-vision-for-digital-data-and-technology-in-health-and-care).
- Dayan M, Ward D, Gardner T et al. How good is the NHS? Health Foundation; 2018 (www.health.org.uk/publications/nhs-at-70-how-good-is-the-nhs).
- Willeme P, Dumont M. Machines that go ‘ping’: Medical technology and health expenditures in OECD countries. Health Economics. 2015; 24: 1027–41.
- Topol E. The Topol Review. Preparing the Healthcare Workforce to Deliver the Digital Future. Health Education England; 2019 (https://topol.hee.nhs.uk).
- HM Treasury. Central Government Supply Estimates 2018–19: Supplementary Estimates. TSO (The Stationery Office); 2019 (www.gov.uk/government/publications/supplementary-estimates-2018-19).
- Kraindler J, Firth Z, Charlesworth A. False Economy: An Analysis of NHS Funding Pressures. Health Foundation; 2018 (www.health.org.uk/sites/default/files/False-economy-NHS-funding-pressures-May-2018.pdf).
- National Institute of Health Research. Who We Are. National Institute of Health Research; 2018 (www.nihr.ac.uk/about-us/who-we-are).
- HM Treasury. Central Government Supply Estimates 2018–10. Supplementary Estimates for the Year Ending 31 March 2019. HM Treasury; 2018.
- National Audit Office. NHS Financial Sustainability. National Audit Office; 2019 (www.nao.org.uk/wp-content/uploads/2019/01/NHS-financial-sustainability_.pdf).
- Healthcare Financial Management Association. NHS Capital – A System in Distress? Healthcare Financial Management Association; 2018 (www.hfma.org.uk/docs/default-source/default-document-library/system-in-distress_nov18-web-v2.pdf?sfvrsn=0).
- Health Foundation, The King’s Fund, Nuffield Trust. Budget 2018: What it Means for Health and Social Care. Health Foundation, 2018 (www.nihr.ac.uk/nihr-in-your-area/infection).
- Appleby J, Gershlick B. Keeping up with the Johanssons: How does UK health spending compare internationally? British Medical Journal. 2017; 358: j3568.
- Naylor R. NHS Property and Estates. Why the Estate Matters for Patients. Department of Health and Social Care; 2017 (https://assets.publishing.service.gov.uk/government/uploads/system/uploads/attachment_data/file/607725/Naylor_review.pdf).
- Organisation for Economic Co-operation and Development. Health at a Glance 2017. Capital Expenditure in the Health Sector. Organisation for Economic Co-operation and Development; 2017.
- Richards M, Thorlby R, Fisher R et al. Unfinished Business: An Assessment of the National Approach to Improving Cancer Services in England 1995–2015. Health Foundation; 2018 (www.health.org.uk/sites/default/files/upload/publications/2018/Unfinished-business-an-assessment-of-the-national-approach-to-improving-cancer-services-in-england-1995-2015.pdf).
- NHS Improvement. Performance of the NHS Provider Sector for the Quarter Ended 30 September 2018. NHS Improvement; 2018 (https://improvement.nhs.uk/documents/3520/Performance_of_the_NHS_provider_sector_for_the_month_ended_30_Sept_18_FINAL.pdf).
- NHS Improvement. Consolidated NHS Provider Accounts 2017/18. NHS Improvement; 2018 (https://improvement.nhs.uk/documents/3018/Consolidated_provider_accounts_201718_web.pdf).
- National Audit Office. Investigation into the Management of Health Screening. National Audit Office; 2019 (www.nao.org.uk/wp-content/uploads/2019/01/Investigation-into-the-management-of-health-screening.pdf).
- Williams I, Allen K, Plahe G. Restricted Capital Spending in the English NHS: A Qualitative Enquiry and Analysis of Implications. Health Services Management Centre (in press).
- Dunhill L. Two-thirds of land proceeds go into revenue, despite reinvestment pledge. Health Services Journal; 12 November 2018 (www.hsj.co.uk/finance-and-efficiency/two-thirds-of-land-proceeds-go-into-revenue-despite-reinvestment-pledge/7023770.article).
- Office for Budget Responsibility. Economic and Fiscal Outlook: March 2018. Office for Budget Responsibility; 2018.
- Williams C, Asi Y, Raffenaud A et al. The effect of information technology on hospital performance. Health Care Management Science. 2016; 19: 338–46.
- Macdonnell M, Darzi A. A key to slower health spending growth worldwide will be unlocking innovation to reduce the labor-intensity of care. Health Affairs. 2013; 32: 653–60.
- Lin SC, Jha AK, Adler-Milstein J. Electronic Health Records associated with lower hospital mortality after systems have time to mature. Health Affairs. 2013; 37: 1128–35.
- Office for National Statistics. Public Service Productivity: Healthcare, England: Financial Year Ending 2017. Office for National Statistics; 2019 (www.ons.gov.uk/economy/economicoutputandproductivity/publicservicesproductivity/articles/publicservicesproductivityestimateshealthcare/financialyearending2017).
- Castelli A, Street A, Verzulli R et al. Examining variations in hospital productivity in the English NHS. European Journal of Health Economics. 2015; 16: 243–54.
- Department of Health and Social Care. Operational Productivity and Performance in English NHS Acute Hospitals: Unwarranted Variations. Department of Health and Social Care; 2016 (www.gov.uk/government/publications/productivity-in-nhs-hospitals)
- Health Foundation, The King’s Fund. Making Change Possible: A Transformation Fund for the NHS. The King's Fund; 2015 (www.kingsfund.org.uk/sites/default/files/field/field_publication_file/making-change-possible-a-transformation-fund-for-the-nhs-kingsfund-healthfdn-jul15.pdf).
- Morgan M. Poor hospital design has an impact on staff, patients and healthcare. British Medical Journal. 2018; 360: k288.
- Department of Health and Social Care. Modernising the Mental Health Act. Final Report of the Independent Review of the Mental Health Act 1983. Department of Health and Social Care; 2018 (https://assets.publishing.service.gov.uk/government/uploads/system/uploads/attachment_data/file/762206/MHA_reviewFINAL.pdf).
- Mills GRW, Deka L, Price ADF et al. Critical infrastructure risk in NHS England: Predicting the impact of building portfolio age. International Journal of Strategic Property Management. 2015; 19: 159–72.
- House of Commons Committee of Public Accounts Sustainability and Transformation in the NHS. Twenty-Ninth Report of Session 2017–19. Committee of Public Accounts; 2018 (https://publications.parliament.uk/pa/cm201719/cmselect/cmpubacc/793/793.pdf).
- Greenhalgh T, Wherton J, Papoutsi C et al. Beyond adoption: A new framework for theorizing and evaluating nonadoption, abandonment, and challenges to the scale-up, spread, and sustainability of health and care technologies. Journal of Medical Internet Research. 2017; 19: e367.
- Maguire D, Evans H, Honeyman M et al. Digital Change in Health and Social Care. The King’s Fund; 2018 (www.kingsfund.org.uk/sites/default/files/2018-06/Digital_change_health_care_Kings_Fund_June_2018.pdf).
Acknowledgements
The authors would like to thank Debbie Patterson and the NHS Improvement economics team for their feedback and insight into this report.