Key points
- This briefing presents the findings of an evaluation into the early effects of introducing integrated care teams (ICTs) in North East Hampshire and Farnham (NEHF), as one part of the Happy, Healthy, at Home primary and acute care system vanguard. Through this evaluation, the Improvement Analytics Unit sought to provide the vanguard with evidence to help inform the development of its services as part of its commitment to learning and continuous improvement.
- In NEHF, ICTs are multidisciplinary teams that meet weekly to develop a care plan for each of their patients and provide more coordinated care. During the study period, the main objectives of the ICTs were to reach patients with the highest need and at highest risk of going into crisis, and – by providing more coordinated care – to improve patients’ health, health confidence, experience and wellbeing and reduce A&E attendances and emergency admissions. Patients in NEHF were referred to ICTs by their GP and other health care workers, who selected patients they considered to have highest need and be at highest risk of going into crisis and who would most benefit from a multi-disciplinary approach.
- The Improvement Analytics Unit examined the impact of ICTs on the hospital use of 774 patients referred to an ICT between July 2015 (when the ICT was first introduced) and May 2017. We could not examine the impact of the ICT on other outcomes, such as health and wellbeing, due to the limitations of NHS data sets. The evaluation assessed the impact of ICTs over and above the effect of other services available in the area, including those developed as part of the vanguard programme. We examined the hospital use of patients for an average of 7 months following referral.
- Compared with other adult patients registered with a GP in the North East Hampshire and Farnham area who were not referred to an ICT, the ICT patients were on average older (81 vs 54 years), had more emergency admissions in the year prior to referral (1.93 vs 0.32) and had more health conditions, particularly those linked to frailty (1.3 vs 0.2). We therefore selected a matched subgroup of non-ICT patients to use as the basis of our comparisons.
- Patients in the matched subgroup were aged 79 (vs 81 for ICT patients), had 1.67 emergency admissions in the prior year (vs 1.93) and 1.2 health conditions on average (vs 1.3). Looking at individual health conditions, the profile was similar to the ICT group, although there were some slight differences. We used multivariable regression analysis when comparing the hospital use of the two groups, with the aim of eliminating (“adjusting for”) the impact of these differences in baseline characteristics.
- After statistically adjusting for differences between the two groups such as age, prior admissions and health conditions, ICT patients experienced emergency admissions 43% more often than matched control patients (95% confidence interval: 23-67% more often), which is equivalent to an average of 0.53 more emergency admissions per person per year after referral (95% confidence interval: 0.28-0.82 more).
- ICT patients also attended A&E 33% more often than the matched control patients in the period following referral to the ICT (95% confidence interval: 16-54% more often), which is equivalent to an average of 0.54 more A&E attendances per person per year (95% confidence interval: 0.26-0.89 more). In contrast, patients referred to an ICT were admitted electively 24% less often than the matched control patients (95% confidence interval: 2-41% lower), equivalent to 0.15 less elective admissions per person per year (95% confidence interval: 0.01-0.25 less).
- When interpreting these findings, it is important to remember that the ICT and the matched control group might have differed in unobserved ways (for example, in their degree of family support, social isolation or severity of or ability to manage their health conditions) and we could not adjust for these statistically as we did for age, prior admissions and health conditions.
- In the absence of a randomised controlled trial, we cannot be sure whether the higher rates of emergency hospital use could be explained by unobserved differences in the characteristics of the two groups. However, it seems unlikely that unobserved differences could explain the much higher emergency admission rates amongst the ICT patients. Furthermore it is very unlikely that any such differences could hide a decrease in hospital use. Therefore, we interpret the findings to show that the ICTs did not reduce A&E attendances and emergency admissions in the early stages (first 23 months) of its implementation and may even have led to increases. Other evaluations of ICTs and similar interventions have reached similar conclusions.,,,
- It is plausible that the greater emergency hospital use of ICT patients was a result of ICTs identifying urgent needs for health care that might otherwise have remained unmet or only been identified later. Another explanation is that the ICTs led to patients being more aware of their health needs, which in turn led to patients attending A&E and being admitted. The lower levels of elective admission among ICT patients might have arisen if some patients were referred to ICTs at a time when they and their doctors had decided to stop curative care such as cancer treatment.
- It is important to remember that this evaluation was conducted less than two years after implementation of the ICTs and does not evaluate the effect of the ICTs after June 2017. Research has highlighted that implementing complex interventions needs time to take effect. This is so that teams introducing these changes can be supported to work through implementation challenges and learn from experience and evaluation. It may be that more time is needed for the benefits of ICTs on hospital use to be seen. It is also important to remember that this evaluation did not examine the impact of the ICTs in improving the coordination of care or improving patients’ health, health confidence, experience of care and quality of life. However, the value of integrated care teams might relate to improving these other areas rather than reducing emergency hospital admissions. There is also a need to monitor the ongoing impact of the ICTs in NEHF, especially since the ICTs have continued to evolve, and have already been adapted in response to learning.
The Improvement Analytics Unit
The Improvement Analytics Unit is an innovative partnership between NHS England and the Health Foundation that provides robust analysis to help health services improve care for patients. We use advanced statistical techniques to provide evidence of whether local change programmes are having an impact on improving the quality and efficiency of care. This is done by assessing whether the care outcomes for patients in a local improvement programme – for example, as part of a new care model or a sustainability and transformation partnership – are different in any significant way from the outcomes of patients who have not experienced a similar initiative.
Our aim is that our analysis helps NHS providers, their partners and commissioners. We do this by robustly identifying whether change has happened when a new initiative is implemented, to identify whether it is working well or needs to change to succeed.
For more information see: www.health.org.uk/IAU
Background
Patients with complex needs, long-term conditions, older age or frailty often receive fragmented care, delivered by multiple health professionals across different organisations. This can result in poorly coordinated care and risks to quality and safety. Integrated care aims to improve patient care and experience by enabling different health care professionals to work together to deliver more coordinated care, and providing services around the needs of the patient. Integrated care projects often aim to also reduce hospital admissions and associated health care costs of patients with complex long-term conditions., However, the integrated care projects that have been evaluated rigorously over the last decade or longer have had mixed results in this respect.,,,,,,
This report presents the findings from the Improvement Analytics Unit’s evaluation of integrated care teams (ICTs) implemented as part of the Happy, Healthy, at Home vanguard.
Happy, Healthy, at Home vanguard
The North East Hampshire and Farnham Clinical Commissioning Group (NEHF CCG) plans and funds health care for around 225,000 people registered at 23 general practices. In April 2015, the Happy, Healthy, at Home primary and acute care system was established as one of NHS England’s New Care Models vanguards, aiming to improve outcomes and experience for local people (see Box 1). This was a partnership between NEHF CCG, Frimley Health NHS Foundation Trust, Southern Health NHS Foundation Trust, Surrey and Borders Partnership NHS Foundation Trust, Virgin Care, South East Coast Ambulance Service, North Hampshire Urgent Care, Hampshire and Surrey county councils and the voluntary sector. One of the core services of the vanguard was ICTs, described in the next section.
Integrated care teams
To further its aims, the vanguard introduced an ICT in each of NEHF’s five localities of Farnborough, Farnham, Yateley, Fleet and Aldershot in July 2015.
The main objectives of the ICTs were to reach patients with highest need and at highest risk of going into crisis, and – by providing more coordinated care – to improve patients’ health, health confidence, experience and wellbeing and reduce A&E attendances and emergency admissions.
The ICTs aimed to proactively deliver joined-up care across primary, community, mental health, social care and voluntary services and develop a single, coordinated care plan for each patient referred to its services. Each ICT comprised a clinical lead, ICT coordinator, community matron, social worker or care manager, mental health practitioner, ambulance service or community paramedic, social prescribing coordinator, dementia practitioner and pharmacist. These core members attended weekly meetings where patients were discussed, as needed. Newly referred patients were discussed at the first meeting following referral to agree an action plan and assign a primary contact within the ICT for the patient. Teams could draw on extra expertise as needed, such as a palliative care nurse. Where appropriate, ICTs could organise prompt visits from specialists to a person’s home, such as dementia assessments and podiatry appointments. Most referrals to ICTs were made by GPs but other health care workers (eg community, mental health and social care staff) also made referrals.,
Each of the five localities developed the ICTs organically to best meet local needs and developed at different paces. The five locations differed in how they implemented their ICTs and selected patients. For example, Farnham’s ICT coordinator informally discussed progress on actions with team members daily, rather than weekly as in other localities., Three localities had difficulty securing a mental health representative. Initially, GPs across the CCG differed in their level of engagement with the initiative, so the numbers of patients referred to ICTs were in general low in the first few months. By May 2017, around 1,000 patients had been referred.
Although the vanguard intended to use a risk stratification tool to help select patients, at the time of launch this was not routinely available to GPs and it instead asked GPs and other referrers to use their clinical judgement to identify patients whom they felt would most benefit from the ICT because they were at highest risk and need. Although work is ongoing to develop a more explicit and consistent set of criteria for referral across all localities, including selecting patients using a risk stratification tool, this was not in place during the period of our evaluation. An exception is Farnham, which has since March 2017 employed a proactive case lead who has combined a risk stratification tool with various data sources and clinical judgement to proactively identify patients for referral.
The CCG estimates that over a third of patients referred to an ICT also received other vanguard interventions, such as Enhanced Recovery at Home.
Other changes to services in North East Hampshire and Farnham
Frimley Park Hospital, the main hospital servicing the NEHF population and which provides around 80% of its acute cure, opened an ambulatory emergency care unit which started seeing patients in November 2016. The unit aimed to provide emergency care and discharge patients in the same day, thereby avoiding unnecessary admissions to wards.
About this evaluation and analysis
The Improvement Analytics Unit examined the impact of ICTs on referred patients’ hospital use, since one of the objectives of the ICT was to reduce emergency admissions and A&E attendances. We could not examine the impact of the ICT on other outcomes, such as health and wellbeing, due to the limitations of NHS data sets, although the ICTs might have led to improvements in these areas.
The evaluation was conducted at an early stage of implementing the ICTs. We shared the findings of our analysis with NEHF in March 2018 and aimed to provide insights that, when combined with other local evidence on progress made on other ICT objectives, would inform the development and continuous improvement of the services provided by the vanguard. This study does not evaluate the effect of the ICTs after June 2017.
We sought to measure the effect of ICTs over and above other local services including the other Healthy, Happy, at Home interventions. We therefore compared ICT patients with other patients registered with a GP in the NEHF area. These control patients were selected to be similar to the group who was referred to the ICTs (eg in age and health conditions) and had similar access to health care services but were not referred to the ICT.
Our evaluation included patients referred to an ICT between 27 July 2015 and 21 May 2017. We analysed the impact of the ICTs on hospital use for patients from the date of their referral to 18 June 2017 (unless they left their NEHF GP or died before then). This meant we examined the impact on hospital use over different amounts of time for each patient, ranging from 1 to 23 months, depending on when they were referred to the ICT.
The five localities in the CCG differed in how they implemented ICTs, which patients they targeted, and which other vanguard interventions were available. Therefore, we conducted a subgroup analysis that examined the impact of the ICT in each locality separately. We also performed a subgroup analysis to examine the impact of the ICTs for patients with mental health conditions. Mental health care was a key component of the ICTs, which accepted referrals from mental health care workers and included mental health practitioners as part of their teams. A patient was identified as having a history of mental ill health if they had at least one inpatient admission or outpatient appointment in the three years before referral under the care of a mental health consultant or where a diagnosis of any mental and behavioural disorder was recorded. Mental health diagnoses include conditions such as depression, schizophrenia and dementia.
We conducted all our analyses according to a statistical analysis protocol, which was finalised before analyses began and was subject to two independent academic peer reviews.
Data used in the analysis
We used various data sources for this analysis. NEHF CCG provided the Improvement Analytics Unit with a pseudonymised list of patients referred to each ICT and the date of referral. Processing of these data with the Improvement Analytics Unit is covered by existing legal agreements and legislation and was captured in a privacy impact assessment agreed to by all organisations involved.
The National Commissioning Data Repository (NCDR) provided the Improvement Analytics Unit with data based on pseudonymised monthly extracts of the National Health Applications and Infrastructure Services (NHAIS) database. This lists people registered at each general practice in England, including their pseudonymised NHS number and month and year of birth and, where applicable, death. These data allowed us to estimate the dates patients registered with a general practice in the area, left that practice or died, if applicable.
We used pseudonymised Secondary Uses Services (SUS) national administrative data from the NCDR to determine patients’ health conditions and hospital use. At no point did the Improvement Analytics Unit have access to patient identifiable data.
Identifying patients for the ICT group
The evaluation included patients who were referred to an ICT between 27 July 2015 and 21 May 2017, and were:
1.0 registered with a NEHF GP for at least 1 month
2.0 admitted to hospital at least once in the 3 years before being referred to the ICT (as information on prior health conditions was needed to select a control group).
Of the 1,039 patients referred to ICTs, 774 (74%) met the selection criteria and were included in the study. We excluded 124 patients (12%) because they had not been admitted to hospital in the prior three years; and a further 141 patients for other reasons (see technical appendix, Figure A2).
Selecting a matched control group
To select a matched control group, we first identified a pool of potential control patients from NEHF who were not referred to an ICT before 18 June 2017. We applied the same criteria as in 1.0 and 2.0. Also, only patients aged within two years of the youngest and oldest ICT patients were eligible. We selected matched controls from within NEHF (rather than from other areas) because we wanted to assess the impact of the ICT over and above other services available to patients in NEHF, and because this approach is more robust to methodological problems.
In total, 78,005 patients met the selection criteria and so were in the pool of potential control patients. After monthly start dates were assigned to each patient, 750,339 potential control records were generated. We selected a subgroup of these patient records that were similar to the ICT patients at the point at which they were referred to the ICT, using a process called ‘matching’. We aimed to produce a matched control group that was similar to the ICT patients with respect to variables that might affect hospital use, including a patient’s age, ethnicity, place of residency (home or care home), existing health conditions (including history of mental ill health) and hospital use before referral to the ICT. We also selected control patients at a similar point in time to the referred patients and who lived in an area with similar levels of socioeconomic deprivation (see technical appendix, Table A1). We paired each ICT patient to a control patient in the same locality.
The matched control group comprised 774 patient records (hereafter referred to as matched control patients) from 731 unique patients (see technical appendix, Table A1).
We assessed whether the matched control patients had similar mortality rates to ICT patients as a check for unmeasured differences between the groups. As we did not expect ICTs to affect death rates, a difference in death rates might suggest unmeasured differences between the groups. Identifying unmeasured differences was a particular concern, as health care professionals may have selected patients for the ICTs based on information that was not recorded in our data sets (see page 13 for findings).
We compared ICT patients and matched control patients using multivariable regression analysis. Matching and regression generally perform better in combination than separately at estimating the effect of interventions accurately. The aim of the adjustment is to control statistically for the differences that remained between the two groups after matching, so that, for example, any differences in age, prior admissions and health conditions should not explain the relative difference in how often the two groups used hospital services after referral to the ICT. However, the regression cannot adjust for variables that were not recorded in our data sets, such as the degree of family support, social isolation and ability to manage their health conditions and the severity of these conditions.
The regression models produced ‘best estimates’ of the relative difference in hospital use between ICT patients and the matched control group, together with a 95% confidence interval. The confidence intervals show some of the uncertainty in the results by providing a range around the ‘best estimate’ in which we can be relatively certain the true value lies. But the additional uncertainty due to the risk of unobserved differences between the two groups is not captured by the confidence intervals, so the results need to be interpreted with caution. Please see the technical appendix for further details.
Measuring hospital use
Once a matched control group had been selected, the Improvement Analytics Unit compared the hospital use of patients referred to an ICT with the matched control patients.
The following measures relating to emergency hospital care were analysed:
• A&E attendances
• emergency admissions
• average length of stay (nights spent in hospital) following emergency admission
• total bed days following emergency admissions (ie total number of bed days across all emergency admissions), excluding same-day admissions
• emergency readmissions within 30 days of discharge from hospital
• emergency admissions for chronic ambulatory care sensitive conditions (see Box 2)
• emergency admissions for urgent care sensitive conditions (see Box 2).
These other hospital care measures were also analysed:
• average length of stay (nights spent in hospital) following elective admission
• total bed days following elective admissions, excluding same-day admissions
• outpatient attendances (ie excluding appointments that the patient did not attend)
• proportion of deaths in hospital (as a proxy for dying in preferred place of death).
Results
Patients in the matched control group had broadly similar characteristics to ICT patients
Patients referred to an ICT were on average 81 years old, and 43% were men. They had a broad range of health conditions at the time of referral. For example, 65% had uncomplicated hypertension and 38% had had a fall or significant fracture in the three years before referral. Compared with other adults registered with a GP in the North East Hampshire and Farnham area who were not referred to an ICT, the ICT patients were on average older (81 vs 54 years), had more emergency admissions in the year prior to referral (1.93 vs 0.32) and had more health conditions linked to frailty (1.3 vs 0.2) (Figure 1 and technical appendix, Table A1).
As expected, patients in the matched control group had similar characteristics to the ICT group, with an average age of 79 years (vs 81 for ICT patients), 1.2 health conditions linked to frailty (vs 1.3), and having 1.67 emergency admissions in the prior year (vs 1.93). The percentages of patients with each health condition was generally similar between groups (Figure 1, technical appendix, Table A1). But there were some differences, which we adjusted for in subsequent analyses as much as possible, for example:
• ICT patients tended to have had slightly more underlying health conditions than the matched control patients
• ICT patients historically experienced slightly more emergency hospital use than the matched control patients
• a higher proportion of ICT patients had mental ill health in the past (55% versus 47% for the matched control patients).
On average, ICT patients were in the study for 202 days (standard deviation 133 days), and for the matched control group the study period was 230 days (standard deviation 175 days). This equates to about 7 months for ICT patients and 8 months for the control patients.
For more details on how closely matched the two groups were, see the technical appendix, Table A1 and Figure A3.
Figure 1: Percentage of patients with various health conditions at time of referral
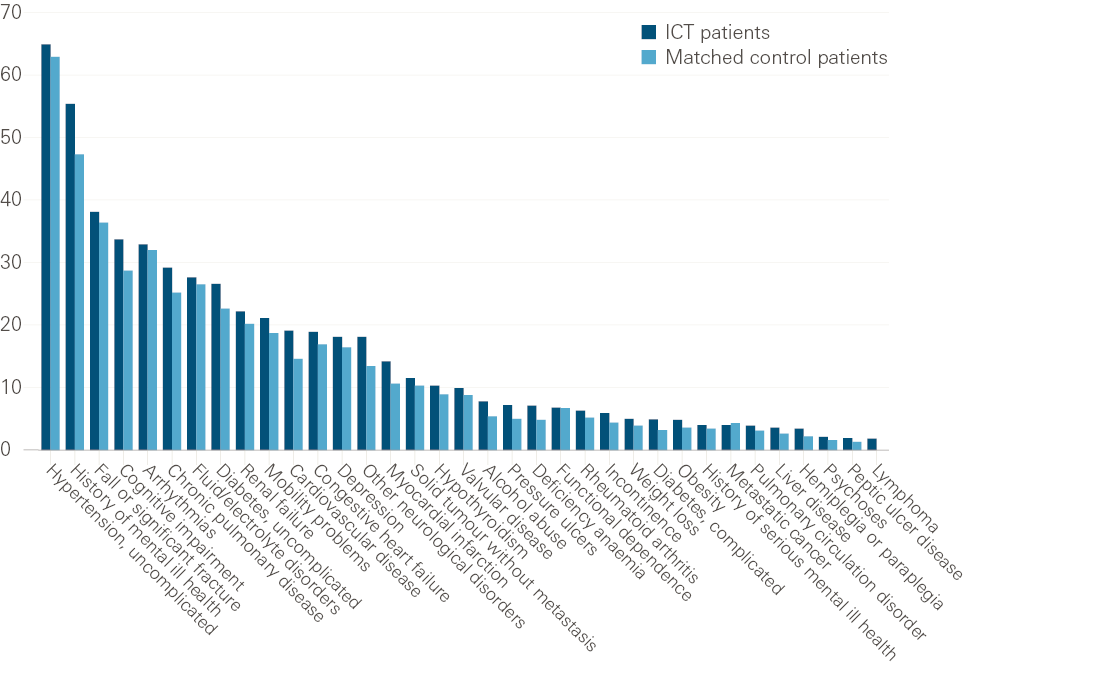
Note: Percentages are based on the diagnoses recorded on inpatient records during the three years before referral. Comorbidities with counts of less than 10 are not shown.
Between the time ICT patients were enrolled into the ICT and our study ended on 18 June 2017, 19.3% died, compared with 15.8% of matched control patients. After adjusting for some remaining differences between the characteristics of the two groups, there was no conclusive evidence that ICT patients had a higher death rate than the matched control patients (22% higher odds of dying; 95% confidence interval: 12% lower to 68% higher). However, this does not preclude that ICT patients may still be different from matched control patients in unobserved ways, such as being more severely ill (see technical appendix, Table A3 and Table A4).
Outcomes excluded from the report
When comparing the ICT and matched control group on the outcome measures for emergency bed days, elective bed days and average length of stay following elective admission, it was not possible to adjust for any observed differences between the groups remaining after matching. This was because of technical difficulties fitting the statistical models for these outcomes. So we did not consider findings for these outcomes to be informative and have not presented them in this report.
ICT patients appeared to use more emergency hospital care than matched control patients in their first year after referral
We assessed how patients’ hospital use changed over time. The left-hand side of each chart in Figure 2 shows crude rates of hospital use (per person per quarter) before study entry (ie before referral to an ICT). The ICT patients had a large increase in hospital use – particularly emergency use – in the 3 months before their referral. This finding is consistent with GPs and other health care workers referring patients with high risk of going into crisis and need. The observation underlines the importance of using a control group, since we would expect these patients to show reductions in hospital use over time as their crisis resolves. Our matched control group showed a similar increase in hospital use before study entry to the ICT patients, which adds to our confidence that the two groups were similar.
The right-hand side of each chart shows hospital use after study entry. ICT patients appeared to use more emergency hospital care in the first four quarters after referral than the matched control patients. This pattern was seen for all measures except outpatient attendances and elective admissions.
Hospital use appeared to reduce over time in the ICT group for the small number of patients who were in the study for more than a year; for most measures, rates of hospital use were lower for ICT patients than the matched control patients by quarter five or six. However, patient numbers were small in later quarters (eg only 39 ICT patients and 87 matched patients were tracked in quarter 6) and are therefore not reliable (see technical appendix, Table A2).
Figure 2: Rates of hospital use over time
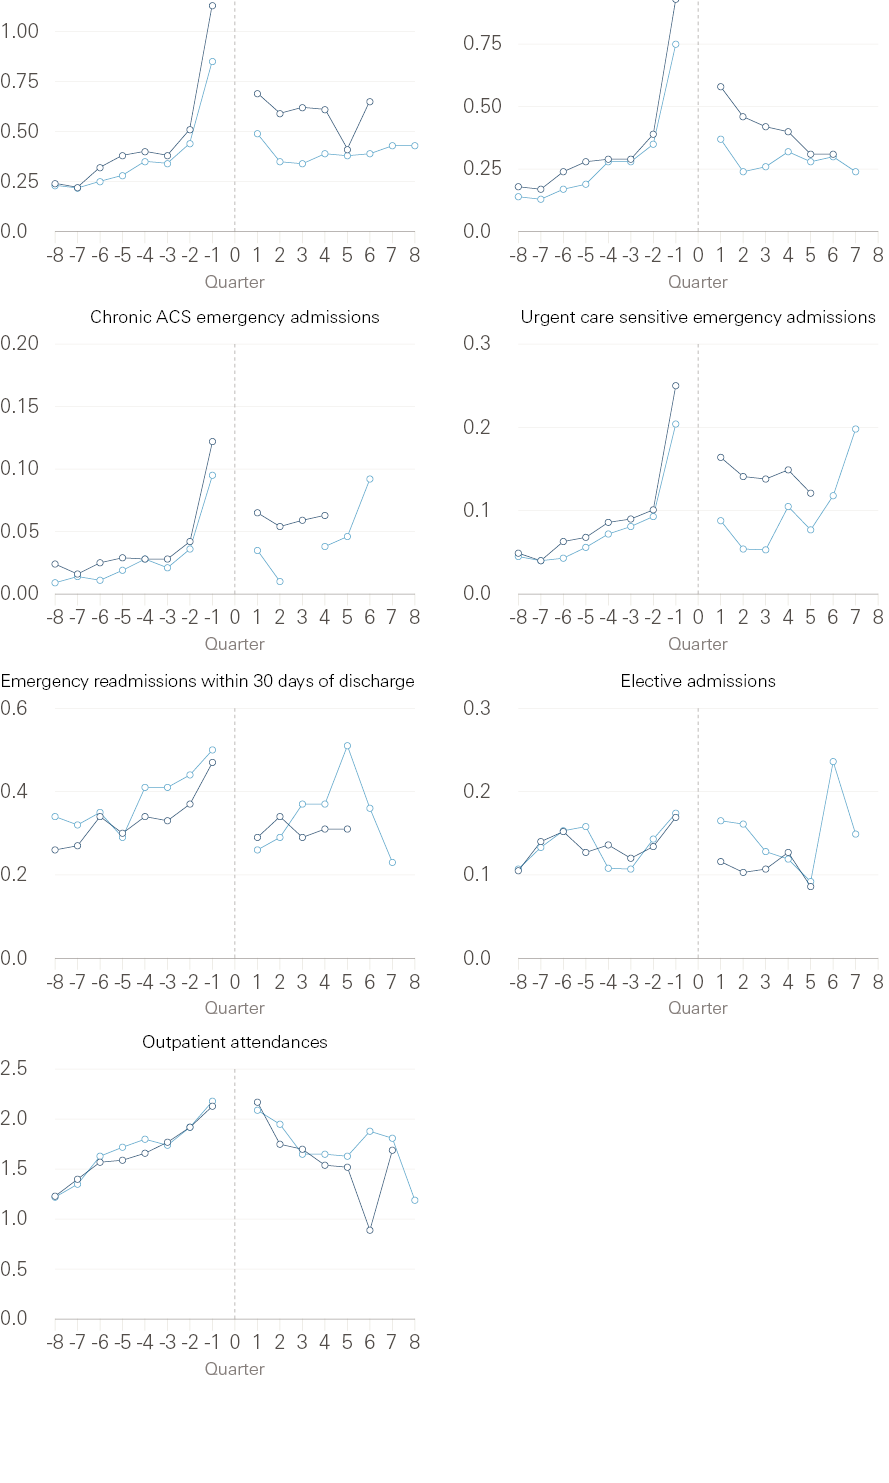
ICT patients = dark blue; Matched control patients = light blue
Note: Plots show the crude rate of hospital use per person per quarter before and after study start (ie referral date for ICT patients) shown by the dotted line. Average length of stay following emergency admission is not shown, as a hospital stay could span more than one quarter. Figures are based on the number of person-days the patient group was in the relevant quarter. Where, in a given quarter, the number of patients was below 10 or the number of events was below 5, data points are not shown.
ICT patients had higher rates of emergency hospital use than matched control patients
Table 1 compares the emergency hospital use of ICT patients after referral with the use of the matched control patients over the same period. ICT patients attended A&E an average of 2.55 times per year, compared with 1.65 times per year among the matched control patients. After adjusting for remaining differences in the baseline characteristics of the two groups, ICT patients attended A&E 33% more often than the matched control patients (95% confidence interval: 16-54% more often). This means that ICT patients went to A&E on average 0.54 more times per person per year than the matched control patients (95% confidence interval: 0.26-0.89 more).
After referral, ICT patients were admitted to hospital as an emergency an average of 1.98 times per year, compared with 1.23 times for the matched control patients. After adjustment, ICT patients underwent emergency admission 43% more often (95% confidence interval: 23–67% more often) than the matched control patients, which is equivalent to ICT patients experiencing on average 0.53 more emergency admissions per person per year than the matched control patients (95% confidence interval: 0.28-0.82 more).
In our data, it was not possible to differentiate between admissions to the ambulatory emergency care unit and emergency admissions to wards. However, we found that 18% of ICT patients’ emergency admissions were ‘same-day’ admissions (meaning that the patient was admitted and discharged on the same day), compared with 23% in the matched control group (see technical appendix, Table A6).
The average length of ICT patients’ hospital stay after emergency admission was 12.23 nights, compared with 11.12 nights for matched control patients. After adjustment, this represents a 33% longer stay for the ICT patients (95% confidence interval: 8–63% longer) or an average stay that was 3.67 days longer amongst ICT patients than matched control patients (95% confidence interval: 0.89-7.01 longer).
ICT patients had on average 0.24 admissions for chronic ambulatory care sensitive conditions per person per year, compared with 0.12 among matched control patients. After adjustment, these were found to occur twice as frequently among ICT patients than matched control patients (105% more frequent; 95% confidence interval: 32-222% more frequent), which equates to 0.13 more of these admissions per person per year (95% confidence interval: 0.04-0.27 more). Of ICT patients’ chronic ambulatory care sensitive admissions, 13% were same-day, compared with 17% in the matched control group.
ICT patients had on average 0.60 emergency admissions for urgent care sensitive conditions per person per year, compared with 0.32 in the matched control group. After adjustment, ICT patients were admitted as an emergency for such conditions 76% more often than matched control patients (95% confidence interval: 35-129% more often), which equates to 0.24 more of these admissions per person per year (95% confidence interval: 0.11-0.41 more). Of ICT patients’ urgent care sensitive admissions, 18% were same-day, compared with 31% of the matched control patients.
Table 1: Comparison of the rate of emergency hospital use between groupsNote: A&E attendances and emergency admissions were adjusted for all observed baseline characteristics; all other outcomes were adjusted for a smaller number of variables (see technical appendix,14 Table A5 for more details). The measure emergency bed days is not presented as it was not possible to adjust for remaining differences between the groups.
|
Measure |
Crude rate (number per person per year) |
Absolute difference (per person per year, adjusted) |
Relative difference (adjusted rate ratio) |
p-value |
|||
|
ICT patients |
Matched control patients |
Best estimate |
95% confidence interval |
Best estimate |
95% confidence interval |
||
|
A&E attendances |
2.55 |
1.65 |
0.54 more |
0.26 to 0.89 more |
33% higher |
16% to 54% higher |
<0.001 |
|
Emergency admissions |
1.98 |
1.23 |
0.53 more |
0.28 to 0.82 more |
43% higher |
23% to 67% higher |
<0.001 |
|
Chronic ambulatory care sensitive emergency admissions |
0.24 |
0.12 |
0.13 more |
0.04 to 0.27 more |
105% higher |
32% to 222% higher |
0.001 |
|
Urgent care sensitive emergency admissions |
0.60 |
0.32 |
0.24 more |
0.11 to 0.41 more |
76% higher |
35% to 129% higher |
<0.001 |
|
Average length of emergency stay, nights |
12.23 |
11.12 |
3.67 more |
0.89 to 7.01 more |
33% higher |
8% to 63% higher |
0.005 |
|
Emergency readmissions within 30 days of discharge |
0.33 |
0.30 |
0.01 more |
0.03 fewer to 0.06 more |
4% higher |
11% lower to 21% higher |
0.621 |
We examined the primary diagnoses that were recorded on emergency admission to better understand the reason for the higher emergency admission rate seen among ICT patients. This may have been driven by larger numbers of admissions for ‘other diseases of the urinary system’, and ‘infections of skin and subcutaneous tissue’ (Figure 3). These categories are nearly entirely made up of urinary tract infections and cellulitis (e.g. infected bed sores), respectively.
Figure 3: Primary diagnosis at emergency admission
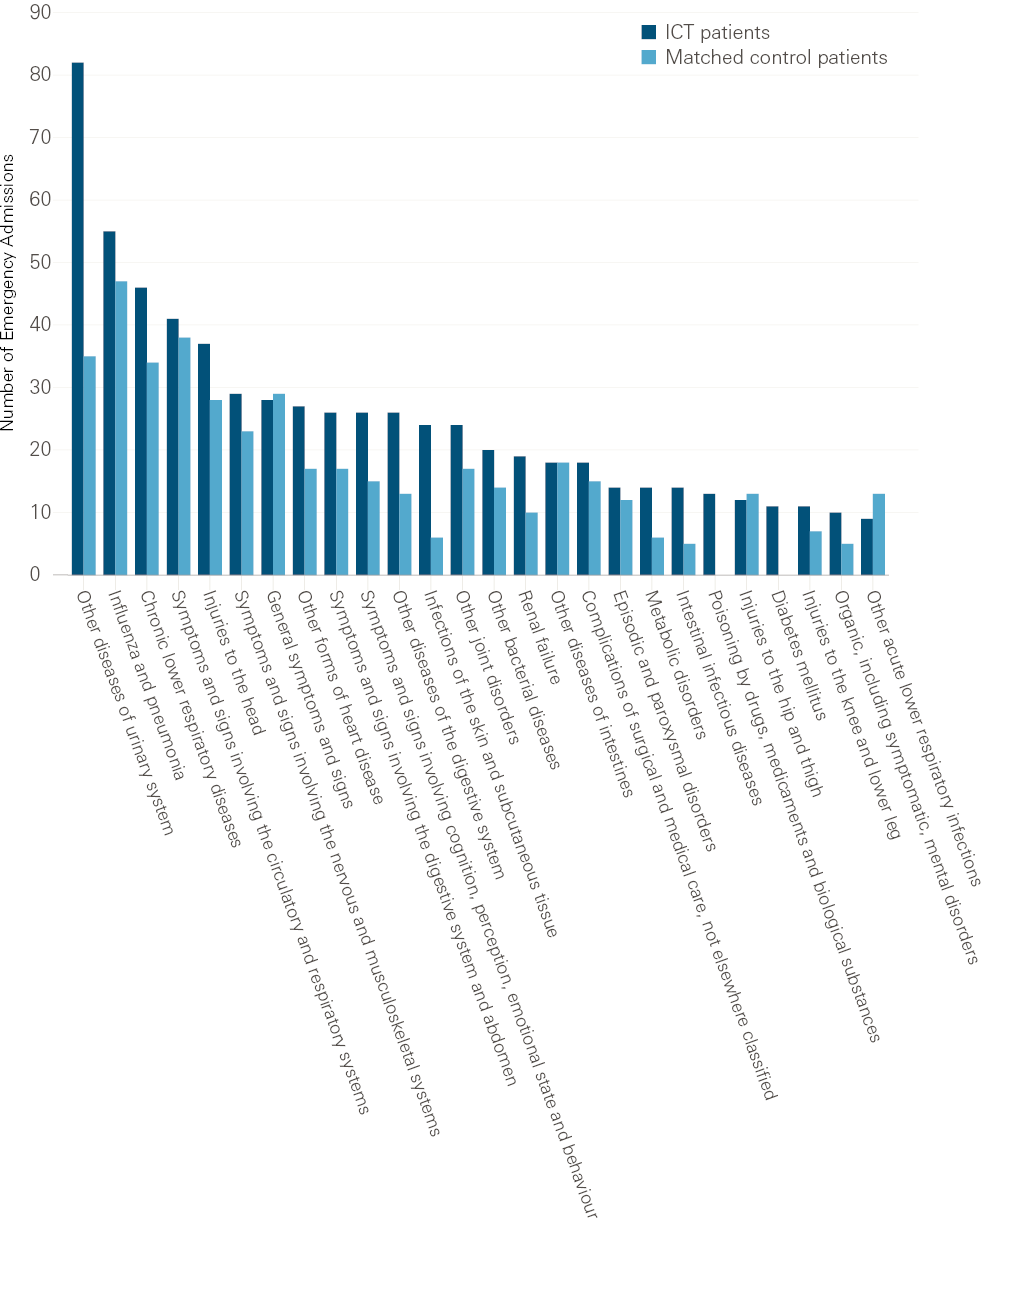
Note: This figure shows a breakdown of primary diagnosis International Classification of Diseases, 10th revision (ICD-10) sub-chapters. Only conditions for which at least 10 people were admitted in either group are presented. Conditions for which there were less than five admissions are not shown.
There was no evidence that the rate of emergency readmissions within 30 days of discharge differed between groups (see Table 1).
ICT patients appeared to have fewer elective hospital admissions but similar levels of outpatient attendance
ICT patients tended to have fewer elective hospital admissions than the matched control patients after referral; they were admitted to hospital electively an average of 0.44 times per person per year, compared with 0.61 times amongst the matched control patients (see Table 2). After adjustment, this represented 24% fewer elective admissions for ICT patients (95% confidence interval: 2–41% lower) or 0.15 fewer elective admissions per person per year, compared with matched control patients (95% confidence interval: 0.01-0.25 fewer).
Table 2: Comparison of rates of elective and outpatient hospital use between groups
|
Measure |
Crude rate (number per person per year) |
Absolute difference (per person per year, adjusted) |
Relative difference (adjusted rate ratio) |
p-value |
|||
|
ICT patients |
Matched control patients |
Best estimate |
95% confidence interval |
Best estimate |
95% confidence interval |
||
|
Elective admissions |
0.44 |
0.61 |
0.15 fewer |
0.01 to 0.25 fewer |
24% lower |
2% to 41% lower |
0.031 |
|
Outpatient attendances |
7.56 |
7.58 |
0.23 more |
0.61 fewer to 1.29 more |
3% higher |
8% lower to 17% higher |
0.581 |
Note: Outcomes were adjusted for some, but not all, observed baseline characteristics (see technical appendix, Table A5 for more details). The measures average length of stay following elective admission and elective hospital bed days are not presented as it was not possible to adjust for remaining differences between the groups.
Looking at primary diagnoses at elective admission, ICT patients appeared to be admitted electively less often than the matched control patients for certain conditions: the largest differences were in neoplasms and diseases of the circulatory system (Figure 4). This phenomenon cannot be explained by a difference in the number of patients with these underlying conditions before the study, as the proportion of patients with a history of cancer or cardiovascular disease were either similar or higher in ICT patients at baseline (see technical appendix, Table A1 and Figure A3). However, it could be just random variation.
Figure 4: Primary diagnosis at elective admission
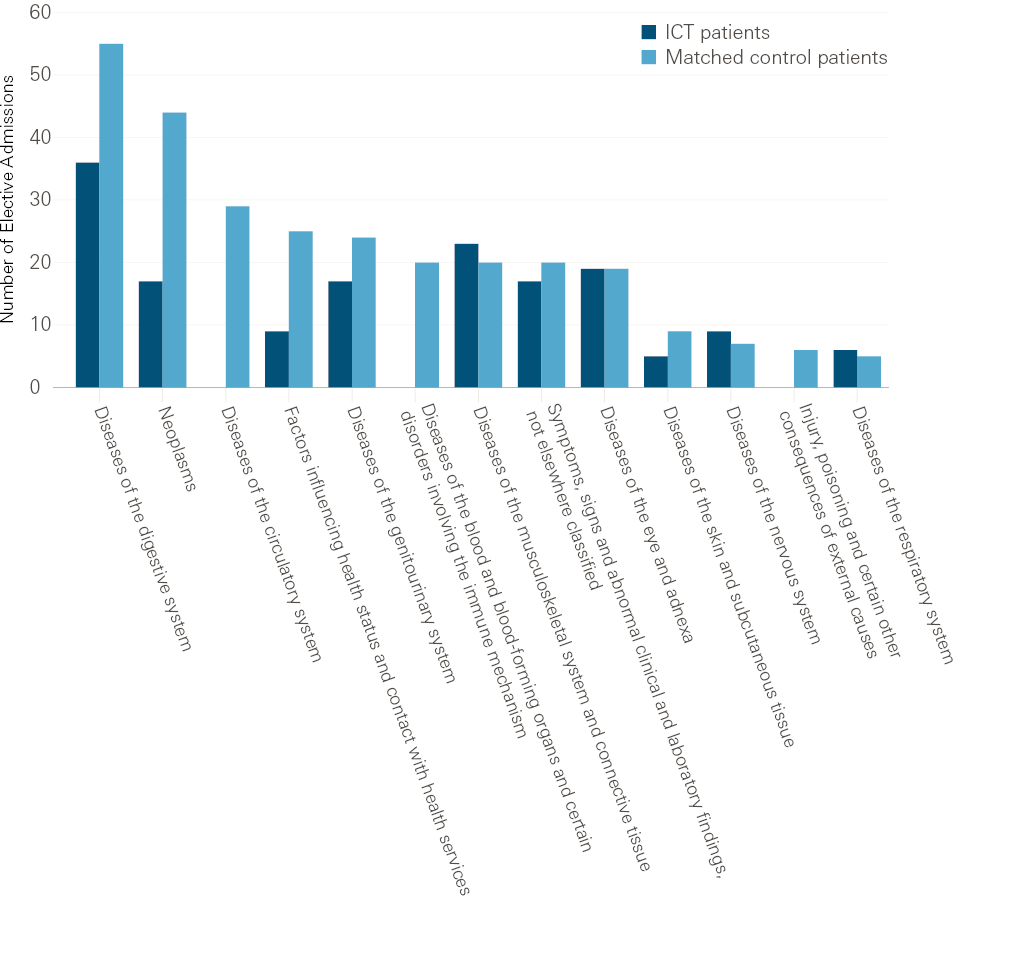
Note: This figure shows a breakdown of reasons for elective admissions by primary diagnosis International Classification of Diseases, 10th revision (ICD-10) chapters. Conditions for which less than five people were admitted are not shown.
There was no evidence that the frequency of outpatient attendances differed between groups (see Table 2). ICT patients had an average of 7.56 outpatient attendances per person per year, while the matched control patients had 7.58.
ICT patients might have been less likely to die in hospital than the control patients but the evidence was inconclusive
Of the patients who died, a smaller percentage of those in the ICT group died in hospital (50.3%) than matched control patients (58.2%). After adjustment, ICT patients were 46% less likely to die in hospital (95% confidence interval: 72% lower to 3% higher; p-value: 0.064). Although this finding might indicate that ICT patients were better supported in dying in their preferred place of death, the confidence interval shows this result was not conclusive, the likelihood of dying in hospital could have been up to 3% higher than amongst matched control patients (see technical appendix, Table A3 and Table A4).
There was no conclusive evidence of differences in emergency hospital use between localities
The number of patients referred to ICTs in each locality was small, rates were often unadjusted and confidence intervals wide. Therefore the results need to be interpreted with caution.
Although some estimated rate ratios were not statistically significant, all localities showed higher rates of A&E attendance and emergency admissions among ICT patients than the corresponding matched control patients (Table 3). There was no evidence that the rate ratios differed by locality. See the technical appendix for more details and the results of the analyses on other outcome measures.
Table 3: Comparison of rates of emergency hospital use between groups, by locality
|
Measure |
Locality |
Crude rate (number per person per year) |
Relative difference (adjusted rate ratio) |
|||
|
ICT patients |
Matched control patients |
Best estimate |
95% confidence interval |
p-value |
||
|
A&E attendances |
Aldershot |
2.28 |
1.40 |
40% higher |
6% to 84% higher |
0.016 |
|
Farnborough |
2.45 |
1.74 |
33% higher |
3% to 72% higher |
0.025 |
|
|
Farnham |
2.71 |
1.62 |
36% higher |
4% lower to 91% higher |
0.081 |
|
|
Fleet |
3.47 |
2.51 |
71% higher |
11% to 166% higher |
0.015 |
|
|
Yateley |
2.41 |
1.35 |
58% higher |
9% to 131% higher |
0.016 |
|
|
Emergency admissions |
Aldershot |
1.83 |
1.06 |
71% higher |
29% to 127% higher |
<0.001 |
|
Farnborough |
1.97 |
1.22 |
55% higher |
23% to 96% higher |
<0.001 |
|
|
Farnham |
1.97 |
1.27 |
24% higher |
14% lower to 77% higher |
0.243 |
|
|
Fleet |
2.59 |
1.85 |
37% higher |
10% lower to 110% higher |
0.132 |
|
|
Yateley |
1.85 |
1.09 |
73% higher |
13% to 168% higher |
0.013 |
|
Note: Outcomes were adjusted for some, but not all, observed baseline characteristics.
Among patients with a history of mental ill health, ICT patients had higher rates of emergency hospital use than the control patients
Of the 774 ICT patients, 429 (55%) had a history of mental ill health, compared with 366 (47%) patients in the control group. Among patients with a history of mental ill health, patients in the control group had, in general, similar characteristics to the ICT patients at the time of referral, although there were some remaining differences between the groups (see technical appendix, Table A12 and Figure A8).
ICT patients with a history of mental ill health experienced 2.98 A&E attendances per year on average, compared with 2.23 amongst matched controls. After adjustment for differences in their characteristics, we found that ICT patients with mental ill health had 28% more A&E attendances than matched controls (95% confidence interval: 6% higher to 53% higher; p-value: 0.008). We also found that ICT patients with mental ill health had more emergency admissions, longer average length of stay following emergency admission and more emergency bed days (Table 4) than the control patients. No other outcomes were significant. See the technical appendix for more details and the results of the analyses on other outcome measures.
Table 4: Comparison of the rate of hospital use in patients with a history of mental ill health
|
Measure |
Crude rate (number per person per year) |
Relative difference (adjusted rate ratio) |
p-value |
||
|
ICT patients |
Matched control patients |
Best estimate |
95% confidence interval |
||
|
A&E attendances |
2.98 |
2.23 |
28% higher |
6% to 53% higher |
0.008 |
|
Emergency admissions |
2.15 |
1.51 |
27% higher |
3% to 56% higher |
0.022 |
|
Average length of stay following emergency admission |
12.63 |
10.54 |
36% higher |
3% to 80% higher |
0.022 |
|
Emergency hospital bed days* |
11.50 |
7.90 |
61% higher |
16% to 124% higher |
0.003 |
Note: Only outcomes for which there were statistically significant results are presented. Outcomes were adjusted for some, but not all, observed baseline characteristics. *Emergency hospital bed days are presented as percentage of time in the study (in the crude rate columns).
Interpretation
As part of its commitment to learning and improvement, the vanguard partnered with the Improvement Analytics Unit to understand the impact of the ICTs on reducing hospital use among people referred to them between July 2015 and May 2017. The evaluation was conducted at an early stage of the implementation of the ICTs and aimed to provide insights that would inform the development and continuous improvement of the services provided by the vanguard.
We compared patients who were referred to the ICT between July 2015 and May 2017 with similar patients who were registered with a general practice in the North East Hampshire and Farnham area but were not referred to the ICT. We did this because we wanted to assess the additional impact of the ICTs over and above other services available to patients in NEHF, which includes Happy, Healthy, at Home vanguard services other than the ICT. The effect of ICTs might, however, have been different in the absence of other vanguard services.
The analysis addressed only the ICTs’ effect on hospital use; it does not tell us how ICTs achieved against their aims to improve patients’ health confidence and wellbeing or quality of life, or whether ICTs affected staff satisfaction or quality of care. For a more complete picture of the ICTs’ impact, this study should be viewed together with the results of local evaluations. For example, analyses carried out by Wessex Academic Health Science Network on the ICTs in Farnham and Yateley have shown promising results on patients’ reported health, health confidence, experience and wellbeing.,
One of the aims of the ICTs was to reduce A&E attendances and emergency admissions. We found that from July 2015 to June 2017, patients in North East Hampshire and Farnham who were referred to an ICT attended A&E 33% more often (95% confidence interval: 16-54% more often) equivalent to 0.54 more times per person per year (95% confidence interval: 0.26-0.89 more). They were admitted to hospital as an emergency 43% more often (95% confidence interval: 23-67% more often) than the matched control patients, equivalent to 0.53 more times (95% confidence interval: 0.28-0.82 more). Although there were differences in how the ICTs were implemented, all localities showed an increase in A&E attendances and emergency admissions (albeit not always statistically significant). There is no indication that the increase in emergency admissions during the study period is due to ICTs referring their patients to the ambulatory emergency care unit, as a smaller proportion of ICT patients’ emergency admissions were same-day admissions (18% versus 23%).
ICT patients were on average substantially older and with more long-term conditions than the overall population of NEHF. By selecting matched control patients with similar characteristics to the ICT patients and with access to the same hospital and vanguard services other than ICTs, we ensured that, as far as possible, we were comparing ‘like for like’ thereby increasing the likelihood that the differences in outcomes were due to ICTs rather than some other factor. While there were some slight differences between the two groups in characteristics such as age, prior hospital use and health conditions, we aimed to adjust statistically for these differences, meaning that they are very unlikely to explain the higher levels of emergency hospital use we found amongst the ICT group. Of greater concern is the possibility that the two groups differed in ways we could not observe, for example in their degree of family support, ability to manage their health conditions, the severity of these conditions and social isolation. Such differences might have arisen if clinicians selected patients for referral to the ICT on the basis of these kinds of characteristics. Since we could not adjust statistically for variables that were not recorded in our data, it was not possible to determine with certainty whether they could account for the higher rates of emergency care observed amongst the ICT patients than matched controls. However, while such differences may explain some of the higher rates, they are unlikely to account for all the difference, bearing in mind that some of the differences in hospital use were very large. Furthermore, it is very unlikely that any such differences could hide a decrease in hospital use. The findings therefore imply that the ICTs did not reduce A&E attendances and emergency admissions and may even have led to increases.
This greater hospital use by ICT patients in the emergency setting may seem counter-intuitive, but is consistent with findings of other studies of complex integrated care interventions.,,,, Interventions aiming to better manage at-risk patients, while valued by patients, can increase hospital activity by leading patients or health practitioners to identify unmet needs and providing more timely access to care.,, However, there are instances where interventions, after an initial increase in emergency hospital use, seem to have been able to reduce hospital activity over the course of several years.,, This demonstrates that, although early stage monitoring is key to learning and improvement, such interventions need time to be embedded and for any benefits to be seen.
There was an indication that the hospital use of patients referred to the ICT might reduce over time after referral, and might fall below that of the matched control patients for most measures after 12 months in the ICT. However, the number of patients in the study who received the ICT for more than 12 months was very small (eg 39 ICT patients and 87 control patients in quarter 6) and the results might well have been down to chance. Further research would be needed to establish whether the ICT began to reduce patients’ hospital use over time.
Patients referred to an ICT were admitted electively 24% less often than the matched control patients (95% confidence interval: 2–41% lower), equivalent to 0.15 fewer elective admissions per person per year than the matched control patients (95% confidence interval: 0.01-0.25 less). Although this difference was statistically significant, the difference could be as small as 0.01 fewer elective admissions and so the results may not have been significant if further adjustment had been possible. There are some differences in reasons for elective admissions between the groups, with ICT patients having fewer elective admissions for cancer, for example. This was consistent with the results of another study of integrated care. It may be that ICTs reassessing a person’s care needs led to changes in patients’ elective care use. Another possible explanation is that some patients were referred to ICTs at a time when they and their doctors had decided to stop care with a curative intent, such as some cancer treatment, and instead needed more palliative support.
The analysis showed that referral to an ICT might have reduced the chance of a patient dying in hospital rather than in other places such as their own home. Our best estimate is that ICT patients who died were 46% less likely to die in hospital than matched control patients who died, though the confidence interval was wide (72% lower to 3% higher). While not conclusive, it is possible that patients referred to an ICT who are nearing end of life were better supported in their preferred place of death than the matched control patients.
Assuming the differences in emergency outcomes are not solely due to different characteristics between the groups, a question is: what is driving these differences? There are several potential mechanisms:
• ICTs are identifying urgent health care needs earlier than in the matched control group
• ICTs are identifying urgent needs that might otherwise have gone unmet
• ICTs led to patients being more aware of their health needs, which in turn led to the patients attending A&E and being admitted.
It is not possible to determine from this analysis which of these or other mechanism(s) we may be seeing. A qualitative evaluation would be needed to explore these.
Implications and priorities for future work
Our analysis indicates that the ICTs did not reduce emergency admissions and A&E attendances in their first 23 months of operation and might have even led to increases. It may be that the increased rates of emergency care reflect a positive effect on the health and wellbeing of patients by identifying unmet need. However, further analysis is needed regarding the impact of the ICTs on the coordination of care and patient experience, or indeed on health, health confidence or quality of life, since we could not examine these aspects within the constraints of NHS data sets.
Below, we set out our reflections on the results of the evaluation. Some of these points might be useful for NHS teams to consider when exploring the introduction of integrated care teams or improvements to their ways of working.
Which patient groups should the ICTs target?
During our study period, GPs and health care workers in North East Hampshire and Farnham were asked to identify patients whom they felt were most vulnerable and would most benefit from additional support from the ICTs. Patients referred to ICTs were aged 81 years on average and 19% of patients died during the study. Although such high-risk patients may benefit from the additional support from the ICTs, there may be limited scope to reduce their hospital use, given their clinical history. There’s therefore a question about whether reduction in emergency hospital use is an appropriate objective for ICTs or whether ICTs should be targeting a different patient group.
Interestingly, the vanguard is working on developing criteria for selecting patients for ICT referral, including the use of a risk stratification tool. These algorithms are often better at identifying high-risk patients than clinicians, but may not identify those likely to benefit from additional care or do so before they deteriorate. Practitioners may be more able than algorithms to identify patients who are willing and able to interact with ICTs. Since March 2017, Farnham has been combining risk stratification and clinical judgement to proactively identify patients for referral. This may be the best way forward, as it combines the objectivity and reliability of the models with the insights of practitioners.,,
The question remains whether changes to the way patients are selected alone will achieve the desired effect of reducing emergency hospital use. To achieve this aim, not only must people at risk be accurately identified before they go into crisis, they also must have genuinely preventable admissions and then be offered an intervention that is effective at reducing their risk. For the impact to be felt at population level, the percentage of the population covered would need to be of sufficient scale to deliver this impact.
The value of ICTs
This and other research shows that it may be difficult for ICTs to reduce emergency hospital use. Instead, their value may lie elsewhere, for example in improving the coordination of care, reducing fragmentation, and improving patients’ health and experience when using the NHS. In this case, it will be important to establish data collections that can monitor these aspects of care to help teams show impact, as well as to be realistic about what can be achieved in relation to reducing emergency admissions.
There are also some suggestions from our analyses that different groups of patients referred to ICTs may use hospital care in different ways, which could be explored further. For example:
• those with unmet health care needs may have these swiftly identified and acted on by ICTs
• those nearing end of life may benefit from ICT care that supports them in dying at home.
However, a qualitative study would be needed to explore this further. Such information could help inform the CCG when considering changes to the service.
Ongoing assessment of impact
In this report, we have evaluated the impact of ICTs in their early phases of implementation in North East Hampshire and Farnham, and proposed possible mechanisms which could explain the results, for example that ICTs are identifying unmet need. However, there is still a need to monitor the ongoing impacts of the ICTs, especially since the ICTs have continued to evolve, and have already been adapted in response to learning. This is why it is so positive that the CCG has shown commitment to producing evidence to better understand the Happy, Healthy, at Home vanguard interventions and the ICTs, both in its own regular monitoring and through its collaborations with the Improvement Analytics Unit and the local evaluator.
In its continued work, it might be helpful to expand monitoring of the ICTs to examine the characteristics of ICT patients. This could assess whether a change in selection methods affects which patients are selected, as well as monitoring outcomes. Further in-depth analyses using a matched control group could be conducted to evaluate whether ICTs reduce hospital use in the longer term and assess the effect new selection criteria might have on hospital use.
Also, to fully understand what contributions the ICTs are making, robust quantitative analyses are needed on metrics other than hospital use, for example health confidence, patient experience and quality of life. Unfortunately, this information is not collected routinely at patient level in the NHS. However, the value of integrated care might relate to improving these other metrics rather than emergency hospital admissions. Qualitative evaluation would be helpful to explore potential mechanisms and provide more definitive answers.
A recurrent message from the Health Foundation’s improvement work is that, to improve the quality of care, repeated measurement is necessary to allow timely modification of initiatives, and inform their more effective evolution. Over the coming years, the Improvement Analytics Unit will analyse more local initiatives, feeding back analysis quickly to inform ongoing decision making and practice. To find out more, visit www.health.org.uk/IAU
References
- Ferris TG, Weil E, Meyer GS, Neagle M, Heffernan JL, Torchiana DF. Cost savings from managing high-risk patients. The Healthcare Imperative: Lowering Costs and Improving Outcomes: Workshop Series Summary. The National Academies Press. 2010. pages 301–10. www.nap.edu/catalog/12750.html
- Roland M, Lewis R, Steventon A, Abel G, Adams J, Bardsley M, et al. Case management for at-risk elderly patients in the English integrated care pilots: observational study of staff and patient experience and secondary care utilisation. International Journal of Integrated Care. 2012;12:e130.
- Imison C, Curry N, Holder H, Castel-Clarke S, Nimmons D, Appleby J, et al. Shifting the Balance of Care. The Nuffield Trust. 2017.
- Bardsley M, Steventon A, Smith J, Dixon J. Evaluating integrated and community-based care: how do we know what works? The Nuffield Trust. 2013. www.nuffieldtrust.org.uk/research/evaluating-integrated-and-community-based-care-how-do-we-know-what-works
- Shaw S, Rosen R, Rumbold B. What is integrated care? The Nuffield Trust. 2011. www.nuffieldtrust.org.uk/files/2017-01/what-is-integrated-care-report-web-final.pdf
- Department of Health. Supporting people with long term conditions. 2005. http://webarchive.nationalarchives.gov.uk/20130105013243/www.dh.gov.uk/prod_consum_dh/groups/dh_digitalassets/@dh/@en/documents/digitalasset/dh_4122574.pdf
- Curry N, Ham C. Clinical and service integration: The route to improved outcomes. The King’s Fund. 2010. www.kingsfund.org.uk/publications/clinical_and_service.html
- North East Hampshire and Farnham CCG. New Ways of Working – Happy, Healthy, at Home. 2015. www.northeasthampshireandfarnhamccg.nhs.uk/about-the-ccg/happy-healthy-at-home
- North East Hampshire and Farnham CCG. Vanguard key messages. North East Hampshire and Farnham CCG. 2015. www.northeasthampshireandfarnhamccg.nhs.uk/documents/north-east-hampshire-and-farnham-vanguard/communications
- Lloyd T, Steventon A. Statistical Analysis Protocol for an evaluation of integrated care teams as part of a primary and acute care system (PACS) in North East Hampshire and Farnham. The Health Foundation. 2017. www.health.org.uk/publication/impact-integrated-care-teams-hospital-use-north-east-hampshire-and-farnham
- Wessex Academic Health Science Network. Enhanced Recovery and Support at Home Service. 2018. http://wessexahsn.org.uk/img/projects/Enhanced Recovery and Support at Home Service Flashcard.pdf
- North East Hampshire and Farnham CCG. Farnham Community Paramedic Home Visiting Service. North East Hampshire and Farnham CCG; available on request.
- Wessex Academic Health Science Network. Independent evaluation of the North East Hampshire and Farnham Vanguard. Referral Management Service. 2017. www.northeasthampshireandfarnhamccg.nhs.uk/documents/north-east-hampshire-and-farnham-vanguard/evaluation
- Griffiths A, Gale K. Aldershot Safe Haven Service. Wessex Academic Health Science Network; 2017. www.northeasthampshireandfarnhamccg.nhs.uk/documents/north-east-hampshire-and-farnham-vanguard/evaluation
- Happy, Healthy at Home vanguard. Integrated care team logic model. Available upon request.
- Wessex Academic Health Science Network. Farnham Integrated Care Team. 2017. www.northeasthampshireandfarnhamccg.nhs.uk/documents/north-east-hampshire-and-farnham-vanguard/evaluation
- Wessex Academic Health Science Network. Yateley Integrated Care Team. 2017. www.northeasthampshireandfarnhamccg.nhs.uk/documents/north-east-hampshire-and-farnham-vanguard/evaluation
- Lloyd T, Brine R, Pearson R, Caunt M, Steventon A. Technical appendix: the impact of integrated care team on hospital use in North East Hampshire and Farnham. 2018. www.health.org.uk/publication/impact-integrated-care-teams-hospital-use-north-east-hampshire-and-farnham
- Steventon A, Grieve R and Sekhon J.S. A comparison of alternative strategies for choosing control populations in observational studies. Health Services and Outcomes Research Methodology. 2015. doi:10.1007/s10742-014-0135-8
- Diamond A, Sekhon JS. Genetic Matching for Estimating Causal Effects: A General Multivariate Matching Method for Achieving Balance in Observational Studies. Review of Economics and Statistics. 2013.
- Ho DE, Imai K, King G, Stuart EA. Matching as Nonparametric Preprocessing for Reducing Model Dependence in Parametric Causal Inference. Political Anlysis. 2007;15:199–236.
- NHS England. CCG improvement and assessment framework 2016/17: Technical annex 2017. www.england.nhs.uk/commissioning/ccg-assess
- Davies A, Ariti C, Georghiou T, Bardsley M. Evaluation of complex health and care interventions using retrospective matched control methods. The Nuffield Trust. 2015. www.nuffieldtrust.org.uk/files/2017-01/evaluation-health-care-interventions-web-final.pdf
- Shaw S, Levenson R. Towards integrated care in Trafford. The Nuffield Trust. 2011.
- Steventon A, Billings J. Preventing hospital readmissions: the importance of considering “impactibility”, not just predicted risk. BMJ Quality & Safety 2017. http://qualitysafety.bmj.com/lookup/doi/10.1136/bmjqs-2017-006629
- Lewis G. Next Steps for Risk Stratification in the NHS. NHS England. 2015.www.england.nhs.uk/wp-content/uploads/2015/01/nxt-steps-risk-strat-glewis.pdf
- Freund T, Mahler C, Erler A, Gensichen J, Ose D, Szecsenyi J, et al. Identification of patients likely to benefit from care management programs. American Journal of Managed Care. 2011;17(5):345–52.
- Roland M, Abel G. Reducing emergency admissions: are we on the right track?BMJ. 2012;345(18,1):e6017–e6017.
Acknowledgements
We would like to acknowledge the contribution of the following people: Creina Lilburne, Emma Vestesson, Arne Wolters.
The Improvement Analytics Unit reports to an Oversight Group and has an Information Governance Advisory Group. We are grateful to members of these groups for their support and advice, as well as Joe Sladen from Wessex Academic Health Science Network for his support. We are grateful to Philippa Moran from North East Hampshire & Farnham CCG and Sarah Harraway from Happy, Healthy, at Home for their continued support and for sharing their knowledge and expertise of the ICTs, local system and data throughout the evaluation.
Errors or omissions remain the responsibility of the authors alone.