Key points
- Continuity of care is an aspect of general practice valued by patients and GPs alike. However, it seems to be in decline in England. In the GP patient survey the proportion of patients who report being able to see their preferred GP fell from 42% in 2012 to 35% in 2016. This comes at a time when there is a need for better coordinated care, particularly because of the growing prevalence of long-term conditions and an increasing number of frail and older people.
- Our analysis, published in The BMJ and summarised in this briefing, looks at the link between continuity of care and hospital admissions for older patients in England. We looked specifically at admissions for ambulatory care sensitive conditions – those that could potentially be prevented through effective treatment in primary care.
- We found there to be fewer hospital admissions – both elective and emergency – for these conditions for patients who experience higher continuity of care (ie those who see the same GP a greater proportion of the time). Controlling for patient characteristics, we estimate that if patients saw their most frequently seen GP two more times out of every 10 consultations, this would be associated with a 6% decrease in admissions.
- To improve continuity for patients, general practices who are not already doing so could set prompts on their booking systems and encourage receptionists to book patients to their usual GP. Patients could also be encouraged to request their usual GP.
- Clinical commissioning groups and NHS England Area Teams could work with general practices to support quality improvement initiatives that maintain or improve continuity of care.
- One recent initiative, involving the introduction of named accountable GPs, seems not to have been successful in improving continuity of care. Future national initiatives should have a well developed understanding of how and why the policy will impact on continuity in a particular context.
Background and context
The image of a single general practitioner providing care to a patient throughout their life is a powerful one. Continuity of care (described in Box 1) aligns closely with the reasons many people chose to work in general practice, and 80% of general practitioners have stated that it is one of the most essential components of general practice. It is also important to patients – 51% have a GP that they prefer to see and studies show a link between continuity of care and patient satisfaction. However, there seems to have been a decline in continuity in recent years, with the proportion of patients who report being able to see their preferred GP falling from 42% in 2012 to 35% in 2016.
Box 1: What is continuity of care?
Continuity of care is a complex, multifaceted concept, with four domains:
- Interpersonal continuity: the subjective experience of the caring relationship between a patient and their health care professional.
- Longitudinal continuity: a history of interacting with the same health care professional across a series of discrete episodes.
- Informational continuity: the availability of clinical and psychosocial information across encounters and professionals.
- Management continuity: the effective collaboration of teams across care boundaries to provide seamless care.
In our study, we addressed longitudinal continuity of care, which we measured using the Usual Provider of Care (UPC) index. The UPC is defined as the proportion of a patient’s GP contacts that are with their most frequently seen GP.
This decline in continuity is coming at a time when there is a growing need for more coordinated care. Approaches to managing care for people with long-term conditions and the care of frail and older people tend to emphasise the need for care coordination and, increasingly, the importance of meaningful, personalised care and support planning. Indeed, patients who are older and have long-term conditions are more likely to have a preferred GP. Care coordination is a significant feature, for example, in several of the new care models outlined in the Five year forward view.
A number of reasons have been suggested for why continuity of care has been declining, including the following:
- The GP workforce is changing. More GPs are now working part-time, developing specialisms, or taking on other responsibilities. There are also an increasing number of locums and sessional GPs. These workforce changes may have contributed to declining continuity.
- Successive governments have implemented policies to improve the speed of access to primary care. Examples include offering a guaranteed GP appointment within 24 or 48 hours, establishing NHS walk-in centres, changes to out-of-hours care and introducing extended opening hours for GP practices. Reducing continuity of care is not an inevitable consequence of increasing access, but such interventions may have contributed to its fall.
- There has also been a growth in the size and scale of general practices, in response to a need to achieve efficiencies and offer extended services to patients. While there is some evidence that larger practices are better able to maintain good quality care,, there is also evidence that patients are concerned about losing the close relationship with their trusted GP and have a preference for smaller practices.
Continuity of care has been shown to correlate with certain outcomes, such as better adherence to medication, better control of blood sugar levels in the case of patients with diabetes, and reduced emergency department utilisation.,,, However, it has been unclear whether promoting continuity of care might help address the growing number of hospital admissions – an important aim for health policy.
While hospital admissions are often unavoidable, admissions for some conditions – known as ambulatory care sensitive conditions – could potentially be prevented through effective treatment in primary care. Between 2001/02 and 2012/13 emergency admissions to hospital for ambulatory care sensitive conditions increased by 48% (26% when adjusted for the increasing age of the population). And in 2009/10, one in six emergency admissions in England was for an ambulatory care sensitive condition, costing the NHS £1.42bn a year.
A practical way forward is needed for front-line clinical teams, commissioners, policymakers and academics to contribute towards improving this continuity of care. This briefing explains findings from a study completed by members of the Health Foundation’s data analytics team, published in The BMJ. The briefing suggests practical steps for GPs, commissioners and policy makers to improve continuity of care.
Our study and findings
In our study, we analysed linked primary and secondary care records from 200 GP practices in England. The practices were those that participated in the Clinical Practice Research Data Link, which is broadly representative of all GP practices in England. In this dataset:
- 33% (67/200) of practices were large (7 or more full-time equivalent GPs)
- 29% (58/200) of practices were medium (4–6 full-time equivalent GPs)
- 20% (40/200) of practices were small (3 or fewer full-time equivalent GPs)
- 18% (35/200) of practices did not report the number of GPs.
We examined records for 230,472 patients who were aged between 62 and 82 and had at least two contacts with a GP between April 2011 and March 2013 (see Table 1 for details of the patients studied). We used data we had already used to evaluate the impact of a national policy aimed at improving the continuity of care for patients in this age group; hence our restricted age range. For each patient, we calculated the number of hospital admissions that occurred between those dates, and measured continuity of care with their usual GP over the same period.
We focused on hospital admissions – both elective and emergency – for ambulatory care sensitive conditions, which are considered to be manageable in primary care a lot of the time. They include certain long-term conditions, such as asthma, where good quality care, combined with self-management, should prevent flare-ups that need hospital treatment. They also include acute conditions where timely and effective primary care stops the condition developing and avoids patients needing hospital treatment (eg urinary tract infections), and conditions that are vaccine-preventable (eg influenza). While not all admissions for ambulatory care sensitive conditions could have been resolved in primary care, we decided to focus our research on patients with these type of conditions because, given the data available, this was the best way of estimating the impact of primary care on secondary care.
On average, each patient had 0.16 hospital admissions for ambulatory care sensitive conditions between April 2011 and March 2013. There were no admissions for 88% of patients, while 9% had a single admission and 3% had several.
Table 1: Characteristics of the patients studied
|
|
All patients |
|
Average age in years |
71 |
|
Socioeconomic deprivation (number of patients (% of patients)) |
|
|
60,659 (26.3%) 58,515 (25.4%) 47,464 (20.6%) 38,389 (16.7%) 25,445 (11.0%) |
|
Number of long-term conditions per patient (number of patients (% of patients)) |
|
|
84,374 (36.6%) 77,111 (33.4%) 69,083 (30.0%) |
|
Number of GP contacts per patient (mean) |
11.4 |
|
Number of admissions for ambulatory care sensitive conditions per patient (mean) |
0.16 |
Trends in continuity of care
We measured continuity of care using the Usual Provider of Care index (or UPC). This is a simple metric that looks at what proportion of a patient’s contacts were with their most frequently seen GP. For example, if a patient had 10 GP contacts and six were with the same GP, then the UPC index would be 0.6. On average, each patient in our dataset had 11.4 GP contacts over the two-year period, with a UPC index of 0.61 (i.e. 61% of contacts were with the same GP).
Figure 1: Association between general practice size and continuity of care
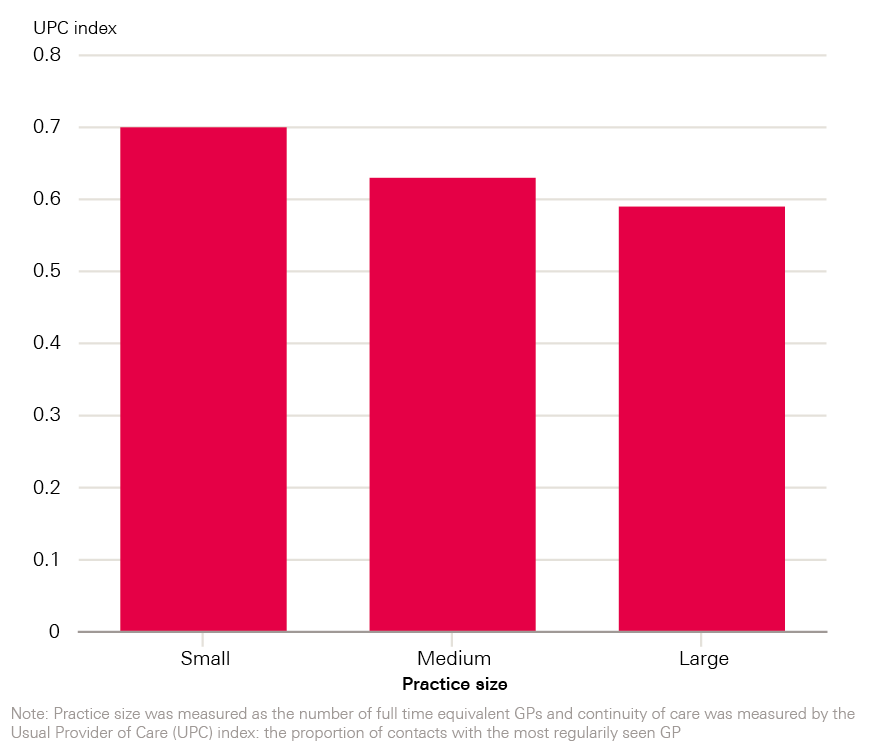
The continuity of care received by patients varied depending on the size of their GP practice, with patients in larger practices (where there were seven or more full-time equivalent GPs) being less likely to see their most frequently seen GP. In larger practices, the UPC was 0.59 compared with 0.70 for patients in smaller practices, where there were one to three full-time equivalent GPs.
The link between continuity of care and hospital admissions
We found that patients who experienced higher continuity of care in general practice tended to experience fewer hospital admissions for ambulatory care sensitive conditions.
This analysis took account of differences in the clinical and demographic characteristics of patients, including their age, gender, number of long-term conditions, and the number of GP contacts and referrals to specialist care over the period preceding our study. We also adjusted for the level of socio-economic deprivation of their local area.
Allowing for these factors, an increase in UPC of 0.2 for all patients was associated with a 6% decrease in hospital admissions for ambulatory care sensitive conditions. In other words, if these patients saw their most frequently seen GP two more times out of every 10 consultations, this would be associated with a 6% decrease in admissions.
Interpretation
Our findings suggest improvements in continuity in primary care might help offset mounting pressures on secondary care for older patients. This could happen for a number of reasons. For example, continuity of care might help GPs understand the needs and preferences of their patients. This could help them recommend suitable courses of treatment that are acceptable to the patient, or detect and prevent acute health events. Continuity may also help develop mutual trust between GPs and patients and thus decrease the likelihood that patients will choose to seek care elsewhere.
We noticed that there was a stronger link between continuity of care and hospital admissions for people at the older end of our sample than those who were younger. So, while it is difficult to extrapolate beyond our data, the trend suggests that a similar finding would be found for patients older than 82 years old.
However, it is important to bear in mind the limitations of the analysis. Our study focused exclusively on general practitioners, but other parts of the health system (such as community or mental health care) also have an impact on admissions for ambulatory care sensitive conditions. In addition, in a study such as this, we could not establish causality. It is possible that during an acute episode there is a simultaneous increase in the number of hospital admissions (due to the additional health need) and a decline in care continuity (due to a need for rapid access to general practice). Such a scenario could be an alternative explanation for our findings. Further studies are needed that address specific interventions which aim to improve continuity, and evaluate any impact on hospital admissions. These studies could also address aspects of continuity not considered in our study (see Box 1), such as the subjective experience of a caring relationship between GP and patient, or the benefits of informational and management continuity within the general practice and across primary and secondary care.
Further investigation is also needed to examine whether the trend towards larger practices has implications for the continuity of care provided. In our study, large practices typically provided lower continuity of care, with an average UPC index of 0.59, compared with 0.63 for the medium-sized practices and 0.70 in the small practices.
While these findings suggest that there is room to improve continuity in larger practices these findings might also reflect shortcomings of the UPC index. For example, patients in larger practices may be deliberately managed by several GPs, or indeed nurses and other health care workers, working in a small team. These arrangements might confer many of the benefits associated with continuity of care (for example, by improving informational and management continuity), but we could not assess them due to limited data.
Putting the findings into practice
Our study suggests that improving the continuity of care for patients may help reduce hospital admissions for ambulatory care sensitive conditions. There are a number of ways that continuity of care could be improved. Here we make specific recommendations for general practices, commissioners and policymakers.
General practices
Maintaining continuity of care for patients is recognised by GPs as an essential component of general practice. The Royal College of General Practitioners (RCGP) has developed a toolkit to support practices in this area, using existing data from the electronic record.
Whatever level of continuity of care a GP practice currently offers, improving continuity further may help reduce hospital admissions. The most gains are likely to be made by practices whose patients are currently experiencing low or lower continuity.
Although approaches will require careful evaluation, several ideas have been suggested for how practices could review and improve some of their internal processes to provide more continuity of care. These include the following:
- Receptionists and practice booking systems are central to promoting continuity; prompts as part of the booking process could encourage appointments to be made with a patient’s usual GP.
- Large practices could consider organising themselves into small teams to care for a subset of the patients registered at the practice, meaning that patients receive continuous care at team rather than individual level.
- Practices and commissioners could work together to identify specific patients who are experiencing low continuity of care and then ensure appointments are offered with the usual GP as a default.
- Patients could be encouraged to request their usual GP, and have the possible benefits explained through posters, leaflets and during consultations.
In order to track progress, GP practices could measure their continuity regularly using existing data, for example using the UPC metric (though other measures could also be used).
It is crucial to give GPs and whole practice teams – as well as patients – the skills and opportunities to identify where improvement is required and then implement and evaluate changes., In particular, GPs and practice teams may need support to analyse and use their own data to improve the quality of care. Making progress in quality improvement requires:
- the ability to diagnose problems by mapping processes and systems, and using data to highlight variation
- the ability to work as a team in the general practice to identify and test changes.
Solutions to improve continuity, developed and owned by the practices, allow practices to make changes only they can see are needed, as well as being key to improving the morale and confidence of practice teams.,
Commissioners
Commissioners could support GP practices who wish to improve and track progress against the continuity of care they offer to patients on an on-going basis. Changes to the structures of general practices in an area, such as increases in the size of a practice to allow more services to be offered, or changes to opening hours may also necessitate interventions to improve continuity. The RCGP toolkit can help with this. Commissioners could also support practices through analytic support and shared learning.
National policymakers
Any future national initiatives to promote continuity should have a well developed understanding of how and why the policy will impact continuity in a particular context. For example, our recent evaluation of the introduction of named accountable GPs for people aged 75 or over found that it had no impact on longitudinal continuity of care, at least as over the first nine months and as measured by the UPC index.
The recent focus of national policy relating to primary care has prioritised expanding access to general practice, particularly through the prime minister’s recent commitment to implement seven-day GP services by 2020. While access is an important aspect of quality, continuity of care must also be considered. Access and continuity are both likely to have a role to play in shifting demand away from secondary care., Policymakers should support GPs and commissioners to develop strategies that provide both prompt access to a GP and good continuity of care.
References
- BMA. National survey of GPs The future of General Practice 2015. 2015.
- Saultz JW, Lochner J. Interpersonal Continuity of Care and Care Outcomes: A Critical Review. Ann Fam Med 2005;3:159–66. doi:10.1370/afm.285.INTRODUCTION
- Royal College of General Practitioners. Continuity of care in the modern general practice. RCGP, 2016.
- Saultz JW. Interpersonal Continuity of Care and Patient Satisfaction : A Critical Review. Ann Fam Med 2004;:445–51. doi:10.1370/afm.91.INTRODUCTION
- Ipsos-MORI. GP Patient Survey – National Summary Report. Ipsos-MORI, 2016.
- Barker I, Steventon A, Deeny SR. Association between continuity of care in general practice and hospital admissions for ambulatory care sensitive conditions: cross sectional study of routinely collected, person level data. BMJ 2017. www.bmj.com/cgi/doi/10.1136/bmj.j84
- National Voices. A Narrative for person-centred coordinated care. National Voices, 2017.
- NHS England. Five year forward view. NHS England, 2014.
- Morse A. Improving patient access to general practice. National Audit Office, 2017.
- Department of Health. The NHS Plan: a plan for investment, a plan for reform. Department of Health, 2000.
- Monitor. Walk-in centre review: final report and recommendations. Monitor, 2014.
- Morse A. Out-of-hours GP services in England. National Audit Office, 2014.
- NHS England. Improving access to general practice: GP Access Fund. NHS England, 2016.
- Rosen R, Kumpunen S, Curry N, et al. Is bigger better? Lessons for large-scale general practice. Nuffield Trust, 2016.
- Campbell JL, Ramsay J, Green J. Practice size: Impact on consultation length, workload, and patient assessment of care. Br J Gen Pract 2001;51:644–50.
- Campbell SM, Hann M, Hacker J, et al. Identifying predictors of high quality care in English general practice: observational study. BMJ 2001;323:784–7. doi:10.1136/bmj.323.7316.784
- Baker R, Streatfield J. What type of general practice do patients prefer? Exploration of practice characteristics influencing patient satisfaction. Br J Gen Pract 1995;45:654–9.
- O’Connor P, Desai J, Rish W, et al. Is having a regular provider of diabetes care related to intensity of control? J Fam Pract 1998;47:290–7.
- Ionescu-Ittu R, McCusker J, Ciampi A, et al. Continuity of primary care and emergency department utilization among elderly people. CMAJ 2007;177:1362–8. doi:10.1503/cmaj.061615
- Bankart MJG, Baker R, Rashid A, et al. Characteristics of general practices associated with emergency admission rates to hospital: a cross-sectional study. Emerg Med J 2011;28:558–63. doi:10.1136/emj.2010.108548
- Freeman GK, Olesen F, Hjortdahl P. Continuity of care: An essential element of modern general practice? Fam Pract 2003;20:623–7. doi:10.1093/fampra/cmg601
- Blunt I. QualityWatch: Focus on preventable admissions. The Health Foundation and Nuffield Trust, 2013.
- Tian Y, Dixon A, Gao H. Data briefing – Emergency hospital admissions for ambulatory care-sensitive conditions: identifying the potential for reductions. The King’s Fund, 2012.
- Herrett E, Gallagher AM, Bhaskaran K, et al. Data Resource Profile: Clinical Practice Research Datalink (CPRD). Int J Epidemiol 2015;44:827–36. doi:10.1093/ije/dyv098
- Barker I, Lloyd T, Steventon A. Effect of a national requirement to introduce named accountable general practitioners for patients aged 75 or older in England: regression discontinuity analysis of general practice utilisation and continuity of care. BMJ Open 2016;:1–10. doi:10.1136/bmjopen-2016-011422
- Tammes, P. and Salisbury, C. Continuity of primary care matters and should be protected. BMJ 2017. www.bmj.com/cgi/doi/10.1136/bmj.j373
- Cochrane Handbook for Systematic Reviews of Interventions. Available via: http://handbook.cochrane.org/front_page.htm
- Salisbury C. The 3D Study Protocol: Improving whole person care. 6.0. NIHR Health Services and Delivery Research Programme 2016.
- Royal College of General Practitioners. RCGP Continuity of Care Toolkit. RCGP, 2012.
- Roland M. Continuity of care: betrayed values or misplaced nostalgia. Int J Integr Care 2012;12:e200.
- Royal College of General Practitioners. Quality improvement for General Practice: A guide for GPs and the whole practice team. RCGP, 2015.
- The Health Foundation. Quality improvement made simple: What everyone should know about health care. The Health Foundation, 2014.
- Bardsley M. Understanding analytical capability in health care. The Health Foundation, 2016.
- Whittaker W, Anselmi L, Kristensen SR, et al. Associations between Extending Access to Primary Care and Emergency Department Visits: A Difference-In-Differences Analysis. PLOS Med 2016;13:e1002113. doi:10.1371/journal.pmed.1002113