Acknowledgements
A number of people contributed to the development of this report through peer review and we would like to thank them for their comments and advice.
Errors or omissions remain the responsibility of the authors alone.
Executive summary: Trends in the NHS workforce
This is the third annual NHS workforce trends report published by the Health Foundation. Analysis of the NHS staff profile and trends in England in 2018 largely confirms the trends identified in our 2016 and 2017 reports, and shows an ongoing deterioration for some key staff groups. The key findings are:
- The NHS employs over a million staff. The past year has seen modest growth in the number of full-time equivalent (FTE) staff, with 18,567 more staff in July 2018 compared with a year before – an increase of 1.8%. But this is against a backdrop of more than 100,000 vacancies reported by trusts, a figure projected to only rise over the coming years.
- About half of the growth in NHS staff (9,376 FTE) is among professionally qualified clinical staff. But growth is patchy. The professionally qualified clinical staff with the highest rates of growth were ambulance staff, hospital and community health service doctors, and scientific, therapeutic and technical staff, all of which grew by around 3% or more. By contrast, the number of midwives increased by less than 1%, while the number of nurses and health visitors increased by less than 0.5%.
- While there has been continued growth in the number of hospital-based doctors, the number of GPs has fallen. The staffing model for primary care is changing. The FTE number of GPs (excluding locums and trainees) has fallen by 1.6% in the year to September 2018. The mix of staff working in general practice is changing – over the past year, the number of nurses and other direct patient care staff working in general practice has been expanding. There has been a small but notable increase in the number of general-practice-based pharmacists and advanced practice nurses.
- Despite substantial rises in activity pressures, the FTE number of registered nurses and health visitors employed in the NHS in England grew by just under 0.5% (1,300 FTE) between July 2017 and July 2018. Although there has been very modest overall registered staff growth, underlying shortages are evident in the high vacancy rates across the NHS. There are more than 41,000 registered nursing posts reported vacant in the NHS in England – more than 1 in 10 posts.
- Moving care from hospitals into primary and community health services has long been a policy goal and The NHS Long Term Plan continues to reflect this ambition. However, turning it into a reality on the front line remains elusive. Although the overall number of nurses employed in the NHS has increased slightly, there are particular problems in key priority areas such as primary care and learning disabilities. The number of nurses and health visitors working in community health services has continued its long-term decline, falling 1.2% (538 FTE), driven by a fall in the number of health visitors negating a small rise in the number of other nurses working in community services. The numbers in mental health nursing – another priority area – increased by less than 0.5% (172 FTE) over the year to July 2018.
- To address nursing shortages, the government has committed to increasing the number of nurses in training. However, 2018 was the second year in a row in which the number of applications and acceptances for pre-registration nursing degrees in England fell. Our conclusion is that the change in funding arrangements in England, combined with a dip in the population of 18-year-olds, has resulted in a fall in the number of nursing students, rather than the expected rise. This problem is compounded by the ‘attrition’ rate – student nurses either not graduating in the expected timeframe or not at all. Our analysis finds that, across the UK, almost a quarter (24%) of those starting a nursing degree either didn’t graduate or failed to do so within the expected timeframe. There is no sign of sustained improvement in the attrition rate since 2008. Our survey in partnership with Nursing Standard found that the student attrition rate ranged from as much as 50% to as little as 5% across different universities, suggesting wide variation in completion rates.
- Another source of new staff is international recruitment. As The NHS Long Term Plan acknowledges, this will remain vital to achieving the overall staffing numbers needed, but it is currently being constrained by broader migration policies and by the uncertainties of Brexit. At present there is no coherent government approach to international recruitment in the NHS in England. A more strategic and 'joined-up' approach is required, involving government health departments, the Home Office, regulators and employers; one that is embedded in overall national health workforce planning.
- Although the new white paper on general migration policy (and The NHS Long Term Plan) may signal a move in this direction, it is not enough to address the urgent staff shortages in the NHS. In the short term, more staff should be added to the Shortage Occupation List, including allied health professionals (many of whom do not earn above the £30,000 salary floor) and certain medical specialties, while keeping nurses on the list (along with their salary exemption).
- Improving NHS staff retention is also a priority, but our analysis shows there has been no improvement in retention over the past year. This is worrying, as staff retention has worsened since 2011/12 and there is an urgent need to reduce the high rates of vacancies and staff turnover that we currently see. These issues are most stark in community trusts, where on average 1 in 5 staff left their role over the course of 2017/18. The analysis also finds significant regional variation. In 2017/18, the median staff stability index of trusts in the north-east region was 89% (that is, 89% of staff employed at the beginning of the year remained in their role at the end of the year), which made it the most ‘stable’ region that year. The least stable region was north-central and east London, which had a staff stability index of 81%.
- This report is being published at a critical moment. The NHS Long Term Plan recognises that the NHS workforce can be the enabler of its objectives. However, if the existing workforce shortages and deficits continue, they will severely hinder progress. In this report, we highlight that a lack of coherent policy that takes into account both funding and staffing has been a recurring theme, the effect of which has been to undermine any long-term consistency in the NHS’s approach to workforce policy and planning. We note with hope and expectation that The NHS Long Term Plan may be the catalyst for improvements in funding for the NHS workforce, and for improvements in workforce planning and policy functions. But beyond any specific policy meaures, the underlying faultlines in the overall approach to workforce policy and planning needs to be addressed. If the ‘national’ element in the overall workforce policy and planning system is to be truly national, and fully effective, it must:
- take account of the national labour market (not just NHS employment)
- align planning and policy across different occupations and sectors
- focus more on productivity and investment in the current workforce rather than on new roles (unless there is significantly more central support for scaling up)
- achieve a more efficient balance of skill mix
- enable local workforce planning to be conducted within a supportive overall framework
- recognise that national workforce policy and planning cannot be effective unless the relationship between staffing and funding is at the forefront of the approach.
* The list of occupations of which the UK has a shortage, and that are subject to less-stringent immigration rules.
Introduction and background
This report is the Health Foundation’s annual assessment of the profile and trends in NHS staffing in England. It is intended to be read as an annual update, examining changes in the overall profile of the NHS workforce, identifying key trends and focusing in detail on specific workforce ‘pressure points’. This is the third such annual report. Over time, we hope to provide a long-term picture of trends and changing profiles, while also taking a year-by-year focus on specific issues that warrant more attention.
In advance of the publication of The NHS Long Term Plan, we jointly published a briefing with The King’s Fund and Nuffield Trust, The Health Care Workforce in England: Make or Break?, highlighting the scale of the workforce challenge now facing the NHS, and the threat this poses to the delivery and quality of care over the next 10 years.
NHS trusts currently report a shortfall of more than 100,000 staff. The joint briefing reports that in the context of growing demand for health care – as the population grows, ages and has more chronic disease – the projected gap between the number of staff needed and that available will reach almost 250,000 by 2030. If staff shortages continue, this could lead to growing waiting lists, deteriorating quality of care and the risk that The NHS Long Term Plan will be undeliverable.
The NHS Long Term Plan, published in January 2019, sets out an ambitious programme of service-delivery expansion and change. It highlights the need to address workforce shortfalls, and states that a new workforce implementation plan will be published later in the year.
Against this backdrop of staff shortages and a commitment to a new national workforce plan, there are a number of other, related policy actions, and continued policy concerns, about the NHS workforce in England.
Since the publication of our last workforce report in 2017, Rising Pressure: The NHS Workforce Challenge, these have included:
- GP shortages: There has been no progress towards the government-set 2020 target to recruit 5,000 more GPs, with an acknowledgement by government ministers that the target date may be postponed., The most recent data suggest numbers of GPs are actually declining, and the latest National GP Worklife Survey reported that two out of every five GPs intend to quit in the next 5 years. This survey of 2,195 GPs in England found that 39% were likely to leave ‘direct patient care’ by 2022, compared with 19.4% in 2005. There has also been a reported doubling of the number of GPs taking early retirement since the beginning of the decade.
- Nursing shortages: There are high and growing levels of nursing vacancies. In October 2018, there were approximately 41,000 vacancies across the NHS nursing workforce in England. Nursing workforce shortages were the focus of a House of Commons Health and Social Care Select Committee report published in early 2018, which reported that ‘the nursing workforce is overstretched and struggling to cope with demand […] Major changes have recently been made to routes in to nursing. However, too little attention has been given to retaining the existing nursing workforce, and more nurses are now leaving their professional register than are joining it.’ The Committee noted that funding for continuing professional development had fallen from £205m in 2015 to just over £83m in 2017. In December 2018, it was reported that the Chief Executive of NHS Improvement anticipated that balance between the supply of, and demand for, NHS medical staff will be achieved in the next 5 years, but that there will continue to be shortfalls in NHS nursing staff .
- New policy responses to nurse shortages: One response has been to introduce new routes into nursing: nursing associates, nursing degree apprenticeships and the Nurse First scheme. It is too early for a full assessment of the effect of these initiatives but, according to the Chief Executive of Health Education England, there has been one unintended consequence – recruitment of workers into the nurse-associate scheme has triggered staff being recruited from social care. Another response to nurse shortages has been the nationally led, targeted effort to improve nurse retention. NHS Improvement claims it has had early success in a ‘direct support model’, where it is working with NHS trusts to address areas with high turnover.
- International recruitment: Uncertainty about the status of EU nationals after Brexit, changes to immigration policies, and the impact of changed language testing requirements for international nurses have led to a reduction in the inflow of health professionals from the EU and a shift in focus to the recruitment of non-EU nurses. This has not yet compensated for the drop in the number of nurses coming from the EU, with the total international intake of new nurse registrants in 2017/18 less than a third that of 2015/16.
- Uncharted territory for staff NHS pay: In early 2018, the 7-year public sector pay ‘freeze’, which had capped NHS staff pay rises and seen NHS staff earnings fall back relative to growth in other sectors, was ended. The Health Foundation noted at the time that this alone cannot solve the NHS's workforce problems – it must be part of a wider programme of engagement and support for nurses and other NHS workers.
- Lack of investment in ongoing training and development: There has been a continued lack of investment in continuing professional development (CPD) for NHS staff. The central investment in ongoing training and development for existing staff is now a third of its 2014/15 value, with £84m dedicated to workforce development in 2018/19. This is £2bn lower than it would have been had 2006/7 levels been maintained. This spending is part of Health Education England’s budget, and so no additional investment will be confirmed for future years until the 2019 Spending Review.
- Structural change: Health Education England has had the national and regional workforce planning remit since it was established in 2012. In October 2018, it was announced that Health Education England will now ‘work jointly with NHS Improvement’ at national level to develop its mandate for 2019/20, with the aim to ‘ensure that workforce plans are more closely aligned with NHS service plans.’ At the regional level, the reported aim is that Health Education England’s regional teams should ‘align’ with NHS Improvement/NHS England. The rationale for this is to ‘help ensure that our organisations work much more closely together to support local health systems to recruit, train, develop and retain the staff the NHS depends upon’.
As well as assessing the implications of the trends in NHS staffing, this report also focuses in more detail on a critical ‘pressure point’ – the retention and attrition of both student nurses and NHS staff. Improved NHS staff retention (that is, lower attrition and turnover rates) has understandably been identified as a main area for policy attention, as it offers the promise of faster and cheaper methods of reducing staff shortfalls than training or recruiting new staff.
In our last annual workforce trends report, we highlighted that the turnover of NHS staff was increasing, and that most NHS trusts were exhibiting reductions in workforce stability rates. These retention measures suggested that the problem of retaining staff was increasing, despite it being regarded as a policy priority. This year we look at this in more depth, and focus specifically on two main areas of retention and attrition:
- trends in the stability of the NHS trust workforce
- student nurse attrition.
This report concludes with a brief assessment of ‘where next’ in terms of health workforce policy and planning in England, in the context of ongoing NHS reforms.
The NHS workforce in England: Profile and trends
In our previous workforce report, Rising Pressure: The NHS Workforce Challenge, we reported that growth among professionally qualified clinical staff groups had slowed since 2014. We noted that the only contrary trend was among managers and senior managers, the numbers of which have been increasing since 2015 and outpacing the slow (or non-existent) growth in most of the other main staff groups. Rising Pressure also highlighted the sustained growth of the workforce in support roles in several areas. In this section, we highlight key trends in the NHS workforce in the period up to July 2018.
The NHS workforce profile
NHS workforce statistics for July 2018 cover NHS hospital and community health service staff groups in England. They show a total workforce of 1.2 million (head count) and an overall increase of 1.8% (18,567) in the full-time equivalent (FTE) workforce since July 2017.
A varied pattern of growth and stagnation lies beneath the headline data, with professionally qualified clinical staff growing at 1.7%, clinical support staff growing by 1.5%, and NHS infrastructure support staff growing by 2.5%.
As in the previous year, the largest percentage increase was among managers (6.0%, up by 1,292 FTE to 22,775 FTE). The number of managers and senior managers has now increased for 20 consecutive months. Among the professionally qualified clinical staff groups, the fastest growth has been among ambulance staff (3.8%). The growth rate for hospital and community health service doctors rose from 2.6% in 2016/17 to 2.9% in 2017/18, with a net increase of just over 3,140 FTE to 110,622 FTE in the year to July 2018. Much of this expansion is due to growth in the number of consultants (up by 1,436 FTE), but it is also down to an increase of 1,697 FTE in the number of doctors in core medical training (up by 20.6% to 9,941 FTE). In terms of absolute numbers, most of the increase is in general medicine (1,157 FTE), with the largest percentage increases in emergency medicine (358 FTE, or 5.7%). Psychiatry had the smallest percentage increase (49 FTE, or 0.6%), despite mental health being identified as a priority.
Over the past year, the FTE number of allied health professionals has grown by 2.3%, slower than the 3.0% rise in the previous year. In absolute terms, the largest increases have been in diagnostic radiography, occupational therapy and physiotherapy, with larger percentage increases in some of the smaller specialties, such as therapeutic radiography. By contrast, the number of support staff for allied health professionals has grown more slowly, at 1.3% (178 FTE), compared with 3.7% in the previous year.
Although the number of health care scientists increased by 1.7% to just over 24,000 FTE in July 2018, the total remains lower than its peak of 26,343 FTE in October 2010.
Table 1: Change in full-time equivalent (FTE) staff groups in the NHS in England, hospital and community health sevices (HCHS), July 2017 to July 2018
|
Staff group |
2017 |
2018 |
Change |
|
Professionally qualified clinical staff of which: |
562,937 |
572,313 |
9,376 (1.7%) |
|
Doctors |
107,482 |
110,622 |
3,140 (2.9%) |
|
Nurses and health visitors |
281,363 |
282,661 |
1,298 (0.5%) |
|
Midwives |
21,281 |
21,482 |
201 (0.9%) |
|
Ambulance staff |
19,919 |
20,676 |
757 (3.8%) |
|
Scientific, therapeutic and technical staff |
132,892 |
136,872 |
3,980 (3.0%) |
|
Support for clinical staff of which: |
314,514 |
319,209 |
4,695 (1.5%) |
|
Support to doctors, nurses and midwives |
243,472 |
246,060 |
2,588 (1.1%) |
|
Support to ambulance staff |
14,796 |
15,299 |
503 (3.4%) |
|
Support to scientific, therapeutic and technical staff |
56,246 |
57,849 |
1,603 (2.9%) |
|
NHS infrastructure support staff of which: |
165,252 |
169,348 |
4,096 (2.5%) |
|
Central functions |
80,948 |
83,427 |
2,479 (3.1%) |
|
Hotel, property and estates |
52,705 |
52,903 |
198 (0.4%) |
|
Senior managers |
10,116 |
10,243 |
127 (1.3%) |
|
Managers |
21,483 |
22,775 |
1,292 (6.0%) |
|
Other/unknown |
4,125 |
4,525 |
401 (9.7%) |
|
Total |
1,046,828 |
1,065,395 |
18,567 (1.8%) |
Source: NHS Digital, NHS Hospital and Community Health Service (HCHS) monthly workforce statistics – July 2018, provisional statistics (2018).
Nursing and midwifery numbers
Overview of NHS trends in registered nurses, midwives and health visitors
In the year to July 2018, the number of nurses and health visitors has scarcely changed – increasing by less than 0.5% to 282,661 FTE. There are now more than 41,000 qualified nursing and midwifery posts reported vacant in the NHS in England – more than 1 in 10. However, the overall picture of stagnation in the numbers masks some wide differences between areas of nursing (Figure 1). For example, while the FTE number of nurses and health visitors in children’s health grew by 2.2%, and in mental health grew by 0.5%, in community services it fell by 1.2%. This fall was driven by a decrease in the number of health visitors negating a small rise in the number of other nurses working in community services.
Figure 1: Change in nursing workforce by work area (HCHS), October 2014 to July 2018
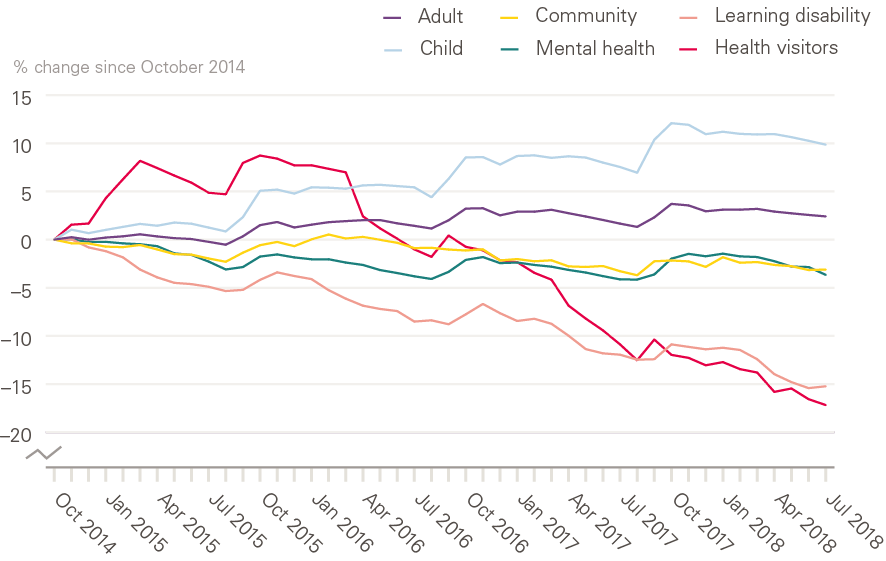
Source: NHS Digital. NHS Hospital and Community Health Service (HCHS) Monthly Workforce Statistics – July 2018, provisional statistics (2018).
Community nurses, school nurses, district nurses and health visitors
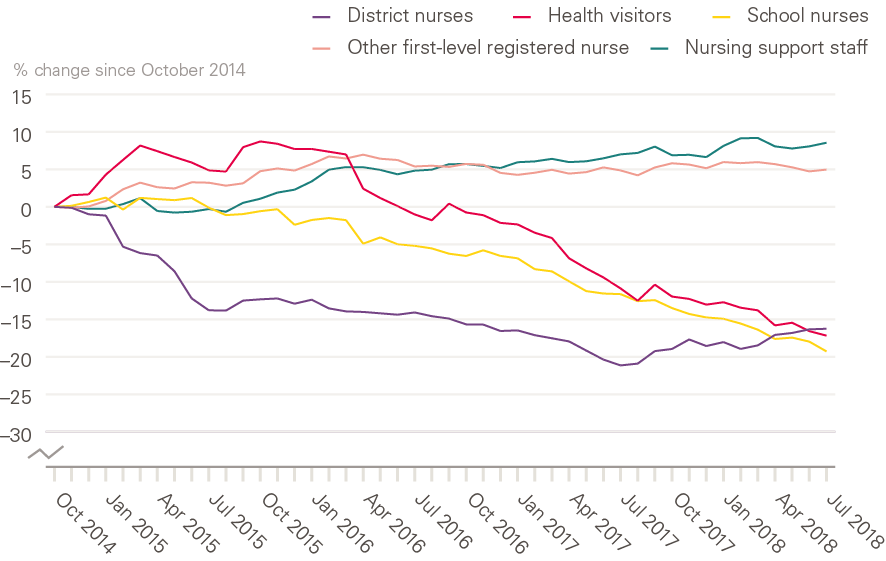
Shifting the balance of health care to the community has been a priority for successive governments. But as measured by the availability of nursing staff, there is little sign that this policy priority has been translated into practice. The number of district nurses has increased slightly over the past year (by 235 FTE to 3,850 FTE), while the number of health visitors has continued a long-term decline, falling 7% in the past year (by 597 FTE to 7,852 FTE). Over the same period, the number of other registered nurses working in community settings has remained static, at around 24,000 FTE, for the past 3 years (Figure 2).
Figure 2: Change in community nursing and health visiting, selected occupations (HCHS), October 2014 to July 2018
Source: NHS Digital. NHS Hospital and Community Health Service (HCHS) Monthly Workforce Statistics – July 2018, Provisional Statistics (2018).
Note: 'Other first-level registered nurses' are those that are not district nurses, health visitors and school nurses. 'Nursing support staff' includes nursing assistants/auxiliaries, nursing assistant practitioners and health care assistants.
Analysis published by the Queens Nursing Institute has highlighted that, after several years of growth, the number of people entering a district-nurse specialist-practitioner programme fell by 2.5% in the last academic year. There was also a 10% drop in the number of people qualifying from a district nurse specialist practitioner course in 2017, compared with 2016. Some of the decline in these areas may have been offset to some degree by staff moving into employment in the independent or private sector. However, recent analysis suggests caution in interpreting incomplete data sets, as there has been little recent growth in the number of nurses working for independent health care providers.
In Rising Pressure, we highlighted the slump in school nurse numbers. This decline has since accelerated. The number of school nurses fell by 8.7% (to 2,213 FTE), and the number of nursing support staff in this area also fell by 7.4% (400 FTE).
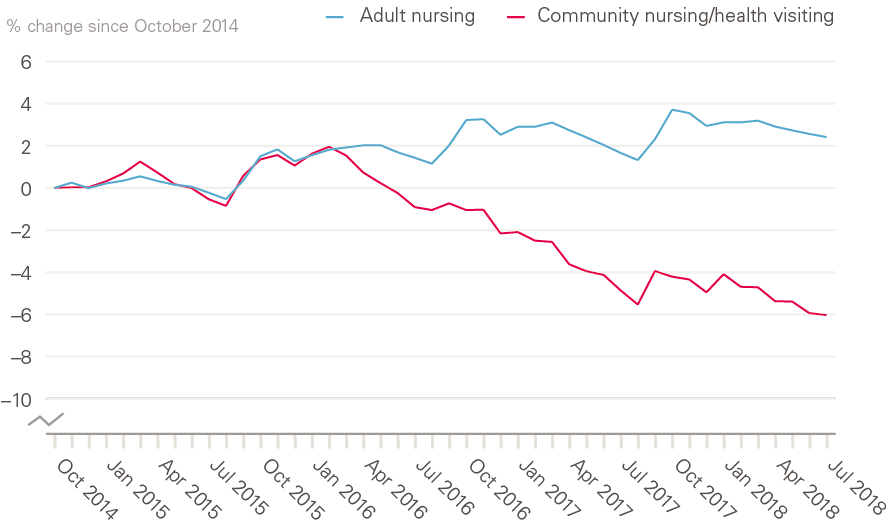
We also highlighted the contrasting trends between the hospital and community nursing workforces, with no evidence of sustained growth in community nursing numbers, despite this being the main policy focus for service delivery growth. One consequence of the trends reported above is that this staffing gap between acute and community sectors has grown even wider over the past year. The number of nurses working in adult hospital nursing grew by 0.7% to 178,582 FTE, compared with a 1.2% fall in community nursing (including health visitors) to 42,944 FTE (Figure 3).
Figure 3: Change in adult hospital nursing and community nursing/health visiting in the NHS in England (HCHS), October 2014 to July 2018
Source: NHS Digital. NHS Hospital and Community Health Service (HCHS) Monthly Workforce Statistics – July 2018, Provisional Statistics (2018).
Bank nurses
A further consequence of the limited growth in the nursing workforce is an increased reliance on 'bank' staff – that is, staff with no set contracted hours, and staff working flexible shifts. In part, this will have been driven by NHS Improvement requirements that NHS trusts reduce expenditure on agency staff, and switch to using bank nurses. There is some incomplete evidence suggesting that this switch has been made, but information published by NHS Improvement in December 2018 highlighted that the NHS had overspent on bank staff by £260m and on agency staff by £93m in the year to date. In June 2018, shifts worked by bank nurses and health visitors amounted to 10,158 FTE, an increase of 3.7% from June 2017 (Figure 4). This came at a cost increase of 11% on the previous year. These estimates should be regarded as a minimum because of data-collection issues.
Midwives
Over the year to July 2018, the number of midwives has increased by 0.9% (201 FTE), a higher rate of growth than in the previous year, with a total of 21,482 FTE midwives in employment at the end of June 2018.
Registered nurses in mental health
Mental health was identified as a priority in the Five Year Forward View, and also in The NHS Long Term Plan. Despite this, the number of mental health nurses has risen by less than 0.5% (171 FTE) over the past year (to 35,373 FTE). The number of nurses working in community mental health has risen by 4% (658 FTE) in the past year to just over 17,240 FTE. By contrast, the number of nurses working in other areas of mental health has fallen by 2.6% in the same period, to around 18,132 FTE.
Figure 4: Nurses and health visitors working as bank staff (full-time equivalent) in the NHS in England, HCHS, October 2015 to July 2018
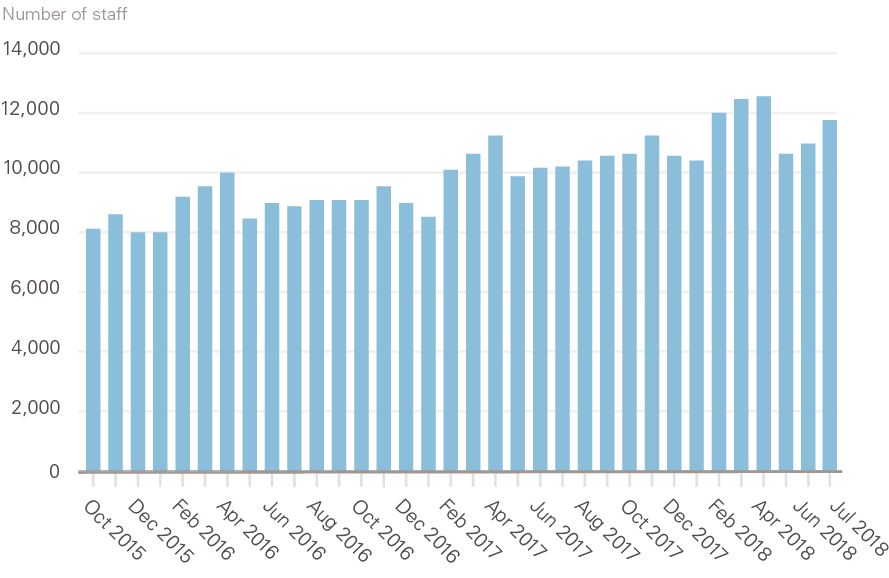
Source: NHS Digital. NHS Hospital and Community Health Service (HCHS) Monthly Workforce Statistics – July 2018, Provisional Statistics (2018).
Nursing support staff
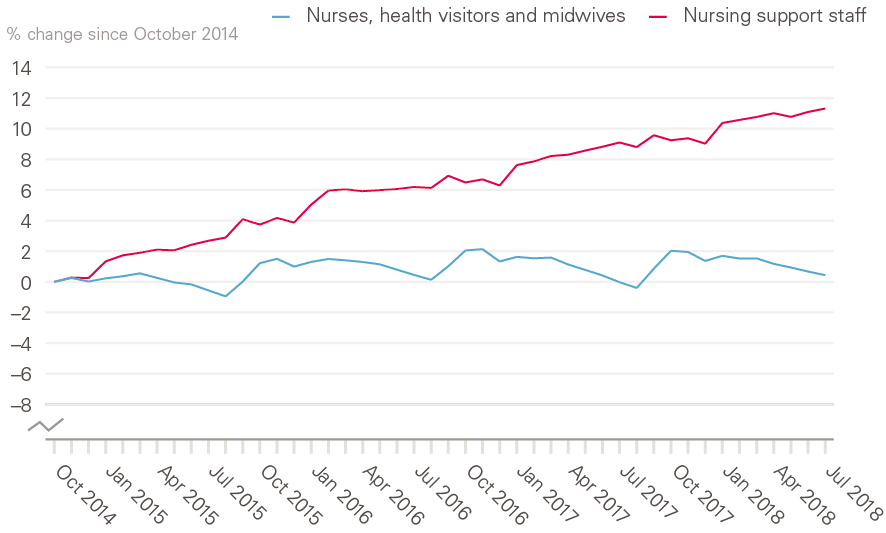
Nursing support staff include nursing assistants/auxiliaries, nursing assistant practitioners and health care assistants. Health care assistants are vocationally qualified, and assistant practitioners usually have a foundation degree. Nursing support staff serve as part of the broader nursing team in many care environments, but the ‘mix’ between registered nurses and these nursing support staff varies markedly in different specialties and localities. In contrast to the very slow growth in the number of NHS registered nurses described above (only 0.7% since October 2014), the number of nursing support staff has grown by around 11% over the same period (Figure 5). However, as with registered nurses, the trend varies between work areas.
Figure 5: Change in registered nurses, health visitors, midwives and nursing support staff (full-time equivalent) in the NHS in England (HCHS), October 2014 to July 2018
Source: NHS Digital. NHS Hospital and Community Health Service (HCHS) Monthly Workforce Statistics – July 2018, Provisional Statistics (2018).
The comparatively new role of nursing assistant practitioner has risen by 23.9% (1,045 FTE) in the past year, to 5,418 FTE (Figure 6). The annual increase in nursing assistant practitioner numbers (in absolute terms) is now approaching that of health care assistants. The latter increased by 1,300 FTE (2%) to 65,135 FTE over the past year.
Figure 6: Change in nursing support staff (full-time equivalent) in the NHS in England (HCHS), July 2017 to July 2018
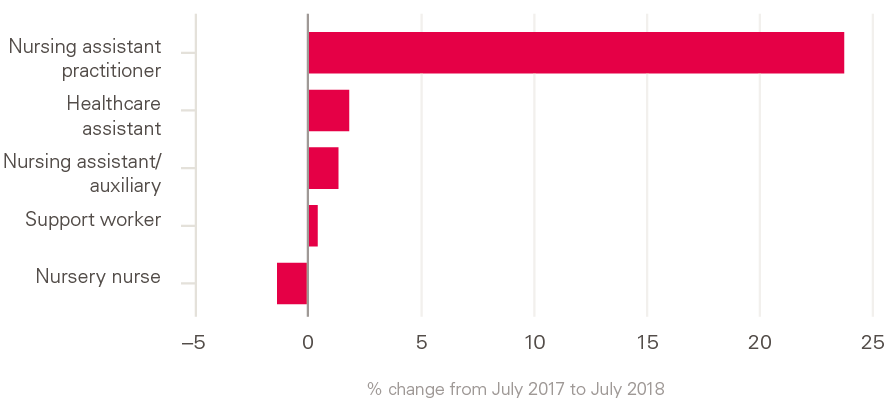
Source: NHS Digital. NHS Hospital and Community Health Service (HCHS) Monthly Workforce Statistics – July 2018, Provisional Statistics (2018).
In contrast to the growth in the relatively new categories of health care assistants and nursing assistant practitioners, the number of traditional on-the-job-trained nursing assistants and nursing auxiliaries had been falling in recent years – from more than 54,100 FTE in October 2010 to just 47,900 FTE in July 2018. However, this long-term trend has reversed, in the past year at least, with a 1.4% (650 FTE) increase in nursing assistants/auxiliaries in the past year.
It seems that, in the short term at least, the NHS is increasing staff numbers in all these categories of nursing support staff.
Again, these trends vary across work areas. In hospital acute, elderly and general care, the number of nursing support staff has increased by 33% (23,462 FTE) since July 2010, compared with just 2.3% (354 FTE) in community services. In the past year, in hospital acute, elderly and general care, the number of nursing support staff has increased by 3.5% (3,206 FTE), similar to the 3.6% growth in community mental health, although there are only 1,722 FTE nursing support staff in this work area. Growth in other community services has been more modest, at 1.5% (218 FTE). In all other work areas, support staff numbers have actually fallen: by 0.2% in maternity, 0.4% in paediatrics, 0.1% in hospital mental health and 8% in community learning disabilities.
Workforce nationality and international flows
Workforce nationality
The majority of NHS staff are UK nationals (Figure 7). Overall, around 82% of HCHS staff with a recorded nationality are UK nationals, and in most staff groups the proportion is more than 90%. However, among nurses and health visitors (78% UK nationals) and doctors (69% UK nationals) international migration plays a particularly significant role in helping to staff the NHS.
Nationality data have to be interpreted with caution because they are self-reported, and the nationalities given may represent people’s cultural heritage rather than country of birth, and they may also not reflect the country they trained in. Additionally, some 62,000 staff (6% of NHS staff in England) have not completed the nationality field in the staff record. The number of missing records has reduced over time, so some of the changes may reflect improved reporting.
Overall, about 5.5% (59,197 FTE) of the NHS workforce in England are nationals of other countries of the European Union (EU27) and the European Economic Area (EEA). The largest proportion, 20% (11,984 FTE), are from Ireland. Among nurses and health visitors (6.9%) and doctors (9.6%), EU27 nationals make up a more substantial share.
Figure 7: NHS health and community health service workforce by nationality

Source: NHS Digital. NHS Hospital and Community Health Service (HCHS) NHS Workforce Statistics – March 2018.
The most recent data show that, in 2017/18, the number of NHS staff coming from EU27 states has fallen, while the number of staff from EU27 states leaving the NHS has risen (Figure 8). As a result, the net inflow has reduced from just under 3,000 to about 900. However, among nurses and health visitors, the latest figures show a net outflow of 1,687 in 2017/18, compared with a net inflow of 635 in the previous year.
Figure 8: Flows of EU27 staff into and out of the NHS in England, HCHS, 2016/17 and 2017/18
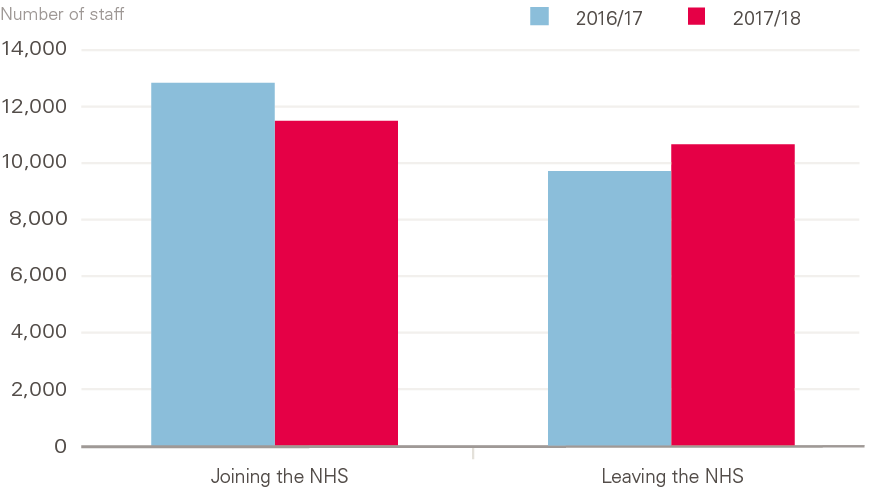
Source: NHS Digital. NHS Hospital and Community Health Service (HCHS) Monthly Workforce Statistics – June 2018, Provisional Statistics (2018).
The sense of an ‘exodus’ of EU nationals relates primarily to qualified nurses (down 8.5% since 2016) and midwives (down 3.1% since 2016). By contrast, the number of doctors from EU27 states is up by 5.5% since 2016 (to 10,228 FTE) and the number of scientific, therapeutic and technical staff from EU27 states has risen 24.8% since June 2016 (to 7,626 FTE) (Figure 9).
In addition to staff from EU27 countries, there are just under 76,500 FTE staff from non-EU and non-EEA states – 7.2% of the NHS workforce in England. Almost half of these are from two countries: India (18,076 FTE) and the Philippines (16,240 FTE). Staff from non-EU and non-EEA states are particularly significant for the medical and nursing workforces, where they account for 17.1% and 9.4%, respectively. The number of staff from these 'rest of the world' countries has risen by 12.1% (8,250 FTE) since June 2016.
Figure 9: Change in patient care staff (full-time equivalent) in the NHS in England from EU27 states, HCHS, June 2016 to June 2018
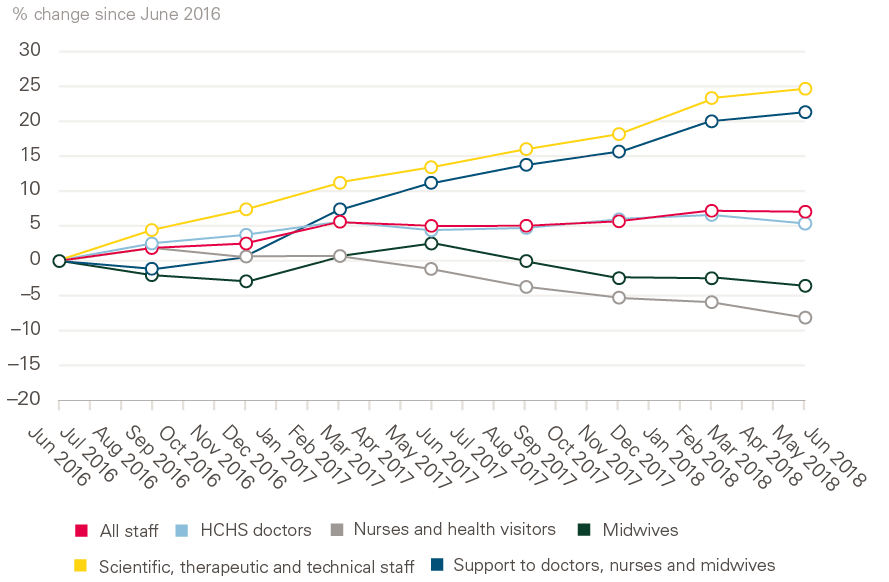
Source: NHS Digital. NHS Hospital and Community Health Service (HCHS) Monthly Workforce Statistics – June 2018, Provisional Statistics (2018).
International flows over time
The previous section focused on the current number of international health care professionals working in the NHS (as defined by their stated nationality). However, given the dynamic nature of international mobility, and the current issues around UK migration policy and Brexit, it is also important to examine long-term trends and patterns of mobility in order to provide a fuller backdrop.
Another source of data on international health professionals is registration data. This provides annual information of the number of new health professionals registering to practice, from home-based training sources and international inflows. Analysis of this data gives an indication of the relative dependency on international inflows and of the main source countries. This section uses nurse-registration data to highlight long-term trends and provide additional insights into the current situation.
There are almost 700,000 nurses and midwives on the UK professional register, the ‘pool’ from which all employers must recruit. More than 100,000 of those nurses were trained in another country – approximately 1 in 7 of the total pool of registered nurses. Many will have been first registered in the UK years or decades ago.
Using the annual registration data to take a long-term perspective (Figure 10), we see that every year at least 1 in every 10 new nurses entering the UK register comes from other countries. In most years, this number has been much higher. The long-term trend shows a growing reliance on international inflows, stimulated by active international recruitment, reaching a high of just over 50% in 2001/2, a rapid decline in subsequent years, then a second period of growing reliance in 2011–2016, followed by a second, recent period of decline.
Figure 10: Annual intake of new registrants to the UK nursing register, 1990–2018
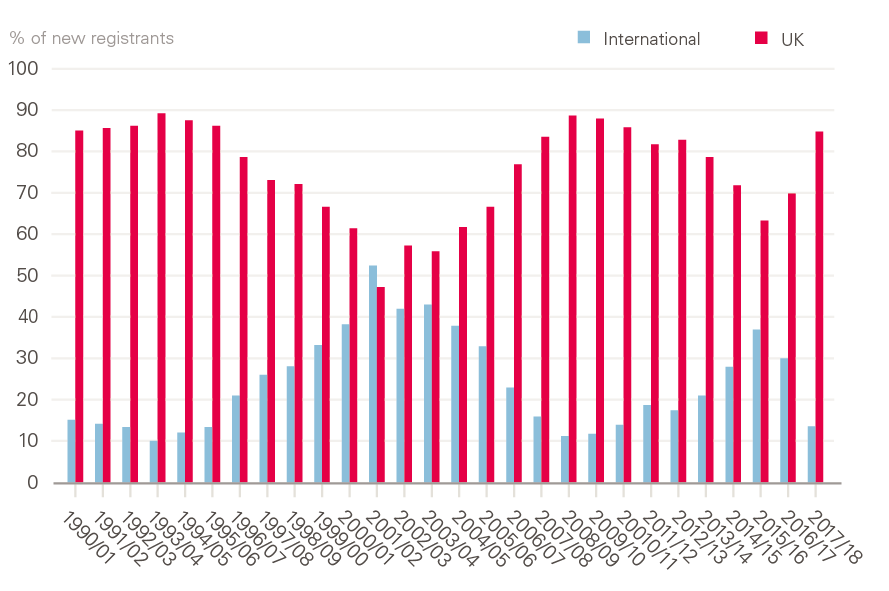
Source: Registration data from Nursing and Midwifery Council.
Figure 11 gives more detail on the annual number of nurses from the EU and other international sources registering in the UK since 1990. As noted above, the overall international inflow has ebbed and flowed across the period, rising notably at the beginning of last decade, when the NHS actively recruited thousands of nurses from India and the Philippines to expand the workforce. However, the more recent surge of international recruitment was from the EU countries of Portugal, Spain and Italy. In most recent years, non-EU inflow has increased, but not at a sufficient pace to compensate for the drop in EU nurses. The total international intake of new nurse registrants in 2017/18 was less than a third of that in 2015/16.
Figure 11: Annual intake of new EU and non-EU international registrants to the UK nursing register, 1990–2018
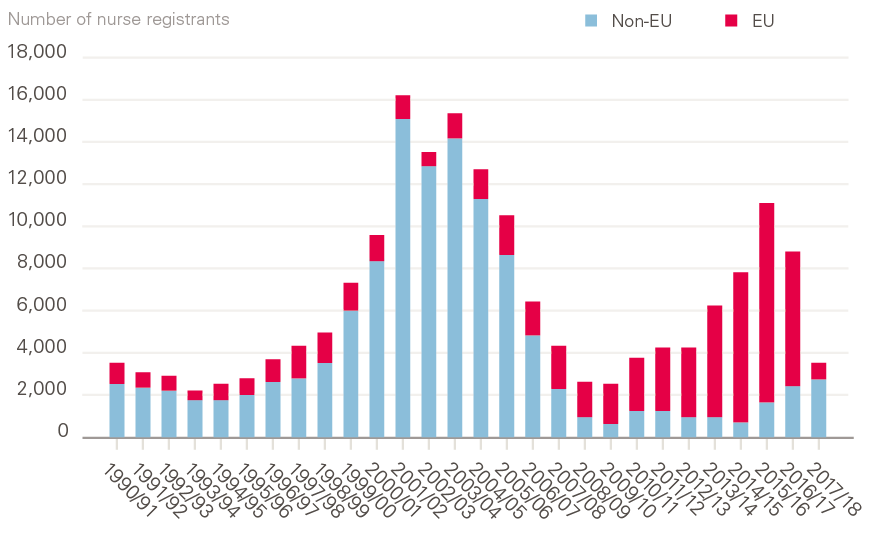
Source: NHS Registration data from Nursing and Midwifery Council.
The recent drop in overall international inflow of nurses does not reflect a lack of recruitment interest from UK employers. Rather, it is the result of three factors:
- A restrictive general immigration policy, which may have prevented non-EU nurses and doctors entering the UK to practise, and which has now been suspended after a campaign led by the British Medical Journal.
- Controversial changes in the requirements for English-language testing of nurses (now partially reversed).
- The Brexit vote in mid-2016, after which, as noted above, there was a net decline in the number of EU-based nurses registering to practice in the UK.
Ten years ago, the House of Commons Health and Social Care Select Committee report on NHS workforce planning concluded that there had been a ‘disastrous failure’ of planning, in part because of a ‘clear lack of alignment’ between domestic training and active international recruitment. This policy misalignment has continued, leading to significant short-term fluctuations in international recruitment, which has often been misaligned with domestic health-workforce and immigration policies.
The backdrop to both NHS-workforce and broader immigration policies is that the UK continues to be heavily reliant on international doctors, nurses and other health workers. Data published by the Office for Economic Co-operation and Development (OECD) show that 28% of UK-based doctors were trained internationally. This is in keeping with a group of high-income, English-speaking countries – Australia, Canada, Ireland, New Zealand and the USA – all of which are in the 24–41% range of dependence on internationally trained doctors. In short, when compared with other Anglophone OECD countries, the UK is not unusual in its reliance on international doctors. Where it does stand out is in the size of its recent inflow of doctors, notably from EU countries. This makes it vulnerable to Brexit-related volatility in health labour markets, while not having the recourse to easily ‘switch’ back to non-EU immigration pathways because of its current policies on immigration in general.
The general practice workforce
The number of GPs (excluding locums and trainees) has fallen by 1.6% from 27,836 FTE in September 2017 to 27,386 FTE in September 2018. This is moving ever further away from the government’s target of having 5,000 additional doctors working in general practice by 2020 than in 2014, as set out in General Practice Forward View.
In contrast to the trend among GPs, the number of nurses and other direct patient care staff working in general practice has continued to rise (Figure 12). The overall number of nurses grew by 1.5% (241 FTE) to 16,040 between September 2017 and September 2018. Most of this growth was in the number of advanced nurse practitioners (rise of 8% since September 2017 to 3,305 FTE), nurse specialists and extended-role practice nurses. Practice nurses remained the single-largest group (11,499 FTE) in September 2018, although their number was down by 3.5% on their peak in September 2015.
Figure 12: Nurses and other direct patient care staff (full-time equivalent) working in general practice, September 2015 to September 2018
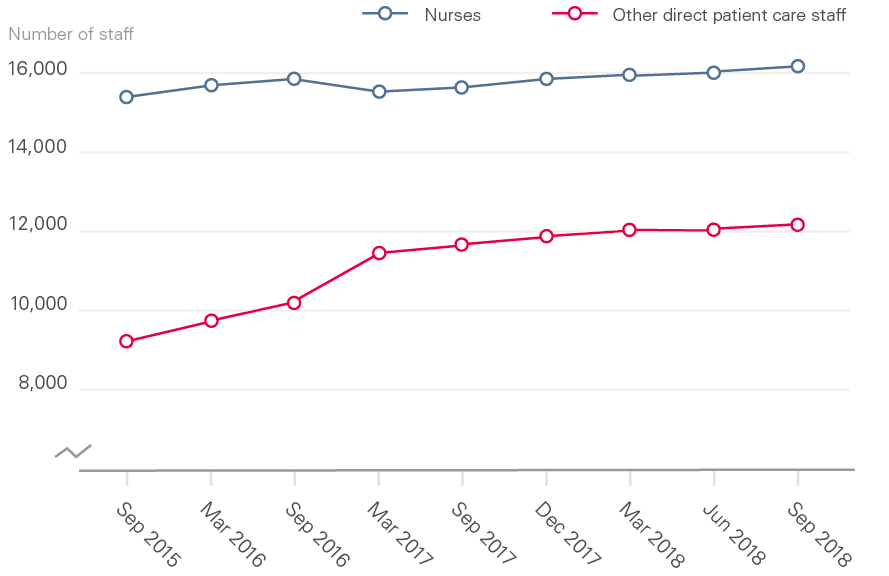
Source: NHS Digital. General and Personal Medical Services England, GP Tables September 2018, Provisional Experimental Statistics (2018).
Numbers of other direct patient care staff working in general practice (such as dispensers, pharmacists, phlebotomists and health care assistants) have also risen, by 5.5% to 12,246 FTE over the year to the end of September 2018. Most of these staff are health care assistants (6,726 FTE), dispensers (2,335 FTE), phlebotomists (706 FTE) and pharmacists (882 FTE). This last group has grown substantially since September 2015, when there were only 168 FTE staff. Paramedics are also growing rapidly in number, from just 61 FTE in September 2016 to 360 FTE in September 2018.
Figures on administrative and other non-clinical staff working in general practice show a rise of 2.7% to 65,309 FTE over the year to the end of September 2018.
Student nurse intakes
Applications to study nursing: 2017 – a year of change
Prior to 2017, applicants to nursing training and most allied-health subjects in England could apply for NHS bursaries. In 2017, the funding model changed. The NHS bursary was withdrawn and applicants were eligible for the same student loans as those applying to other undergraduate courses.
Between 2010 and 2016, the number of applicants to nursing courses in the UK ranged from 61,800 to 67,400 per year. In 2017, the first year under the new funding model, the number fell by 18% to 54,985. This was much larger than the 2.6% drop in applicants across all other undergraduate subjects. However, there is a difference between the number of applicants, and the actual number of ‘acceptances’ – applicants who are actually accepted onto a course. The fall in applicants did not lead to an equivalent fall in acceptances. Although the number of acceptances fell, to 28,620, this was only 0.9% (270) fewer than in 2016, and represents the second-largest annual number of acceptances between 2010 and 2017.
While acceptances in England fell by 2.6%, those in Scotland and Wales, where the bursary was retained, actually increased. There was an increase of 9.3% in Scotland and 6.2% in Wales.
In addition to the changing numbers, there was also a significant shift towards a younger age profile of those starting nursing degree courses. In particular, more 18- and 19-year-olds from England were accepted onto nursing courses in the UK than ever before. By contrast, the number of acceptances for older age groups fell. In 2017, 4,575 applicants aged 21–25 years were accepted, a fall of 13% (680), and 8,450 applicants aged 26 and over were accepted, a fall of 6% (545). These changes meant that, for the first time, there were more 18-year-olds accepted to nursing courses than 21- to 25-year-olds.
Another potentially significant change is that more applicants were placed onto nursing courses through the 'clearing' process than ever before. Clearing is the system universities use to fill any spare places on their courses after offers held by applicants have been confirmed. There are several different acceptance routes in the admissions cycle. In England, the majority (around 77%) of nursing acceptances were through applicants’ first choice of university. In 2017, 17,040 applicants were accepted through this route, 1,570 fewer than in 2016 (a decrease of 8.4%). Around 2% of nursing applicants were accepted through their insurance choice, while acceptances through clearing increased to the highest on record – 2,585 (a rise of 39% on 2016), with almost 12% of applicants accepted via this route.
The 2018 application cycle
The changes in the patterns of applications and acceptances in 2017 could be attributed, at least in part, to it being the first ‘transition’ year to the new funding model in England. But we now have an additional year of data to analyse. Statistics from the end of June deadline in the 2018 university application cycle show an overall decline of 9% in applicants for nursing degree courses across the UK, compared with the same point in 2017 (Figure 13). This decline should be seen in the context of an overall UK fall of 2% in the number of applicants to all undergraduate subjects, and an 8% rise in the number of applicants to medicine and dentistry.
Figure 13: First-time applicants and reapplicants to undergraduate nursing degree courses in England, 2009–2018
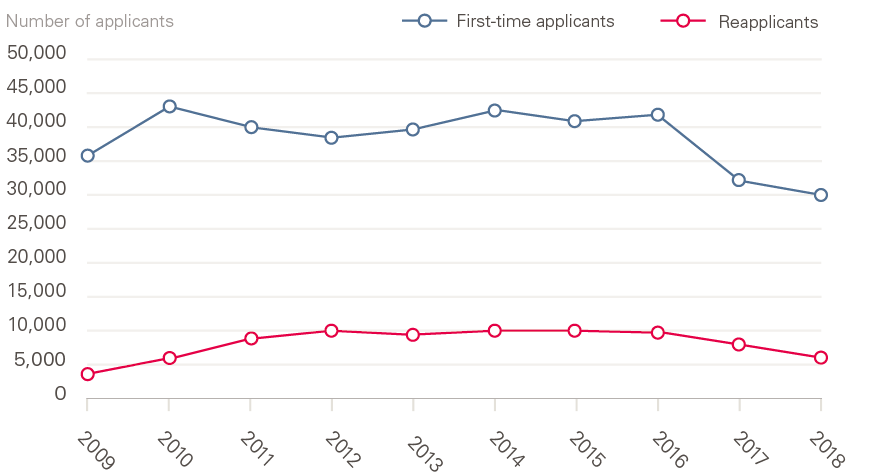
Source: Universities and Colleges Admissions Service. 2018 Cycle Applicant Figures – June Deadline (2018).
The number of applicants for nursing courses from England fell to 35,260 in 2018, down by 12% (compared with a 4% decline across all subjects in England). This is the smallest number of applicants to nursing courses since 2009. There was a smaller percentage reduction in applicants from Northern Ireland (down 7%), but increases of 1% and 2% in Wales and Scotland, respectively. The number of applicants from other EU countries fell for the first time since 2009 (by 8% to 1,180), while non-EU applicant numbers rose for the first time since 2009 (by 13% to 750).
Applicants fall into two categories: first-time applicants and reapplicants (those who had applied in the previous cycle). Breaking the data down by these two categories reveals that the number of first-time applicants in England has fallen by 8% to 29,730, but the number of reapplicants has fallen by 29% to 5,530. That is, in the most recent year, almost half (47%) of the overall decline is due to a drop in the number of reapplicants. This trend in reapplicant numbers has occurred, to varying degrees, across all four countries of the UK. It also seems to have affected nursing more than other subjects – for comparison, in England the reapplicant figure for all subjects was 8% lower in 2018 than in 2017.
Looking at these figures by country, we see that universities in England had applications from 38,970 students in 2018, compared with 44,160 in 2017 – a drop of just under 12%. However, as we have seen in 2017, a reduction in applicant numbers will not necessarily mean an equally large drop in the number of students accepted onto courses.
Analysis by age shows that, in England, the number of applicants in all age groups has fallen for a second year, with the largest percentage falls in the older age groups (Figure 14).
Figure 14: Change (%) in applicants to undergraduate nursing degree courses by age in England, 2016/17 and 2017/18
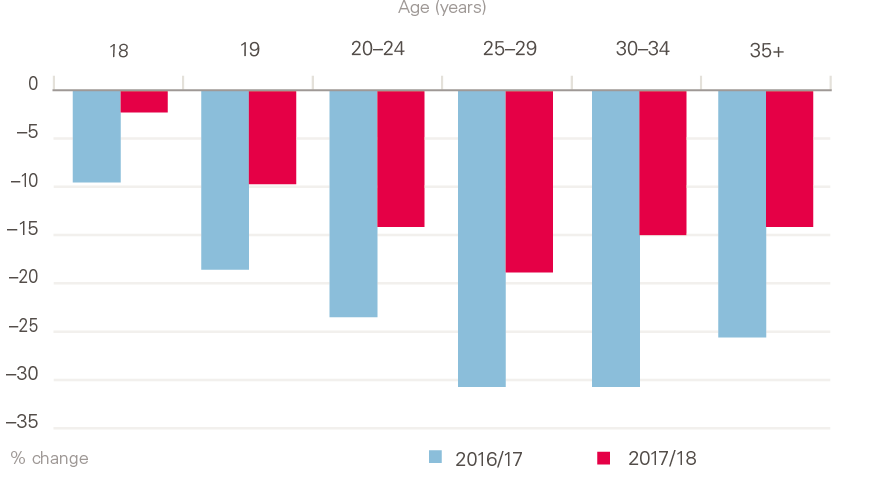
Source: Universities and Colleges Admissions Service. 2018 Cycle Applicant Figures – June Deadline (2018).
As of 13 September 2018, 28 days after A-level results day, the number of applicants placed on nursing degree courses across the UK was 26,890 – some 350 (1.3%) fewer than in 2017. Given the 2% decline in the number of students placed across all subjects, this might, at first glance, look like a comparatively positive outcome for nursing. However, it is far from the boost in numbers that was expected to result from the change in funding.
In practice, the number of students living in England who have been placed on nursing degree courses in the UK has dropped to its lowest level (20,250) since 2013 (Table 2). This is a fall of 8.1% since 2016, the last year when new nursing students were eligible for NHS bursary funding.
The number of students placed on nursing courses at universities in England 28 days after A-level results day was down by 650 (3%) to 20,690 in 2018. In Scotland and Wales, where the bursary has been retained, student numbers have risen – by 5.5% in Wales and 4.4% in Scotland, both all-time highs. Scotland has also recently announced a 7.6% increase in students for the 2019/20 intake – focusing on the shortage areas of learning disabilities, mental health and midwifery – along with an increase in the annual student bursary to £10,000 a year by 2020/21.
Table 2: Number of placed applicants on UK university nursing courses by country of domicile 28 days after A-level results day, 2013–2018
|
Country of domicile |
2013 |
2014 |
2015 |
2016 |
2017 |
2018 |
Change |
|
England |
18,620 |
20,660 |
20,670 |
22,040 |
20,820 |
20,250 |
–570 (–2.7%) |
|
Northern Ireland |
910 |
940 |
950 |
1,100 |
1,070 |
1,050 |
–20 (–1.9%) |
|
Scotland |
2,640 |
2,970 |
2,950 |
2,950 |
3,200 |
3,340 |
+140 (+4.4%) |
|
Wales |
1,280 |
1,270 |
1,500 |
1,580 |
1,630 |
1,720 |
+90 (+5.5%) |
|
EU27 |
510 |
440 |
480 |
520 |
420 |
400 |
–20 (–4.8%) |
|
Other |
60 |
60 |
80 |
60 |
100 |
130 |
+30 (+30.0%) |
|
Total |
24,020 |
26,340 |
26,630 |
28,520 |
27,240 |
26,890 |
–350 (–1.3%) |
Source: Universities and Colleges Admission Service. Statistical Releases – Daily Clearing Analysis 2018 (20 September 2018).
EU27: other nations in the European Union.
In 2017, the fall in nursing-student intakes in England might have been attributed in part to the confusion surrounding the change in funding arrangements; in 2018, the inescapable conclusion is that the change in funding arrangements in England, combined with the demographic drop in the population of 18-year-olds, has resulted in a decrease in the number of nursing students rather than the expected increase.
At the same time, the number of students placed via the clearing process is much higher than in previous years. In 2018, the number of students from England who were placed via clearing (at 28 days after A-level results day) was 1,570, compared with 1,600 at the same point in 2017 and well above the average of 1,100 for the previous 8 years. Students placed via clearing are more likely to drop out without completing their studies.
In addition to the fall in student numbers, there has been a further shift in the age profile of applicants accepted from England. Despite the overall decline in the 18-year-old population, the number of 18-year-olds accepted onto nursing degree courses has risen. As a proportion of those accepted, 18-year-olds have risen from 19.1% in 2016 to 24.3% in 2018, while those aged 20 years and over have declined (Figure 15). In Scotland, the opposite has happened: students 18 years of age have fallen as a proportion of the total (from 21% to 18%) while those 20 years of age and older have increased (from 67% to 72%). This suggests that the change in funding arrangements has actively discouraged older applicants in England.
Figure 15: Age profile of placed applicants on nursing courses in England, 2016 and 2018
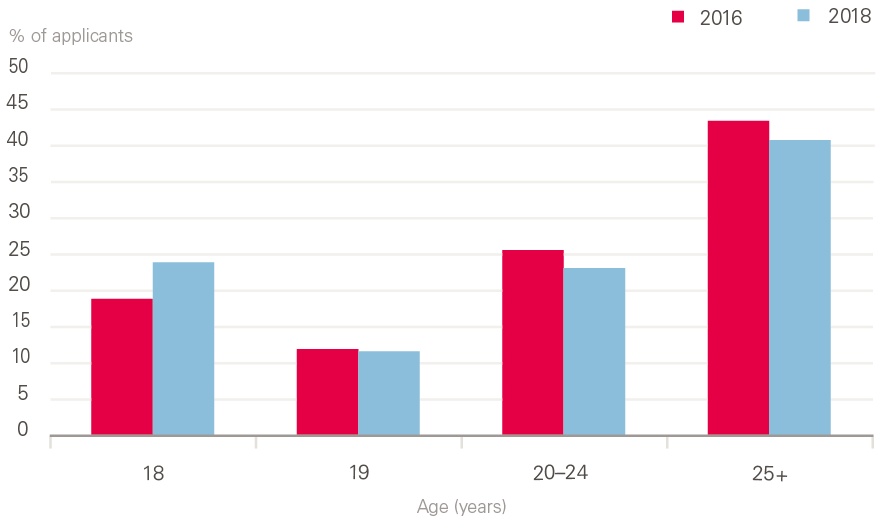
Source: Universities and Colleges Admissions Service. Statistical Releases – Daily Clearing Analysis 2018 (2018).
† Core medical training is the 2-year part of postgraduate medical training following Foundation Years 1 and 2. Successful completion of core medical training is required to enter higher training in the medical subspecialties.
‡ 'Health care scientists' comprises those working in laboratory (pathology) sciences, physiological sciences, medical physics, clinical engineering and bioinformatics.
§ 'Bank' staff are defined in NHS Digital statistics as those working in roles with no set contracted hours who are paid through the Electronic Staff Record. Other bank staff may be paid through other systems and are not included in these figures; neither are staff employed through other agencies.
¶ Over a quarter of the records missing nationality information are for ambulance staff.
** In March 2018, there were 400 FTE staff from countries in the EEA.
†† 23.6% of practices did not supply fully valid records for direct patient care staff for September 2018, so estimates are provided by NHS Direct. The proportion of estimated records for the other staff groups is 5.7% for GPs, 7.5% for nurses and 12.1% for administration and other non-clinical staff.
Pressure points
As noted in the introduction, each year we take a more detailed focus on specified ‘pressure points’ – significant workforce problems that have a clear national dimension, require national analysis and, most likely, demand nationally directed interventions. This year, we take the theme of attrition and retention in the workforce of the NHS in England, and look in detail at two aspects of the problem – trends in the stability of the workforce, and attrition of student nurses.
We first conducted a broad-based examination of the indicators of qualified staff retention and attrition, focusing on turnover and stability. In part, this was to assess trends in these indicators over the past year, but we also looked at variations in these measures across different trusts and regions.
We also looked at the trends and attrition in student nurses. The analysis of student nurses was undertaken against the backdrop of the change from the bursary to loan model of funding for student nurses in England (the other three UK countries retaining some form of a bursary-based funding model). The new loan model was first introduced in 2016/17, and despite initial claims that this would increase student-nurse numbers, the applications to pre-registration nursing courses in England dropped significantly. The actual first-year student nurse intake in 2017/18 was almost at the same as in 2015/16, the last year of the bursary model.
Retention in the NHS workforce
Against the backdrop of NHS staff shortages, improving retention has been cited as a method of achieving relatively quick improvements in staffing numbers (compared with training new staff), reducing vacancies, and improving staff stability. Retention, as measured by staff turnover (the percentage of staff leaving the NHS) has not improved, and in some cases deteriorated, in recent years. In addition, initial analysis in Rising Pressure highlighted that staff stability had also declined in recent years.
Turnover (the staff who leave) is only part of the picture, and examining stability indices (the staff who stay on) can give more insights. In this year’s report, we’ve devoted more attention to assessing trends in the stability of NHS staff.
Our analysis is based on an assessment of NHS trust-level staff stability indices. The stability index is a measure of the percentage of staff in a trust at the beginning of a year who remain in their role at the end of the year. Like all such measures, it has some limitations, but it provides an alternate measure to the more commonly used turnover rate, and can provide more of a focus on staff who stay rather than those who move.
NHS staff stability decreased substantially between 2010/11 and 2017/18. The median stability index in trusts has reduced from 89% to 85% over the period. In the past year, despite the policy focus of reducing reliance on temporary staffing, we find that stability rates have not improved and are broadly flat at around 85%.
Across the same period, there has also been a growing gap between the ‘best’ and ‘worst’ NHS trusts, as measured by stability rate. This can be seen in the range of the curves below, which show NHS trusts ordered by their stability index in 3 separate years – from the beginning, middle and end of the period (Figure 16).
Figure 16: Stability rates of NHS trusts in England 2010/11 to 2017/18
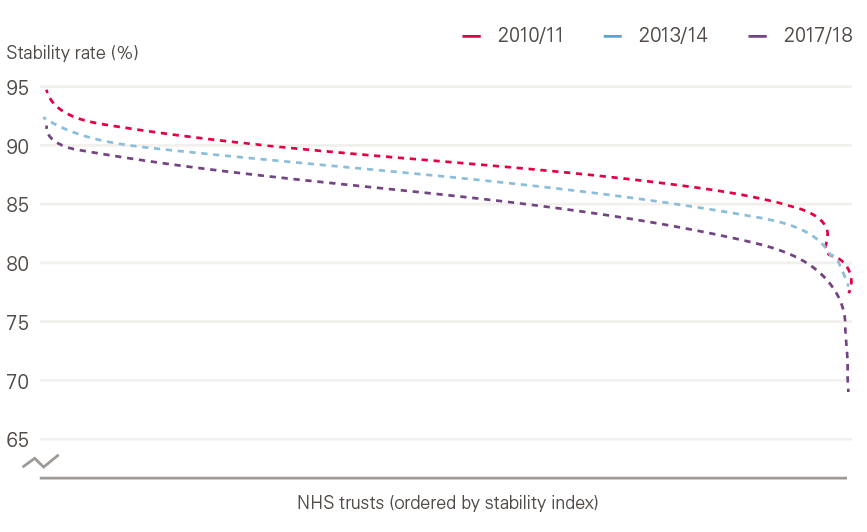
Source: Health Foundation analysis of NHS Digital data.
This variation can be seen even more strongly when broken down by region (Figure 17). The stability rate decreased in all regions between 2010/11 and 2017/18, but the scale of the decrease and the starting point varies. In 2017/18, the median stability index of trusts in the north-east was 89%, which made it the most ‘stable’ region that year. However, this stability rate was no better than that of the median region in 2010/11. The least ‘stable’ region, north-central and east London, had a stability index of 81% in 2017/18, meaning almost 1 in 5 staff left their post that year.
The stability rate is particularly low in areas of London, perhaps reflecting the fact that the workforce is younger, more international, and has higher career mobility, as well as the higher number of vacancies and use of temporary staff, and the fact that trusts are in close proximity, meaning it is easier for staff to move between them. This might be exacerbated by movement of EU staff.
Figure 17: Regional-level NHS trust stability-rate, 2010/11 and 2017/18
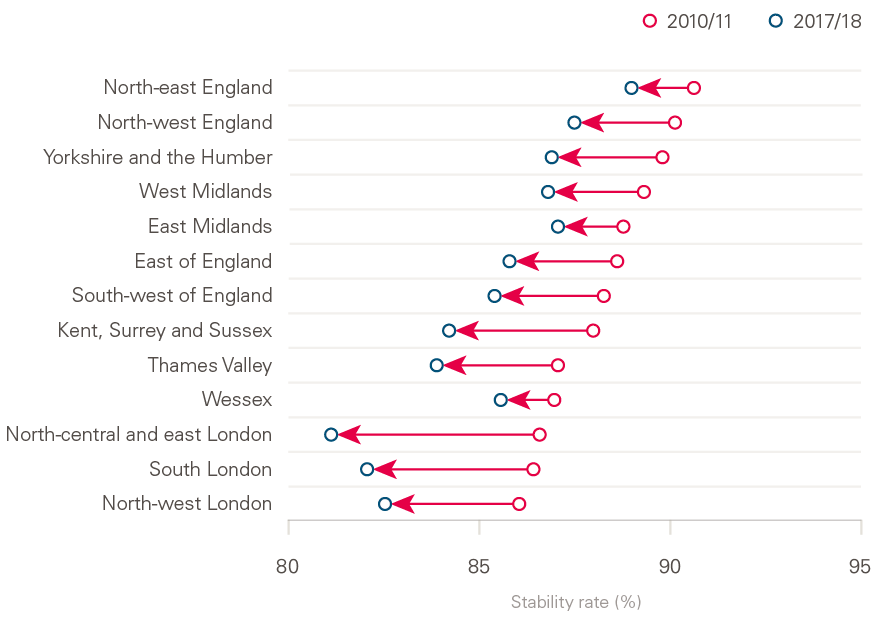
Source: Health Foundation analysis of NHS Digital data. Excludes doctors in training.
As noted above, the change in stability rate across the period varies widely by region, with a larger decline in north-central and east London than in Wessex, although some of this variation may be related to structural changes in local NHS trusts, such as mergers or the movement of services.
Stability also varied by the type of trust (Figure 18). Community trusts had the lowest average (median) stability at 79%, while ambulance trusts were the most stable (88%). Some of this will be due to the types of staff employed in each type of trust. There are four outliers (indicated by the circles on the Figure) which may be because of structural changes in these trusts, or just poor underlying stability. Even the least-stable acute or ambulance trust (indicated by the short horizontal line below the box) is more stable than the median stability of community trusts.
There is some evidence that this decline in stability and turnover can be slowed. Emerging evidence from NHS Improvement’s retention programme suggests that through data analysis, the engagement of the board and a focus on retention, trusts can improve their retention rates. This programme has been employed by 110 NHS trusts, and 71% of the first cohort have seen an improvement in their turnover rate. Overall, for the first cohort, the average turnover rate reduced by 1.6%. Because of the number of trusts in this cohort (and the recency of the programme) this is unlikely to have altered the national picture significantly so far, but it may do as the programme is rolled out further, as stated in The NHS Long Term Plan.
Figure 18: Difference in stability of NHS trusts by trust type, 2017/18
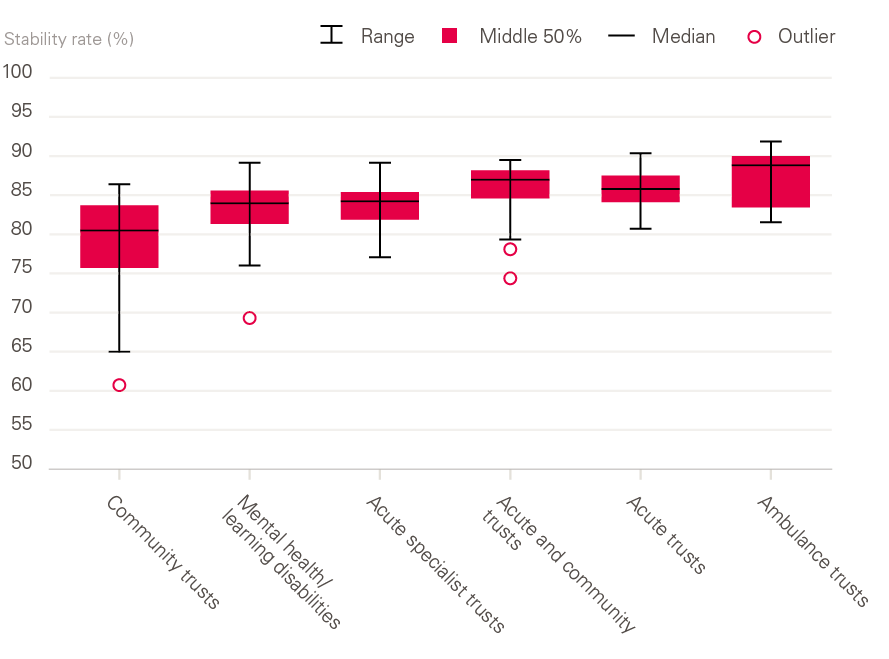
Source: Health Foundation analysis of NHS Digital data.
While it is still early days for the programme, and too soon for a conclusive evaluation, the evidence is promising and suggests that there is scope for improvement in this area. Often this is not the result of more policies and programmes, but rather of greater awareness and the sustained implementation of existing policies, possible career pathways or opportunities.
However, while work–life balance has increasingly been reported as a driving factor for people leaving the NHS – more than two and half times as many people citing it in 2018/19 than in 2011/12, an additional 11,000 people – the most common reason for leaving is still reported as ‘other/unknown’.
This is compounded by the fact that research evidence on the factors driving turnover and stability is limited. A recent systematic review of systematic reviews found that ‘the evidence is not as definitive as previously presented from individual reviews. Further research is required, of rigorous research design, whether quantitative or qualitative, particularly against the outcome of actual turnover as opposed to intention to leave’. However, it did identify nurse stress and dissatisfaction as important individual factors and managerial style and supervisory support as important organisational factors.
Student nurse attrition
Although acceptance rates into pre-registration nursing and midwifery courses are an important indicator of the potential future supply of nurses and midwives, attrition during training must also be considered. This point is made by the House of Commons Health and Social Care Select Committee in their 2018 report on the nursing workforce, where they said ‘we would like further assurance from Health Education England that attrition rates have been taken into account in future workforce projections. There is stark variation in the attrition rate for nursing degree courses. This must be closely monitored, and Health Education England and government must hold universities and NHS provider organisations to account for investigating and addressing the causes […] We want to see action to reduce variations in attrition rates between institutions and will follow this up in a year to ensure progress has been made in bringing low performers up to the level of the best.’8
In 2018, the Health Foundation collaborated with Nursing Standard to examine the rates of student nurse attrition, using Freedom of Information legislation to obtain data from universities offering pre-registration nurse and midwifery courses.
We obtained data from 58 of the 74 UK universities that offer nursing degrees. It showed that, of the 16,544 UK nursing students at these universities who started 3-year degrees due to finish in 2017, 4,027 left their courses early or suspended their studies, giving a UK-wide average attrition rate of 24%. (The attrition rate was similar for the less common 4-year nursing degree.) Previous studies carried out by Nursing Standard had similar findings. In 2008, the overall average reported attrition rate was 25%, in 2010 it was 28% and in 2017 it was 25%. The survey found that at the level of individual universities, the attrition rate ranged from as much as 50% to as little as 5%, although some extreme values may be due to differences between in how universities measure or interpret the numbers (Figure 19).
A similar picture is seen in midwifery, where the attrition rate is 21% but varies by provider – from as much as 42% to as little as 4%.
This analysis suggests there has been little change in overall national attrition rates in recent years, despite it being a policy concern. In 2015, the Department of Health instructed Health Education England to halve the ‘avoidable’ attrition rate (without indicating what the rate was). Health Education England subsequently set up a working group to examine the issue, and finally published its Reducing Pre-registration Attrition and Improving Retention (RePAIR) report in November 2018. The report covered the period of the bursary system coming to an end and the introduction of student loans in England.
The report used data from a sample of 16 universities for the years 2013/14 and 2014/15, and used a different method of analysing attrition than that used by the Nursing Standard survey. It reported an average dropout rate of 33.4%, with the highest rates in learning disability (39%) and mental health nursing (35%). In a survey of 3,447 student nurses, it found that clinical placement experiences, finances and academic pressures were the most commonly listed reasons why students considered leaving courses. Of the students surveyed, 63% said they would not have applied for their nursing degrees if they had had to pay their fees.
Figure 19: Student attrition rate during a 3-year nursing degree by provider,2014–2017
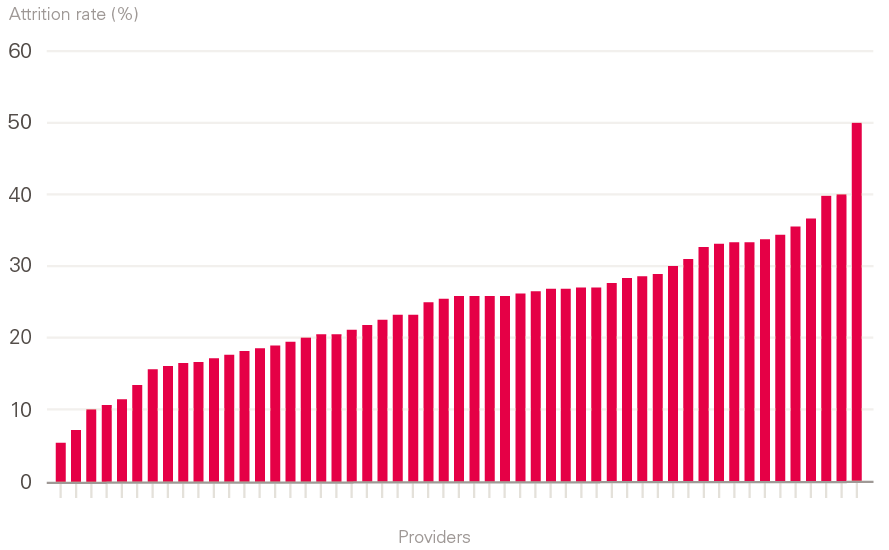
Source: Data obtained directly from universities via Freedom of Information requests.
The RePAIR report recommended:
- the establishment of hardship funds to enable more prospective students to consider a career in health care
- that higher education institutes should work more closely with health care providers to allocate placements, and to take steps to ensure that students are paid in an efficient and timely way
- the establishment of ‘buddy’ schemes
- more support for second-year students
- greater clarity over students’ roles in practice by clearing up confusion about supernumerary status.
Conclusions
In our previous workforce report, Rising Pressure, we pointed to a worsening situation in the NHS, with demand for services growing much faster than key staff groups. We highlighted that the lack of a sustained and nationally focused approach to workforce policy and planning – compounded by the ongoing disconnect between identified staffing gaps and funding decisions – was preventing effective and coordinated policy interventions.
This current report reinforces those findings. NHS staffing is failing to keep pace with the level of activity and demand, notably in some critical roles such as GPs and nurses. The balance of evidence suggests continued difficulties with NHS staff retention and stability. As yet, there is no sign of any improvement in student-nurse intake.
International recruitment remains vital to achieving overall staffing numbers, but it is being constrained by broader migration policies and the uncertainties of Brexit. At present there is not a coherent government approach to international recruitment in the NHS in England. A more strategic and 'joined-up' approach is required, involving government health departments, the Home Office, regulators and employers; one that is embedded in overall national health workforce planning.
Although the white paper on general migration policy (and The NHS Long Term Plan) signals a move in this direction, it is not enough to address the urgent NHS staff shortages. In the short term, more staff should be added to the Shortage Occupation List, including certain medical specialties and allied health professionals, and nurses kept on the list.
Our main conclusion in this report is that the gap between the demand for and supply of NHS staff is not getting any better. It is, in fact, worsening for some key staff groups and service areas, notably learning disabilities and primary care. Additional analysis and recommendations will be presented in a joint report on the health and social care workforce in England, which we are producing with The Kings Fund and Nuffield Trust, and which will be published in early 2019.
This report is being published at a critical moment. NHS England has published The NHS Long Term Plan, which recognises that the NHS workforce can be the enabler of its objectives. However, if the existing workforce shortages and deficits continue, they will severely hinder progress. The Plan does begin to sketch out how to deal with shortages and retention issues – it identifies the need for improved data, and it points to a new approach to NHS workforce planning. Later this year, a new NHS workforce plan will be developed and published in support of The NHS Long Term Plan. This will be developed by a new national workforce group overseen by NHS England, NHS Improvement and Health Education England.
These developments represent progress and potential, but two key points that we highlighted in our first report must be kept in mind. First, that NHS staffing issues and NHS funding streams are inextricably linked – staffing challenges cannot be solved without consideration of funding, and funding decisions should not be made without consideration of the impact on NHS staffing.
Second, we highlighted that the administrative structure for NHS workforce planning in England has been repeatedly reorganised following reforms in the NHS, and that a lack of coherent policy that takes into account both funding and staffing has been a recurring theme. The combined effect has been to undermine any long-term consistency in the NHS’s approach to workforce policy and planning.
In 2016, we noted 11 significant structural changes to NHS national and regional workforce planning since 2000.9 A twelfth structural change must now be added, with the announcement in October 2018 of the realignment of Health Education England, NHS Improvement and the NHS in England. A thirteenth has also been signalled by the publication of The NHS Long Term Plan, which promises that there will be further structural change following the establishment of a new national workforce group and a detailed national workforce plan.
It is positive that there is now a recognition of the urgent need to establish a stable and coherent national approach, aligned with, and in support of, The NHS Long Term Plan. Part of this must be to recognise that national workforce policy and planning cannot be effective unless the direct connection between staffing and funding is at the forefront of the approach. Planning requires clarity of function – in other words, clearly identifying which national agency is responsible for each aspect of policy and planning, and how they coordinate – rather than just another restructuring, which risks the continuation of blurred roles and responsibilities .
The NHS in England employs more than a million people, including over 600,000 professionally qualified clinical staff. Long lead times for staff training, combined with rapidly changing social and technological practices, makes health care workforce policy and planning a challenge. In this report, we have highlighted that these challenges have continued, and in some cases deepened, concerning recruitment, retention and stability.
We note with hope and expectation that The NHS Long Term Plan may be the catalyst for improvements in funding for the NHS workforce, and for improvements in workforce planning and policy functions. But beyond any specific policy meaures, the underlying faultlines in the overall approach to workforce policy and planning need to be addressed. If the ‘national’ element in the overall workforce policy and planning system is to be truly national, and fully effective, it must:
- take account of the national labour market (not just NHS employment)
- align planning and policy across different occupations and sectors
- focus more on productivity and investment in the current workforce rather than on new roles (unless there is significantly more central support for scale-up)
- achieve a more efficient balance of skill mix
- enable local workforce planning to be conducted within a supportive overall framework
- recognise that national workforce policy and planning cannot be effective unless the relationship between staffing and funding is at the forefront of the approach.
References
- Health Foundation. The Health Care Workforce in England: Make or Break? Health Foundation, 2018.
- NHS England. The NHS Long Term Plan. NHS England, 2019.
- Buchan J, Charlesworth A, Gershlick B, Seccombe I. Rising Pressure: The NHS Workforce Challenge. Health Foundation, 2017.
- NHS England. General Practice Forward View. NHS England, 2016.
- Wickware C. Health secretary in talks to delay 2020 target for recruiting 5,000 extra GPs. Pulse, 5 October 2018 (www.pulsetoday.co.uk/news/gp-topics/employment/health-secretary-in-talks-to-delay-2020-target-for-recruiting-5000-extra-gps/20037548.article).
- Campbell D. Two in five GPs in England intend to quit within five years – survey. The Guardian, 31 May 2018 (www.theguardian.com/society/2018/may/31/two-in-five-gps-in-england-intend-to-quit-within-five-years-survey).
- Bostock N. GP early retirements have doubled since start of the decade. GP, 5 April 2017 (www.gponline.com/gp-early-retirements-doubled-start-decade/article/1461188).
- NHS Improvement. Staff Retention Support Programme: One Year On. NHS Improvement, 2018 (https://improvement.nhs.uk/resources/staff-retention-support-programme-one-year).
- House of Commons Health Committee. The Nursing Workforce: Second Report of Session 2017–19. TSO (The Stationery Office), 2018.
- Collins A. NHS will still be short of nurses in five years, Dalton warns. Nursing Standard, 20 December 2018.
- Jones-Berry S. New routes to nursing, along with changes in the way students are supported on placement, may present a challenge to nurses. Nursing Standard, 10 August 2018.
- NHS Digital. NHS Workforce Statistics – July 2018. NHS Digital, 2018 (https://digital.nhs.uk/data-and-information/publications/statistical/nhs-workforce-statistics/nhs-workforce-statistics---october-2018-provisional-statistics).
- Longhurst C. Nursing associate role ‘has made things worse for social care’. Nursing Standard, 19 June 2018.
- Health Education England and NHS Improvement. Public Statement from Health Education England and NHS Improvement. Health Education England, 23 October, 2018 (www.hee.nhs.uk/news-blogs-events/news/public-statement-health-education-england-nhs-improvement).
- Ford M. Slight drop in nurse vacancies but almost 41,000 posts still empty. Nursing Times, 3 December 2018 (www.nursingtimes.net/news/workforce/slight-drop-in-nurse-vacancies-but-almost-41000-posts-still-empty/7026987.article).
- Queens Nursing Institute. District Nurse Education Report 2016–2017. Queens Nursing Institute, 2018 (www.qni.org.uk/resources/district-nurse-education-report-2016-17/).
- Dayan M, Palmer W. What’s Really Going on with Nursing Outside Hospital? Nuffield Trust, 2018.
- NHS Improvement. NHS could free up £480m by limiting use of temporary staffing agencies. NHS Improvement, 31 August 2018 (https://improvement.nhs.uk/news-alerts/nhs-could-free-480m-limiting-use-temporary-staffing-agencies).
- NHS England. Five Year Forward View. NHS England, 2014.
- Nursing and Midwifery Council. Change to English language requirements for nurses and midwives gets green light. Nursing and Midwifery Council, 28 November 2018 (www.nmc.org.uk/news/news-and-updates/change-to-english-language-requirements-for-nurses-and-midwives-get-green-light).
- House of Commons Health Committee. Workforce Planning Fourth Report of Session 2006–07. Vol 1. TSO (The Stationery Office), 2007.
- Organisation for Economic Co-operation and Development. Health Workforce Migration [database]. OECD, 2018 (http://stats.oecd.org/Index.aspx?QueryId=68336)
- Kendall-Raynor P. Scotland creates 283 new places for nursing and midwifery students. Nursing Standard, 8 November 2018 (https://rcni.com/primary-health-care/newsroom/news/scotland-creates-283-new-places-nursing-and-midwifery-students-141481).
- Health Education England. RePAIR: Reducing Pre-Registration Attrition and Improving Retention. Health Education England, 2018.
- NHS Digital. Leavers by Reason for Leaving, Staff Group and HEE Region. NHS Digital, 2018 (https://digital.nhs.uk/data-and-information/find-data-and-publications/supplementary-information/2018-supplementary-information-files/leavers-and-joiners/leavers-by-reason-for-leaving-staff-group-and-hee-region).
- Halter M, Boiko O, Pelone F, Beighton C, Harris R et al. The determinants and consequences of adult nursing staff turnover: A systematic review of systematic reviews. BMC Health Services Research. 2017; 17: 824.
- Jones-Berry S. Why nursing students leave: causes and remedies for attrition revealed. Nursing Standard, 9 November 2018 (https://rcni.com/nursing-standard/newsroom/news/why-nursing-students-leave-causes-and-remedies-attrition-revealed-140491).
- Home Office. The UK's Future Skills-Based Immigration System. Home Office, 2018.
- Buchan J, Seccombe I, Charlesworth A. Staffing Matters; Funding Counts. Health Foundation, 2016.