Introduction
The most important asset to health and social care in the UK is its workforce. The 2.5 million people working across England are highly varied, and all vital. They include the very visible workforce – the surgeons and nurses working alongside the caterers and cleaners in hospitals, as well as the GPs, pharmacists, physiotherapists and those providing care in the community and at home. But they also include the less visible workforce, such as those working in corporate support services performing crucial roles such as keeping track of millions of appointments, making payments for the drugs and equipment used every week, and planning for future services. The social care workforce is just as crucial, delivering front-line care both in people’s own homes and in care homes. Health and social care are major contributors to the wider economy – accounting for about one in 10 jobs. This varies across the country, from 6% in London to over 12% in the north east (Figure 1).
Figure 1: Health and social care workers as a percentage of the total workforce, 2015/16
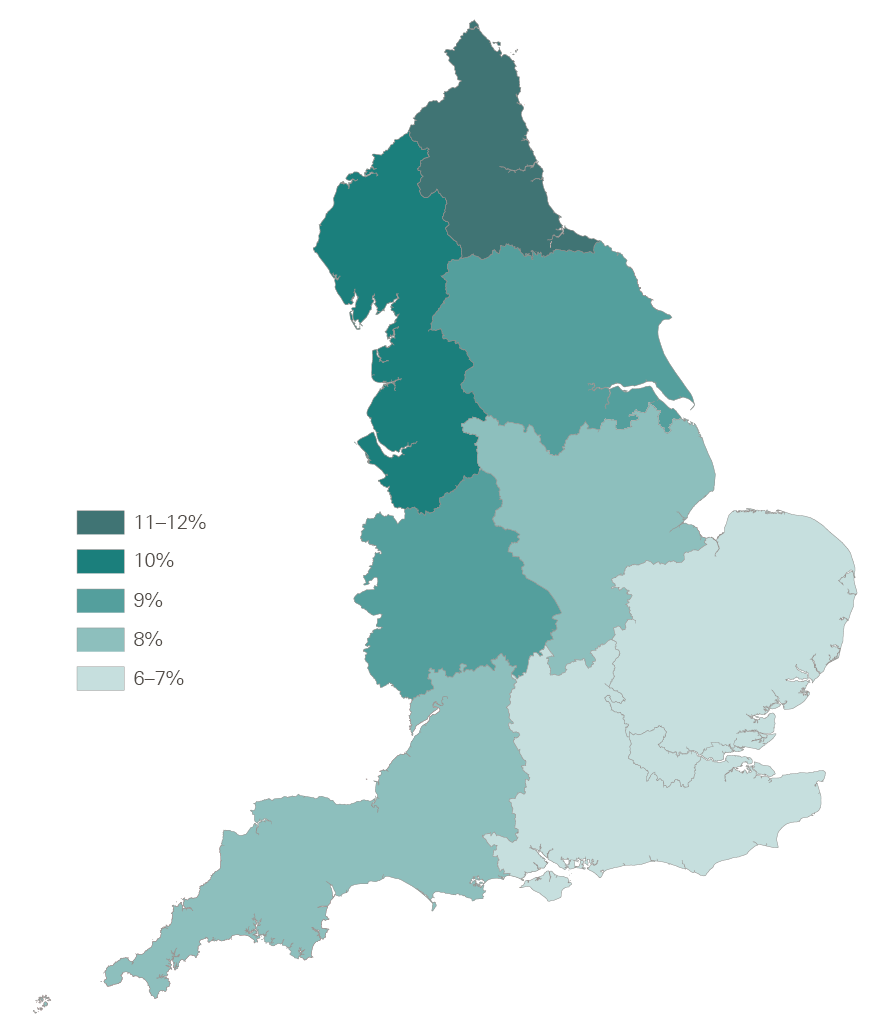
Source: Social care data are from Skills for Care, The state of the adult social care sector and workforce in England, 2016. NHS data are from NHS Digital (2017), NHS workforce statistics.
There are growing concerns that the NHS and social care don’t have enough of the right staff in the right places. NHS England’s Five Year Forward View sets out plans to transform services to meet the changing needs of an ageing and growing population with rising chronic health conditions. But these plans risk being undermined due to an increasingly overloaded and stressed workforce. The recruitment and retention of staff is now one of the biggest challenges facing NHS leaders in England. Workforce issues are never far from the media spotlight, and have already featured in the debates in the run up to the June 2017 general election.
This is the third in a series of briefings to help inform the debate ahead of the election. In our first two briefings, we looked at NHS and social care finances and the quality of care provided by the NHS in England.
In the first briefing, NHS and social care funding – Three unavoidable challenges, we showed that funding since 2010 has not risen as quickly as the pressures on the NHS, which include meeting the health care needs of a growing population, and the rising costs of staff, drugs and other essentials. In the second briefing, Quality of care in the English NHS – In the balance, we drew attention to the deteriorating waiting times for hospital and emergency care, but also showed that there have been improvements in other dimensions of care since 2010 – such as outcomes for stroke and heart attack – due in no small part to the commitment and quality of the people working in the NHS.
This third briefing identifies the fundamental challenges facing the workforce today, and considers what steps might be needed to make sure the NHS and social care in England have enough of the right people to deliver high quality care in the future. We have focused on England, as health and social care have been a devolved matter since the late 1990s, but we have used UK data where this is the only information available.
For more information on the data and reports mentioned in this briefing, please see the list of sources at www.health.org.uk/publication/election-briefing-sustainable-workforce
The scope of the current problem: recruitment, retention and morale
NHS staff shortages
It is clear that both the NHS and the social care system in England are struggling to secure enough staff to provide high quality care for those who need it. In the 2016 NHS staff survey, staff reported concerns over shortages: 47% said current staffing levels were insufficient to allow them to do their job properly. Recruitment and retention of staff was identified by NHS leaders as the biggest challenge they face. National bodies such as the Royal College of Nurses and the Royal College of Midwives have reported their concerns on staff shortages to the NHS Pay Review Body.
The data also tell a clear story of shortages. In 2015, Health Education England calculated that the NHS had 30,000 fewer full-time equivalent nurses than needed – equivalent to nearly one in 10 positions. For those nurses that care for adult patients, the shortfall was 22,000 (Figure 2). This shortage is expected to continue to 2020 – and depending on different assumptions, it could be as high as 38,000 or as low as 15,000. The Royal College of Nurses calculated that one in nine (11.1%) nursing posts are unfilled and that this number has doubled since 2013. There are also gaps in recruiting trainee doctors, with one in five GP and psychiatry training places unfilled in 2017. While hospital staff shortages are the ones that most often hit the headlines, patients also need access to a range of services provided in the community (known as non-acute services). There are major problems with staffing numbers in non-acute services. For example, between 2009 and 2016, the numbers of full-time equivalent mental health nurses and community nurses employed by the NHS both fell by 13% (Figure 3), while the number of district nurses fell by 42%.
Figure 2: The shortfall of nurses specialising in caring for adult patients, 2015 and 2020
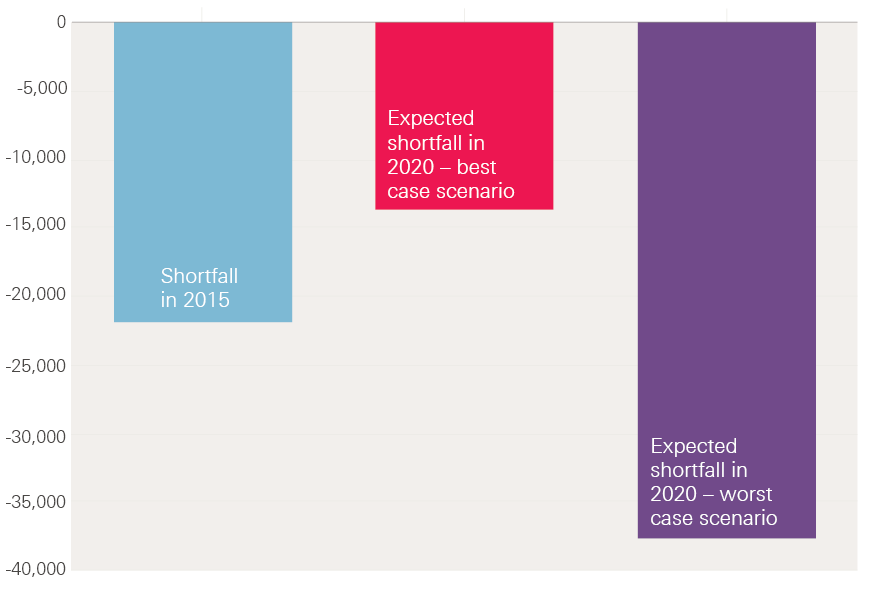
Note: Data relate to nurses specialising in caring for adult patients. High and low supply projections are based on different assumptions about, for example, international recruitment, conversion rates of student commissions into NHS staff and turnover.
Source: Health Education England, Workforce Plan for England.
Figure 3: Number of full-time equivalent community and mental health nurses in the NHS in England, 2009–16
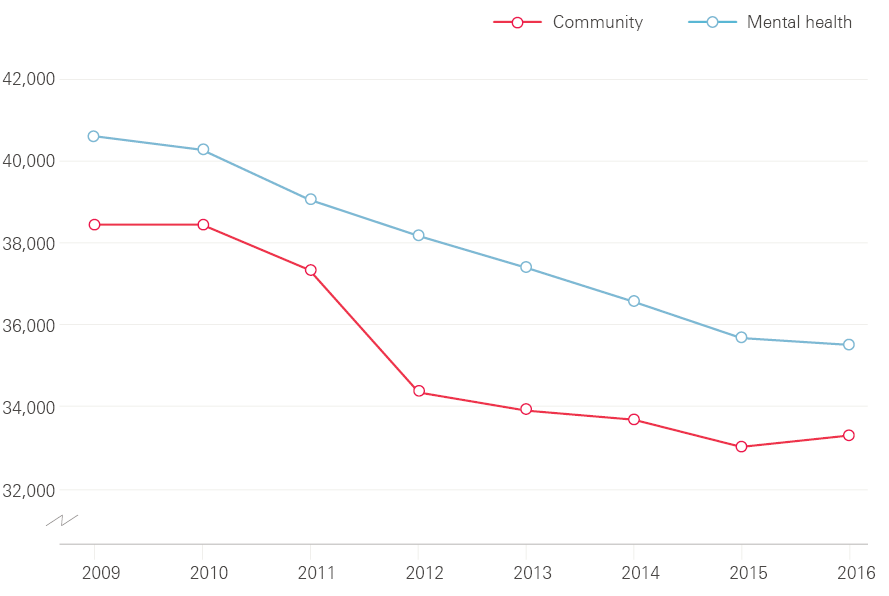
Source: NHS Digital (2017), NHS workforce statistics.
Social care staff shortages
The shortages are just as severe in social care, where more than 900 people are estimated to leave their job every day. The annual rate of leavers has increased steadily, from 23% of the workforce in 2012/13 to 27% in 2015/16 (Figure 4). The annual leaver rate is high across all regions of England, but varies markedly across the country, from 23% in London to 30% in the south west.
The increase in care workers leaving has been mirrored by an increase in vacancy rates. For one staff group – social workers in the public sector – vacancy rates rose from 7.3% in 2012 to 13.1% in 2015. In 2015, at any one time, there were over 80,000 vacancies for social care jobs in England. In 2016, health and social work accounted for 15% (118,000) of all the vacancies in the whole UK economy.
Figure 4: Rate of staff leaving jobs in social care in England, 2012/13–2015/16
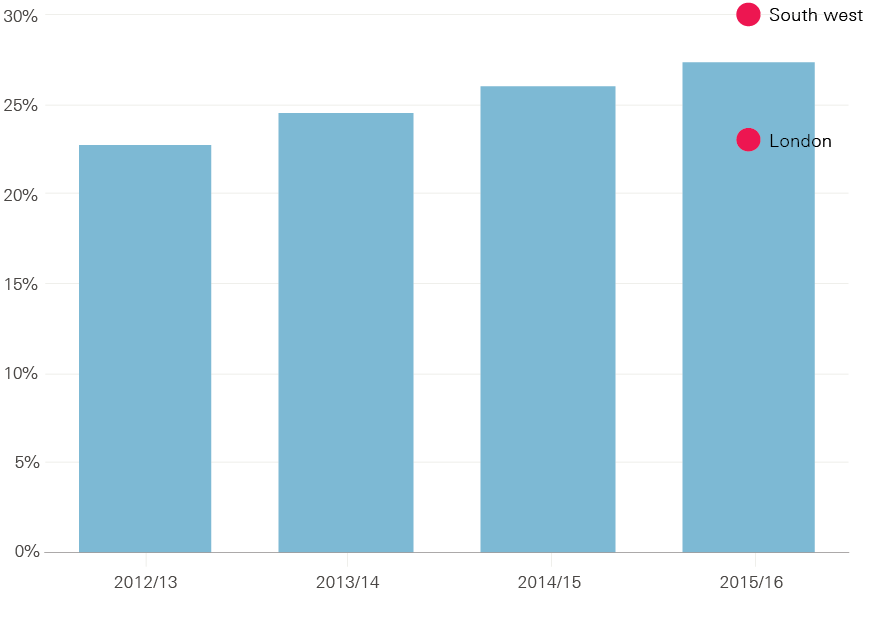
Source: Skills for Care, The state of the adult social care sector and workforce in England, 2016.
Reliance on agency staff and international recruitment
Rising staff shortages mean that providers in both health and social care are increasingly reliant on agency staff to deliver core services. In the NHS, spending on agency staff rose by 37% between 2013/14 and 2015/16, from £2.8 billion to £3.8 billion (2017/18 prices). Agency staff play a crucial role in a well-managed service, filling short-term gaps due to staff training or illness. But over-reliance on agency staff for a long period is not sustainable. Agency staff are more costly and they provide less continuity of care and team stability for hospitals and patients. In social care, 10% of staff are on a non-permanent contract (including agency and bank staff), and for support and outreach workers this is 15%.
Figure 5: Percentage of people joining the UK nursing register by where they gained their qualification, 1990/91–2015/16 (initial registrations)
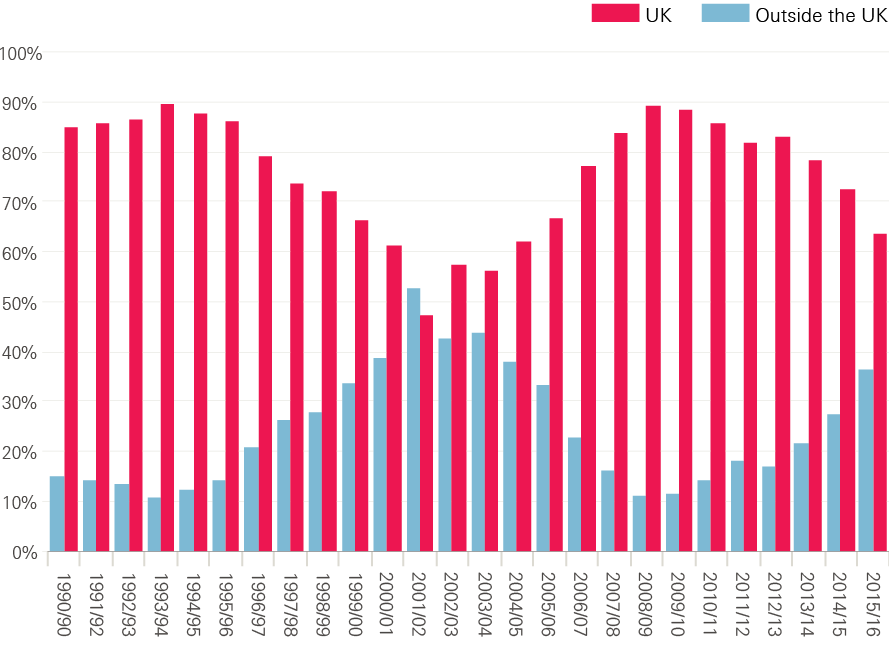
Source: The Health Foundation based on UKCC/NMC data.
These problems in recruitment and retention mean that the NHS and the social care system are heavily reliant on international recruitment. 150,000 staff in the NHS and social care in England are from the EU. In England, approximately 7% of staff in social care and over 7% of NHS nurses are from the EU. Across the UK, one in eight registered nurses was trained abroad, more than twice the average for Organisation for Economic Co-operation and Development countries (Figure 5). For doctors this is even higher, with almost one in three doctors trained abroad. While the NHS benefits from the experience and expertise of professionals from other countries, the service should not be over-reliant on recruitment from abroad simply because the UK has been underinvesting in training. In 2009/10, around one in 10 new nurses registered in the UK was trained internationally – since then the proportion has more than trebled.
The Migration Advisory Committee report in March 2016 examined whether nursing should be retained on the Shortage Occupation List to facilitate international recruitment. They recommended a longer term, but ‘tapered’, use of international recruitment of nurses, with an overall annual ceiling. The committee was concerned that the health and care sectors might not be sufficiently incentivised to tackle nursing shortages if nursing is retained on the Shortage Occupation List, pointing to their ‘poor track record’ in addressing nursing shortages by other means (domestic training, improved retention, etc). The report also noted the ‘highly suggestive indications’ that international recruitment of nurses has had the effect of saving costs by suppressing wages.
Skill mix
Alongside vacancy rates, the NHS in England also faces a challenge in employing the right mix of staff. The Five Year Forward View is driving an attempt to move more care out of hospitals and into primary and community services. Despite this, the number of full-time equivalent nurses employed in mental health and community settings has fallen (Figure 3). The number of GPs has also fallen.
In 2014, a national GP taskforce commissioned by the Department of Health reported that ‘GP recruitment has remained stubbornly below [the] target [of 3,250 a year], at around 2,700 per annum, for the last four years’. Following this, in 2015 the government committed to an additional 5,000 GPs by 2020 (above 2014 numbers). However, GP training numbers are still below target, with only 3,019 doctors starting training in 2016/17. This is an increase from 2015/16, but still 231 doctors below target.
The latest data show that the total number of full-time equivalent GPs decreased by 1.3% in the three months to December 2016. This will partly be due to increased levels of part-time working and falling retention, which, combined with the ongoing shortfalls in training places, led the National Audit Office to conclude that there may be difficulties in achieving the goal of 5,000 additional full-time equivalent doctors.
Within any care setting (hospital, primary care or community), high quality care requires the right mix of skills between different professional groups who work in multidisciplinary teams. Between 2010 and 2016, the number of full-time equivalent hospital consultants increased by 22%, while the number of nurses (including community nurses) increased by just 1%. The productivity of NHS consultants fell by an average of 2.3% a year between 2009/10 and 2015/16. Hospitals with more productive consultants were significantly more likely to have a higher proportion of nurses and clinical support staff, after controlling for other factors. This highlights how important it is to have the right mix of staff to deliver high quality and efficient care. Substantial increases in consultant numbers without an appropriate increase in the staff they rely on will undoubtedly lead to reductions in productivity.
Morale
Staff morale is also a major concern. NHS staff are committed to their work: more than three-quarters (77%) of respondents to the 2016 staff survey said they are enthusiastic about their job, and three-fifths (59%) reported they look forward to going to work. The majority (83%) also said they are satisfied with the quality of care they can give to their patients. Worryingly, fewer staff said that they are able to provide the quality that they aspire to (68%), but this is still over two-thirds.
Figure 6: Percentage of NHS staff who reported that they were made ill by work-related stress in the past 12 months
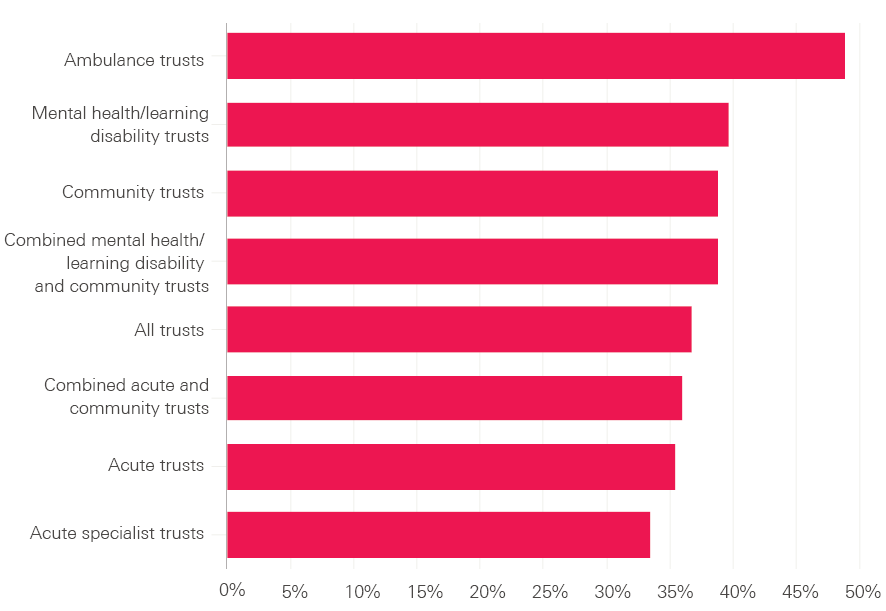
Source: 2016 NHS staff survey.
Staff are clearly under pressure. Nearly two in five staff reported that they had been ill in the past 12 months due to work-related stress (37%). This is true for nearly half (49%) of all ambulance staff (Figure 6). GPs in the UK reported the highest levels of stress among the 11 high-income countries that took part in the Commonwealth Fund Survey (Figure 7) .Following industrial action by junior doctors in 2016, Sir David Dalton, who led the negotiations for NHS Employers, identified a ‘high level of unhappiness’ among junior doctors and recommended a review on how to improve the welfare and morale of trainee doctors.
Figure 7: Percentage of GPs who said they find general practice very or extremely stressful
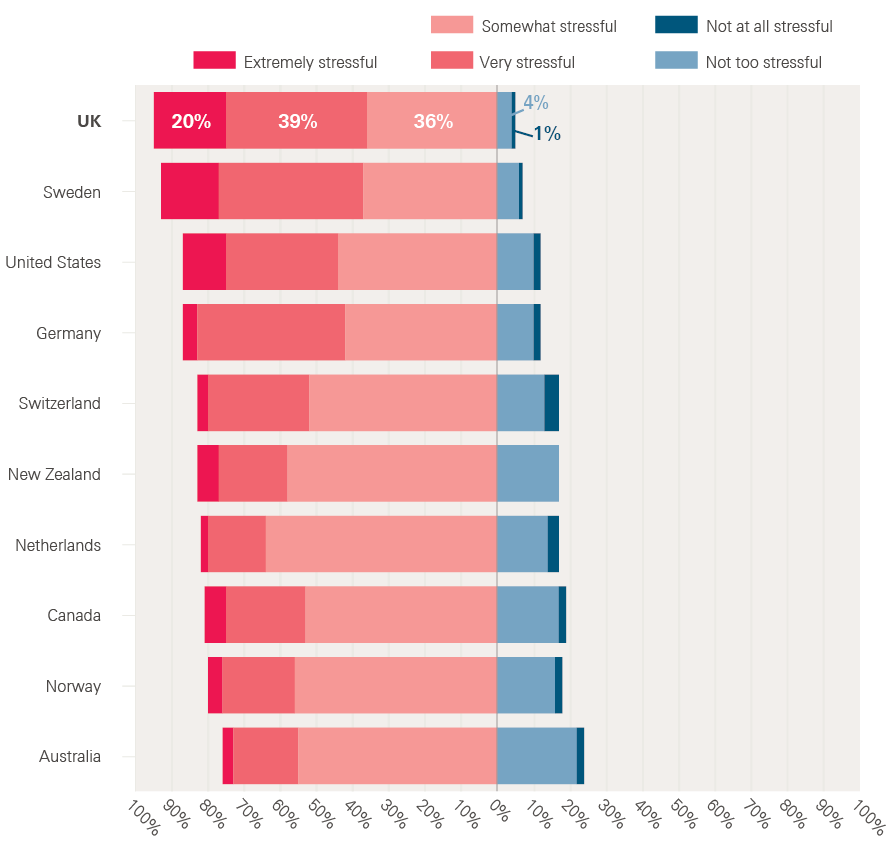
Source: Commonwealth Fund data analysed in the Health Foundation's Under pressure: What the Commonwealth Fund’s 2015 international survey of general practitioners means for the UK.
‡ Full-time equivalent data adjust for the fact that many people work part time.
§ This is the category that the Office for National Statistics uses for people working in health and social care.
¶ 83% of respondents for whom the question was applicable.
** The other countries taking part in the survey were Australia, Canada, France, Germany, the Netherlands, New Zealand, Norway, Sweden, Switzerland and the USA.
Poor planning and pay restraint
Workforce planning
The problems of recruitment, retention and morale are not new. The problems stem from a combination of piecemeal workforce planning, a long period of capped NHS pay increases, and a lack of attention to longstanding morale issues. In England, workforce policy and planning involves a constellation of 40 national-level statutory bodies, a further 15 royal colleges, 18 trade unions and over 100 professional and specialist institutions. This has led to a lack of coherence and focus in workforce policy, and the tendency for incredibly detailed work at a national level to reduce the opportunity for local flexibilities. For instance, the staff handbook – which codifies the main contract for non-medical staff, known as Agenda for Change – is the product of national negotiations and currently runs to 285 pages in 47 sections and 29 annexes.
In social care, there are around 14,000 care homes and almost 9,000 providers of services in people’s homes regulated by the Care Quality Commission. With such a fragmented provider network, workforce planning is even more complex. At present there is no national statutory body responsible for ensuring that England has a social care workforce with the skills needed to provide a high quality service. Moreover, changing patterns of need in the future will mean that health and social care will need to be integrated to deliver high quality care. This will require, as a minimum, joint working, but it will also require new roles that bridge traditional health and care boundaries. It is hard to see how this could happen without integrated workforce planning, with one overarching body that has a clear remit for health and social care.
Staff training
A major example of poor workforce planning is the current shortage of nurses. Between 2010/11 and 2012/13, the number of nurse training places was reduced by 13% (Figure 8). This directly contributed to the shortage in trained nurses able to fill current vacancies, despite the large number of people willing to train as a nurse. The number of places is now increasing again, but in 2016/17 was less than 5% above the 2010/11 level despite growing demand.
Figure 8: Total nurse training places in England, 2010/11–2016/17
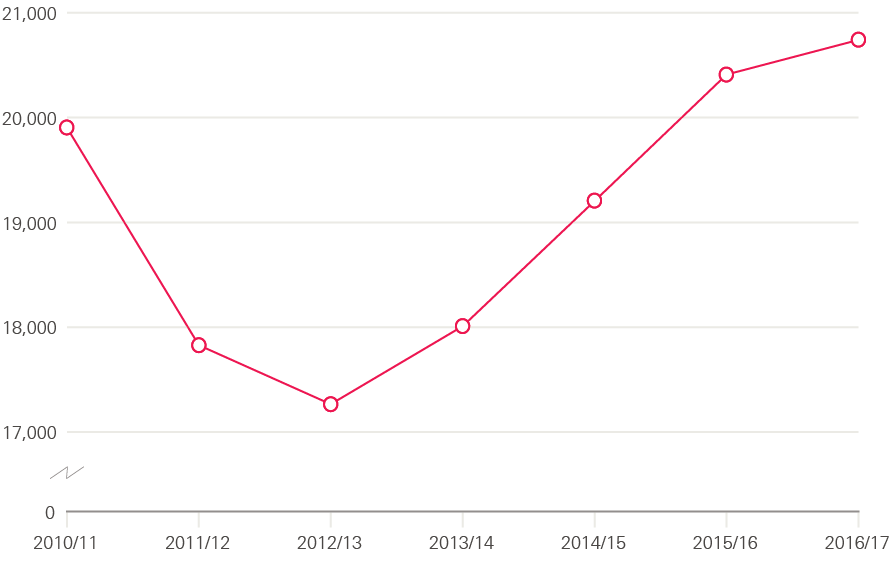
Note: Nurse training places commissioned by Health Education England or previously by strategic health authorities.
Source: Health Education England, Workforce Plan for England.
Even with this increase, courses are still heavily oversubscribed. In 2015, 57,000 people applied for the 20,000 nurse training places available; nearly two-thirds of applicants were unsuccessful despite the need for more nurses.
The traditional bursary system of funding for nurse training created an artificial cap on the number of places available (Figure 9). With the current financial pressures in the NHS, funding is not available to increase the bursaries to allow for an increase in the number of training places. So, instead, the number of bursaries have been removed to align funding for nursing degrees with other subjects. Universities will be able to offer more places and make sure that more of the people applying are successful. However, nursing students will be financed through the general student loan scheme, and this will increase the cost of education for a student nurse. This has led to a 22% drop in the number of applications from UK applicants to English providers in January 2017 compared with January 2016. But with demand for places currently so high it is unlikely to lead to a decline in applications to the extent that there would be an overall drop in the numbers of people being trained.
Figure 9: Volume of total applications and acceptances for nursing degree courses in the UK, 2007–16
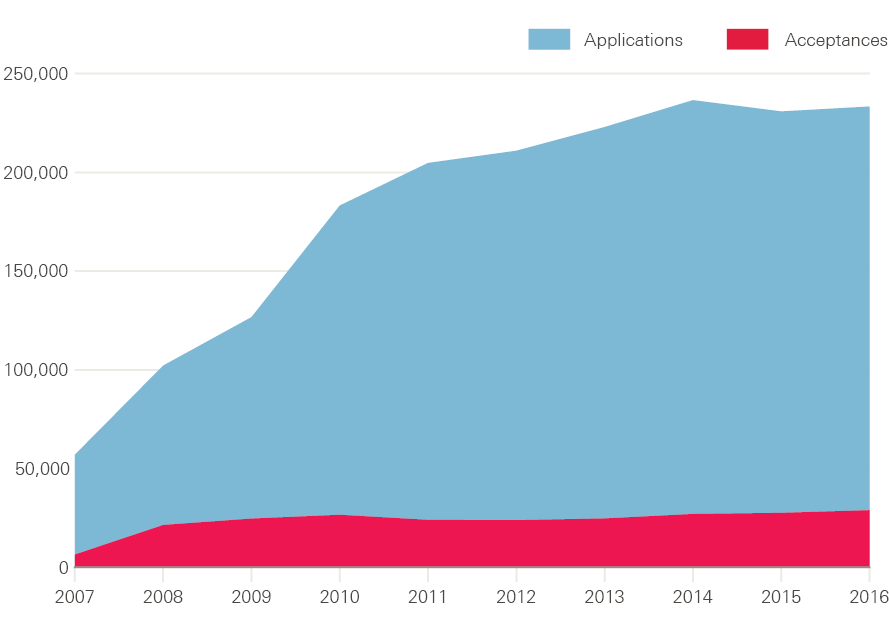
Note: Data include multiple applications for each person.
Source: UCAS.
Pay restraint and the ‘National Living Wage’
Pay is another major issue. The amount that NHS staff are paid has increased slightly in cash terms since 2010. However, someone joining the NHS in 2015/16 would on average be paid 6% less in real terms, as measured by the Consumer Price Index (CPI), than someone who joined in 2008/09.
For NHS and social care staff combined, Office for National Statistics data show that, between 2010 and 2017, the real value of health and social care staff pay fell by 5.8% (CPI). This is a larger drop than for the wider economy in the UK, where pay fell by 1.9% in real terms (Figure 10). While all sectors had similar pay decreases (in real terms) up to 2014, the rest of the economy has since partially recovered, whereas health and social care workers have not seen their pay increase significantly. As a result, many people who work in health and care will have seen their real pay fall relative to their friends’ and neighbours’.
Figure 10: Changes in pay since 2010, adjusted for CPI
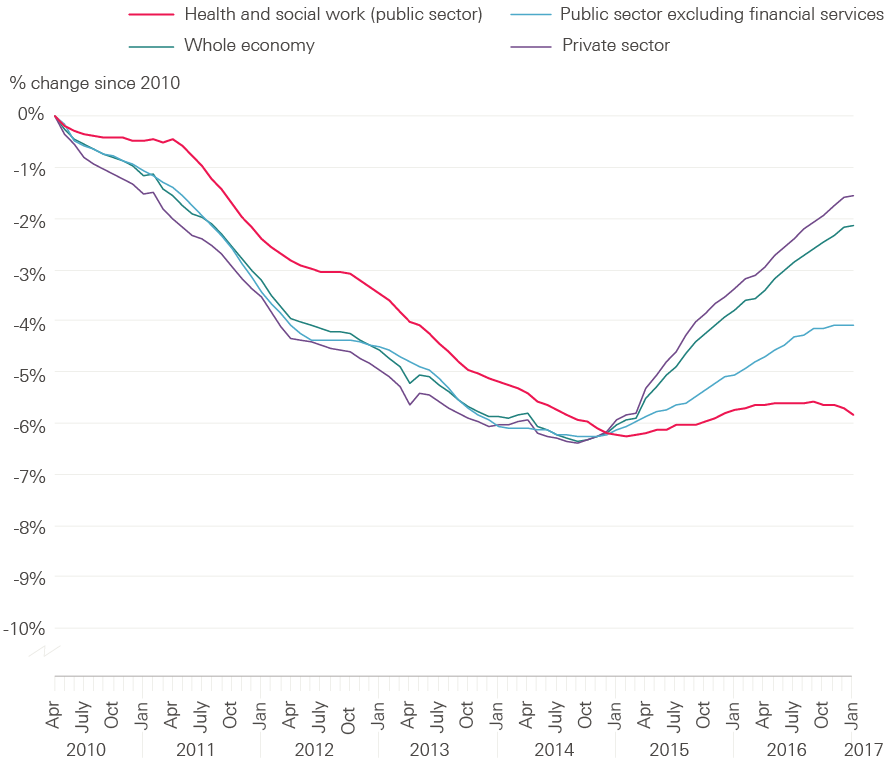
Source: Health Foundation analysis of data from the Office for National Statistics.
For nurses, this means that between 2006 and 2016 average nurse pay was overtaken by the pay for a number of different jobs. This includes garage managers, musicians, journalists, secretaries, rail transport operatives and crane drivers. The effect of falling relative pay can also be seen in social care: of those who left social care in 2015/16, more than half left the care profession altogether.
The social care sector is characterised by a large number of staff on low pay, and it is a sector that has been flagged by the Low Pay Commission as a source of concern. It found that unpaid time (such as for travel and on-call hours) and failure to factor in deductions (such as for accommodation) may mean that social care pay is lower than national statistics suggest. In fact, it estimated that around one in 10 care jobs actually paid below the minimum wage. In 2013, when HM Revenue and Customs evaluated minimum wage compliance, it found that about half (48%) of social care employers investigated were paying staff below the minimum wage.
In April 2016, the new National Living Wage increased the minimum wage for people aged 25 years and over from £6.70 an hour to £7.20, with a further increase to £7.50 in April 2017 (cash terms). This was a real-terms increase of 8% in the hourly rate in two years. In 2016, 39% of social care workers in the independent sector aged 25 years and over were paid less than £7.50 and so will have personally benefited from this increase. By 2020 the National Living Wage is projected to increase to £8.75 per hour in cash terms, which would be a real-terms increase of 15% – an average of 3.7% a year. While the increase in the National Living Wage will improve conditions for current workers, the impact on retention may be minimal as pay will also have increased in other sectors, so relative pay will not change.
But pay is not the only factor affecting social care staff – the stability and security of employment is also important. Data from the Office for National Statistics show that of all the workers in the UK who are employed on a zero-hours contract, one in five work in health and social care (in either the public or private sector). However, this partly reflects the size of the sector – with just over 4% of health and social care workers on these contracts, and 9% of businesses in health and social care making some use of zero-hours contracts. Other sources suggest that one in three care workers are on a zero-hours contract.
Future risks
Leaving the EU
The workforce challenge for health and social care is tough – recruiting enough staff, in the right roles, with the right skills, paid fairly, and enjoying their job. Continued public sector pay restraint, and changing the way care is delivered to meet changing needs, will test the resilience of the workforce and the ability of services to improve while maintaining standards of care. But the challenge has been made even harder while the implications of the UK leaving the EU are unknown.
The NHS is heavily reliant on staff from Europe, employing over 60,000 staff from the EU, equivalent to more than one in 20 NHS staff (for whom we know their nationality). One in three new nurses entering the UK register for the first time in 2015/16 had been previously registered in another EU country. In the NHS in England, 7% of nurses and health visitors are from other EU countries – and the number has increased by 85% since 2013 to 22,000, while the number from the UK or elsewhere has increased by just 3%.
With the NHS already facing major shortages in key roles, any reduction in EU staff willing to work in the UK following the country’s decision to leave the EU could have major implications for the quality and availability of services. By January 2017, the number of applications for nursing degrees from people from other EU countries was 25% lower than in January 2016 – the biggest decrease in any national group. Similarly, 3,500 nurses with EU nationality left the NHS in 2016 – twice as many as in 2014. In March, the Health Service Journal reported on modelling by the Department of Health that suggested a possible scenario for Brexit – that is, no inflow of nurses from the European Economic Area – could cause a further shortage of over 20,000 nurses on top of expected supply by 2025/26. It is hard to see how such a shortage could be filled.
These risks are even greater in social care, which is more reliant than the NHS on staff from the EU. About 7% of social care staff (around 90,000 people) are from the EU, compared with 5.5% of NHS staff. Social care is also staffed by a relatively lower-paid and lower-skilled workforce, who are more at risk of not being able to secure a visa to remain in the UK under certain options for future immigration regimes.
Future pay conditions in the NHS
Most NHS staff have faced a pay cut over recent years (Figure 10), but the NHS is facing an anticipated total of nine years of pay restraint. Current policy is that pay will continue to be capped until at least 2019/20. If this continues to 2020/21, basic pay for those in Agenda for Change Band 5 and above (625,000 staff including nurses, midwives and health visitors) will have reduced by 12% in real terms in the decade since 2010/11. This means that the pay for a nurse starting in 2020 will be worth 12% less than the pay for a nurse starting the previous decade. However, individual people working in the NHS may see their pay rise. This is largely as – on top of the headline pay award – many staff progress up the half a dozen or so ‘spine points’ within their pay band. In practice this process is automatic each year for staff not already at the top of their pay band. This progression can be worth 1–6% of their basic pay.
Figure 11: Changes in NHS pay compared with inflation and pay in the whole economy since 2010 and up to 2020
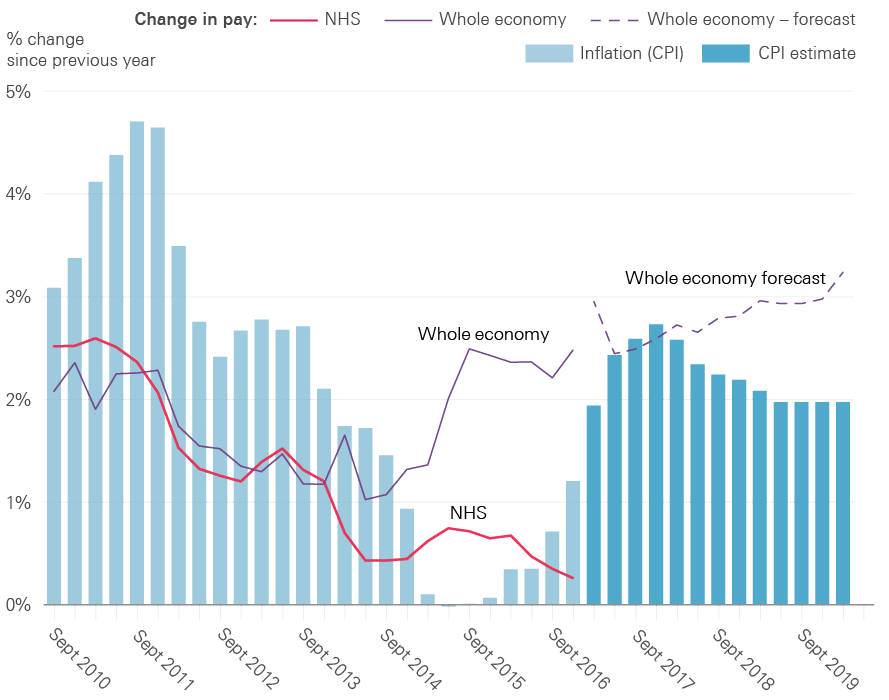
Source: Whole economy and inflation data are from OBR Economic and fiscal outlook – March 2017. NHS data are from NHS Digital (2017), NHS staff earnings estimates.
Pay policy has major implications for the ability of the NHS to live within its set budget. Worth around two-thirds of its costs, any increase in pay conditions has a major impact on spending plans. The Institute for Fiscal Studies estimated that each extra 1% increase in pay costs the NHS around £0.5 billion. With the NHS already under severe financial pressures, any improvement in pay conditions would have to be accompanied by additional national funding.
In terms of pay relative to other professions, joining the NHS is likely to become less appealing. The Office for Budget Responsibility expects wider economy earnings in the UK to improve, increasing by over twice the rate of planned NHS pay awards (Figure 11).
If pay restraint in the public sector ends in 2019/20, it will have been in place for almost a decade. The NHS will have changed, and the economy will have changed, while NHS pay stood still. Pay restraint cannot continue indefinitely without having an impact on staffing numbers and morale. There is a clear need for a statement by the next UK government about when the freeze on public sector pay will end. Moreover, while pay structures and levels have been frozen, other aspects of NHS staff reward packages have been subject to significant reform – most notably pensions and bursaries for training. NHS staff pension contributions have increased and the bursary reforms mean that nurses may need to make student loan repayments in future.
It is important not to take a narrow or short-term view of the NHS pay determination system. Its outcome is a major and highly visible element of the contract between the organisation and its workers, and it can be a powerful policy lever. It should be aligned with an overall agreed approach to NHS workforce development. If 2020 is to be the end of pay restraint, then now is the time to begin a national debate about what system should be in place afterwards. The next government will have to decide whether the current approach, with or without modification, continues to be fit for purpose, or if a new approach will be needed to sustain staffing levels, motivation and productivity, and to address regional labour market variations.
Future pay conditions in social care
The ongoing struggle to recruit and retain staff while paying them less each year is likely to bite more significantly in social care than in the NHS. This is partly as it is a more fragile system, but also because the workforce is lower paid. This means that the impact of the new National Living Wage is greater – costing the sector an extra £600 million in 2016/17. The increase in the National Living Wage will have improved conditions for current workers, but the impact on retention may be minimal as pay will also have increased in other sectors and so staff may still be tempted to change careers. Additionally, the impact of the recovery in earnings in the wider economy will be greater as other industries begin to offer jobs with pay above the minimum wage.
The National Living Wage will have implications for pay differentials between staff, particularly in social care. The relative pay for people in more senior positions and supervisory roles will reduce as the National Living Wage provides higher increases for those less senior.
There is a risk that the impact of austerity on the social care workforce will go under the radar. Social care workers do not have the benefit of a highly unionised workforce with high-profile national contract negotiation and support. Many are working in tough conditions, with low levels of job security. The incoming government needs to get to grips with terms and conditions in social care and pernicious issues such as non-compliance with the minimum wage.
*** Up to spine point 43.
Conclusion
Health and social care is a people business. The ability of these vital public services to recruit, retain and mobilise the workforce to deliver the best care as cost-effectively as possible is fundamental to a successful and sustainable health and social care system. The NHS and social care have no overarching strategy for their workforce. Piecemeal policymaking, however well-intentioned any individual initiative might be, is not serving the NHS or social care sector well. The NHS and social care will not be able to move forward to deliver sustained efficiency improvements and transform services without an effective workforce strategy.
The House of Lords’ Long-Term Sustainability of the NHS Committee, in its recent inquiry into health and social care, concluded that the absence of a comprehensive, national strategy to secure the appropriately skilled, well-trained and committed workforce over the next 10–15 years is the biggest internal threat to the sustainability of the NHS. Brexit increases those risks, placing even more importance on effective government policy and action over the next parliament. The House of Lords’ committee recommended that there should be a national strategy for the health and social care workforce, with a new single, integrated strategic workforce planning body covering both sectors. We agree with this.
What should the next government do?
A national workforce strategy needs to be produced as a matter of urgency by the next government and should address two key challenges:
- Pay – the next government needs to prepare for the end of public sector pay restraint. Without adequate preparation, the risk is that pent-up demand from staff will understandably lead only to another cycle of catch-up pay to make conditions in health and social care more favourable compared with other industries, followed again by the repeated risk of relative decline. The time is right to assess the options on how best to determine the total reward package for NHS staff, and decide if the current system continues to be fit for purpose, if it requires some alteration, or if it is time for substantial change.
-
Training, recruitment and retention – the next government needs to make sure that the NHS and social care have at least the number of people they need, reduce the reliance on internationally trained staff, and move to a policy of seeking to train more staff than will be needed. Following current plans, the NHS will still not have enough nurses to meet demand by 2020. We would argue that any solution is likely to include:
- a concrete and immediate guarantee for EU workers working in health and social care
- concrete suggestions for filling gaps in the social care workforce and effective enforcement of the National Living Wage in any green paper on social care
- the development of a robust and comprehensive workforce strategy to 2030 for health and social care – this strategy should plan for the forthcoming end of public sector pay restraint, but also consider what new skills are needed and which sectors are likely to need additional staff.